Pixie Park neighborhood in Bremerton, Washington (WA), 98312 detailed profile
Settings
X

Business Search - 14 Million verified businesses
Area: 0.340 square miles
Population: 706
Population density:
| Pixie Park: | 2,074 people per square mile |
| Bremerton: | 1,941 people per square mile |

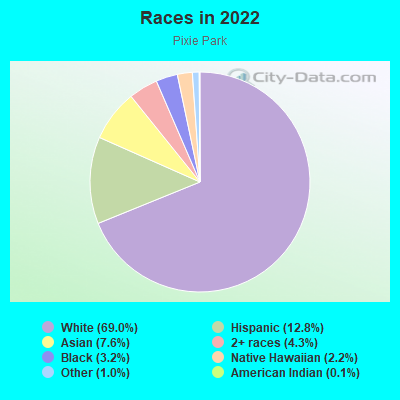
- 50269.0%White
- 9312.8%Hispanic or Latino
- 557.6%Asian
- 314.3%Two or more races
- 233.2%Black
- 162.2%Native Hawaiian and Other
Pacific Islander - 71.0%Some other race
- 10.1%American Indian
Median household income in 2022:
| Pixie Park: | $72,040 |
| Bremerton: | $68,556 |
Distribution of median household income
![Distribution of median household income]()
- 5Less than $10,000
- 71$10,000 to $19,999
- 9$20,000 to $29,999
- 16$30,000 to $39,999
- 20$40,000 to $49,999
- 6$50,000 to $59,999
- 60$60,000 to $74,999
- 43$75,000 to $99,999
- 58$100,000 to $124,999
- 47$125,000 to $149,999
- 27$150,000 to $199,999
- 4$200,000 or more

Distribution of owner-occupied house/condo value
![Distribution of owner-occupied house/condo value]()
- 9Less than $50,000
- 5$50,000 to $99,999
- 8$100,000 to $149,999
- 74$150,000 to $199,999
- 63$200,000 to $249,999
- 17$250,000 to $299,999
- 28$300,000 to $399,999
- 23$400,000 to $499,999
- 9$500,000 to $749,999
- 3$750,000 to $999,999

Distribution of rent paid by renters
![Distribution of rent paid by renters]()
- 2Less than $100
- 39$100 to $199
- 30$200 to $299
- 4$300 to $399
- 19$400 to $499
- 7$500 to $599
- 3$600 to $699
- 5$700 to $799
- 14$800 to $899
- 13$900 to $999
- 17$1,000 to $1,249
- 80$1,250 to $1,499
- 54$1,500 to $1,999
- 9$2,000 or more

Median rent in 2022:
| Pixie Park: | $1,340 |
| Bremerton: | $1,241 |
| Males: | 364 |
| Females: | 341 |
Males:
| This neighborhood: | 29.7 years |
| Whole city: | 31.5 years |
| This neighborhood: | 36.9 years |
| Whole city: | 36.2 years |
Average household size:
| Pixie Park: | 2.4 people |
| Bremerton: | 2.3 people |
Percentage of family households:
| Pixie Park: | 47.2% |
| Bremerton: | 41.1% |
| Here: | 38.2% |
| Bremerton: | 34.5% |
Percentage of married-couple families with children (among all households):
| Pixie Park: | 33.3% |
| Bremerton: | 23.9% |
Percentage of single-mother households (among all households):
| Pixie Park: | 8.3% |
| Bremerton: | 11.8% |
Percentage of never married males 15 years old and over:
Percentage of never married females 15 years old and over:
| Pixie Park: | 21.9% |
| Bremerton: | 26.7% |
Percentage of never married females 15 years old and over:
| Pixie Park: | 16.9% |
| city: | 14.6% |
Percentage of people that speak English not well or not at all:
| Pixie Park: | 0.5% |
| Bremerton: | 1.7% |
Percentage of people born in this state:
Percentage of people born in another U.S. state:
Percentage of native residents but born outside the U.S.:
Percentage of foreign born residents:
| Here: | 44.9% |
| Bremerton: | 39.8% |
Percentage of people born in another U.S. state:
| Pixie Park: | 44.6% |
| Bremerton: | 49.6% |
Percentage of native residents but born outside the U.S.:
| Here: | 1.9% |
| city: | 2.8% |
Percentage of foreign born residents:
| Here: | 8.6% |
| Bremerton: | 7.8% |
Owner-occupied
Renter-occupied

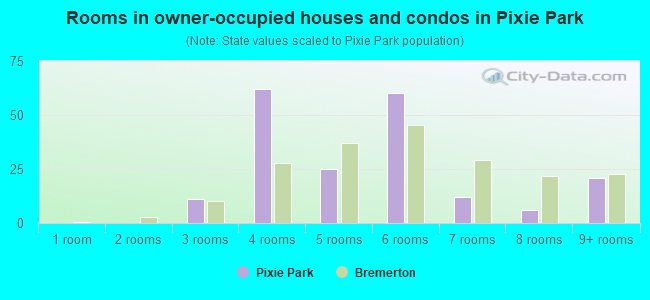
- Rooms in owner-occupied houses and condos in Pixie Park
- 01 room
- 02 rooms
- 113 rooms
- 624 rooms
- 255 rooms
- 606 rooms
- 127 rooms
- 68 rooms
- 219+ rooms
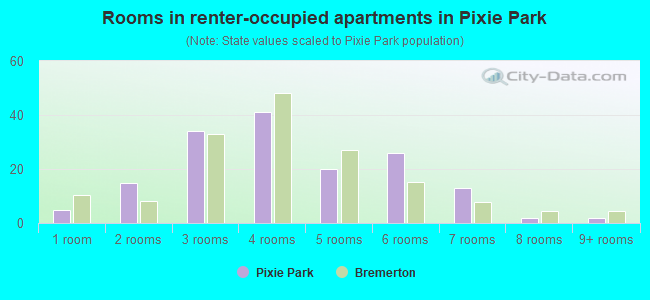
- Rooms in renter-occupied apartments in Pixie Park
- 51 room
- 152 rooms
- 343 rooms
- 414 rooms
- 205 rooms
- 266 rooms
- 137 rooms
- 28 rooms
- 29+ rooms
Owner-occupied
Renter-occupied
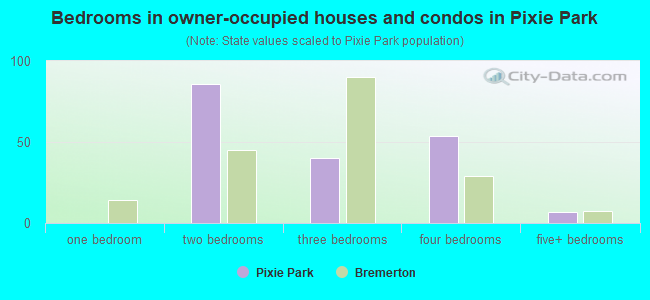
- Bedrooms in owner-occupied houses and condos in Pixie Park
- 0no bedroom
- 01 bedroom
- 862 bedrooms
- 403 bedrooms
- 544 bedrooms
- 75+ bedrooms
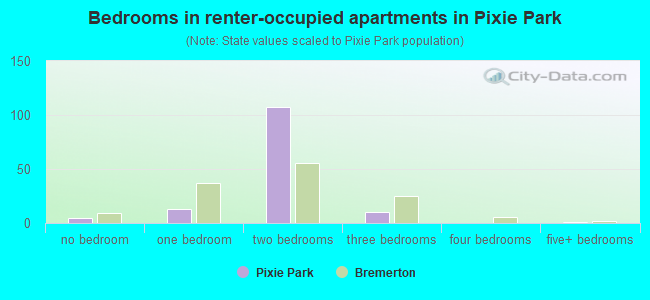
- Bedrooms in renter-occupied apartments in Pixie Park
- 5no bedroom
- 131 bedroom
- 1072 bedrooms
- 103 bedrooms
- 04 bedrooms
- 15+ bedrooms
Average number of cars or other vehicles available in houses/condos:
Average number of cars or other vehicles available in apartments:
| This neighborhood: | 2.0 |
| Bremerton: | 2.0 |
Average number of cars or other vehicles available in apartments:
| Here: | 1.5 |
| city: | 1.3 |
Percentage of units with a mortgage:
| Pixie Park: | 79.7% |
| Bremerton: | 74.1% |
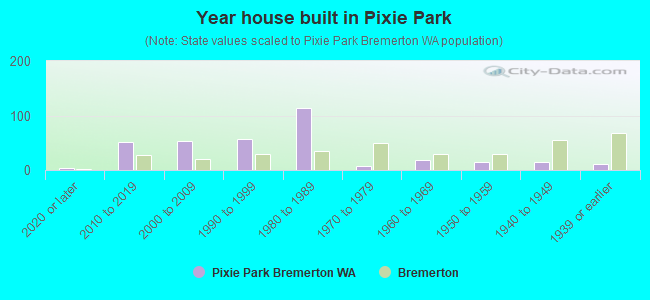
- Year house built in Pixie Park
- 42020 or later
- 512010 to 2019
- 542000 to 2009
- 561990 to 1999
- 1141980 to 1989
- 81970 to 1979
- 181960 to 1969
- 141950 to 1959
- 151940 to 1949
- 111939 or earlier
City-data.com crime index for city in 2020 (higher means more crime):
| City: | 262.1 |
| U.S. average: | 219.5 |
Travel time to work (commute)
![Travel time to work (commute)]()
- 13Less than 5 minutes
- 205 to 9 minutes
- 5510 to 14 minutes
- 6615 to 19 minutes
- 4820 to 24 minutes
- 1025 to 29 minutes
- 3730 to 34 minutes
- 635 to 39 minutes
- 940 to 44 minutes
- 1445 to 59 minutes
- 2460 to 89 minutes
- 2590 or more minutes

Means of transportation to work
![Means of transportation to work]()
- 81.7%319Drove a car alone
- 7.4%29Carpooled
- 1.5%6Bus
- 0.3%1Long-distance train or commuter rail
- 5.1%20Ferryboat
- 1.3%5Motorcycle
- 0.5%2Bicycle
- 1.0%4Walked
- 0.3%1Other means
- 4.1%16Worked at home

Time leaving home to go to work
![Time leaving home to go to work]()
- 2812:00 a.m. to 4:59 a.m.
- 165:00 a.m. to 5:29 a.m.
- 315:30 a.m. to 5:59 a.m.
- 306:00 a.m. to 6:29 a.m.
- 336:30 a.m. to 6:59 a.m.
- 417:00 a.m. to 7:29 a.m.
- 247:30 a.m. to 7:59 a.m.
- 148:00 a.m. to 8:29 a.m.
- 68:30 a.m. to 8:59 a.m.
- 219:00 a.m. to 9:59 a.m.
- 1110:00 a.m. to 10:59 a.m.
- 611:00 a.m. to 11:59 a.m.
- 3512:00 p.m. to 3:59 p.m.
- 224:00 p.m. to 11:59 p.m.

Occupations of males:
- Percentage of males in management occupations (except farmers):
Here: 14.7% city: 10.0%
- Percentage of males in business and financial operations occupations:
Here: 1.6% city: 5.0%
- Percentage of males in architecture and engineering occupations:
Here: 1.9% city: 4.6%
- Percentage of males in legal occupations:
Here: 1.1% city: 0.2%
- Percentage of males in healthcare practitioners and technical occupations:
Here: 5.6% city: 2.1%
- Percentage of males in service occupations:
Here: 3.8% city: 13.2%
- Percentage of males in sales and office occupations:
Here: 8.6% city: 15.7%
- Percentage of males in construction, extraction, and maintenance occupations:
Here: 18.1% city: 9.0%
- Percentage of males in production occupations:
Here: 18.4% city: 8.8%
- Percentage of males in transportation occupations:
Here: 1.0% city: 4.9%
- Percentage of males in material moving occupations:
Here: 12.4% city: 7.0%
Occupations of females:
- Percentage of females in management occupations (except farmers):
Here: 11.4% city: 7.9%
- Percentage of females in business and financial operations occupations:
Here: 19.6% city: 6.5%
- Percentage of females in life, physical, and social science occupations:
Here: 3.3% city: 1.2%
- Percentage of females in legal occupations:
Here: 4.6% city: 0.5%
- Percentage of females in education, training, and library occupations:
Here: 4.6% city: 7.2%
- Percentage of females in arts, design, entertainment, sports, and media occupations:
Here: 5.5% city: 2.5%
- Percentage of females in healthcare practitioners and technical occupations:
Here: 13.7% city: 9.0%
- Percentage of females in service occupations:
Here: 16.7% city: 25.1%
- Percentage of females in sales and office occupations:
Here: 25.9% city: 28.3%
- Percentage of females in construction, extraction, and maintenance occupations:
Here: 1.3% city: 0.9%
- Percentage of females in production occupations:
Here: 7.5% city: 0.6%
- Percentage of females in transportation occupations:
Here: 1.6% city: 1.7%
Percentage of people 16-64 in Armed Forces:
| Pixie Park: | 2.7% |
| Bremerton: | 14.7% |
Education in this neighborhood (subdivision or community):
- Percentage of people 3 years and older in K-12 schools:
Pixie Park: 12.5% Bremerton: 11.5%
- Percentage of people 3 years and older in undergraduate colleges:
Pixie Park: 11.2% Bremerton: 5.5%
- Percentage of people 3 years and older in grad. or professional schools:
Pixie Park: 1.4% Bremerton: 1.0%
- Percentage of students K-12 enrolled in private schools:
Pixie Park: 15.9% Bremerton: 14.3%
Percentage of population below poverty level:
| Pixie Park: | 20.3% |
| Bremerton: | 14.3% |
Median year owner moved in (as recorded in 2022):
Median year renter moved in (as recorded in 2022):
| Pixie Park: | 2013 |
| Bremerton: | 2012 |
Median year renter moved in (as recorded in 2022):
| Pixie Park: | 2015 |
| Bremerton: | 2018 |
Percentage of married-couple families with both working:
| Pixie Park: | 115.4% |
| Bremerton: | 56.6% |
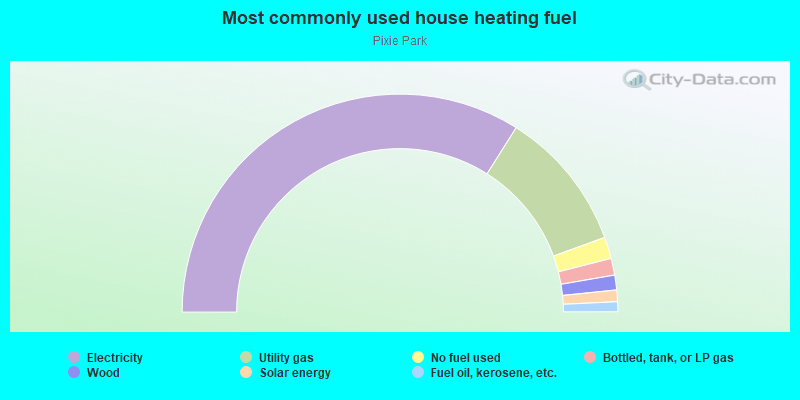
- 67.9%Electricity
- 21.0%Utility gas
- 3.2%No fuel used
- 2.5%Bottled, tank, or LP gas
- 2.2%Wood
- 1.7%Solar energy
- 1.5%Fuel oil, kerosene, etc.
Roads and streets:
Oyster Bay Ave S
Length: 0.58 miles
Directions: N-S, SE-NW, SW-NE
Address range: 500 to 1699
Directions: N-S, SE-NW, SW-NE
Address range: 500 to 1699
Roosevelt Blvd W (Roosevelt Blvd)
Length: 0.47 miles
Directions: E-W, N-S, SW-NE
Address range: 4400 to 5099
Directions: E-W, N-S, SW-NE
Address range: 4400 to 5099
Union Ave
Length: 0.47 miles
Directions: E-W, N-S, SE-NW, SW-NE
Address range: 400 to 1299
Directions: E-W, N-S, SE-NW, SW-NE
Address range: 400 to 1299
Poindexter Ave W
Length: 0.32 miles
Directions: N-S, SE-NW
Address range: 1000 to 1399
Directions: N-S, SE-NW
Address range: 1000 to 1399
Werner Rd (W Werner Rd, K St)
Length: 0.30 miles
Direction: E-W
Address range: 4600 to 4799
Direction: E-W
Address range: 4600 to 4799
Bayview Dr (Bayview Dr W)
Length: 0.29 miles
Directions: N-S, SW-NE
Address range: 1200 to 1399
Directions: N-S, SW-NE
Address range: 1200 to 1399
W Hills Blvd
Length: 0.26 miles
Directions: N-S, SE-NW
Address range: 500 to 1099
Directions: N-S, SE-NW
Address range: 500 to 1099
Haselwood St
Length: 0.24 miles
Direction: E-W
Address range: 500 to 798
Direction: E-W
Address range: 500 to 798
Werner Rd
Length: 0.24 miles
Direction: E-W
Address range: 4810 to 4849
Direction: E-W
Address range: 4810 to 4849
Lansing Ave W (Lansing St W)
Length: 0.21 miles
Direction: N-S
Address range: 1200 to 1399
Direction: N-S
Address range: 1200 to 1399
Cottman Ave
Length: 0.21 miles
Direction: N-S
Address range: 1200 to 1699
Direction: N-S
Address range: 1200 to 1699
Humphrey Ave W (Humphrey St W)
Length: 0.20 miles
Direction: N-S
Address range: 1001 to 1399
Direction: N-S
Address range: 1001 to 1399
Daniels Ct (Daniels Ave, Daniels Ln, Daniels St)
Length: 0.19 miles
Directions: E-W, N-S, SE-NW, SW-NE
Address range: 1100 to 1399
Directions: E-W, N-S, SE-NW, SW-NE
Address range: 1100 to 1399
Union Ave W
Length: 0.14 miles
Direction: N-S
Address range: 507 to 748
Direction: N-S
Address range: 507 to 748
D St
Length: 0.11 miles
Direction: E-W
Direction: E-W
Jones St W
Length: 0.11 miles
Direction: SW-NE
Address range: 4400 to 4499
Direction: SW-NE
Address range: 4400 to 4499
H St
Length: 0.10 miles
Directions: E-W, SE-NW
Address range: 4301 to 4399
Directions: E-W, SE-NW
Address range: 4301 to 4399
W C St (C St)
Length: 0.10 miles
Direction: E-W
Address range: 4300 to 4399
Direction: E-W
Address range: 4300 to 4399
Barnes St (Barnes St W)
Length: 0.09 miles
Direction: SW-NE
Address range: 4400 to 4499
Direction: SW-NE
Address range: 4400 to 4499
W Zircon Ln
Length: 0.09 miles
Directions: E-W, N-S, SW-NE
Address range: 1500 to 1599
Directions: E-W, N-S, SW-NE
Address range: 1500 to 1599
Daniels Ln
Length: 0.09 miles
Directions: N-S, SW-NE
Directions: N-S, SW-NE
Peters Rd
Length: 0.09 miles
Direction: SE-NW
Address range: 4800 to 4899
Direction: SE-NW
Address range: 4800 to 4899
3rd Ave W
Length: 0.08 miles
Direction: N-S
Direction: N-S
Wilson Blvd
Length: 0.06 miles
Direction: SE-NW
Address range: 4500 to 4599
Direction: SE-NW
Address range: 4500 to 4599