Ransom Place neighborhood in Indianapolis, Indiana (IN), 46202 detailed profile
Settings
X


Business Search - 14 Million verified businesses
Area: 0.037 square miles
Population: 469
Population density:
| Ransom Place: | 12,844 people per square mile |
| Indianapolis: | 2,425 people per square mile |

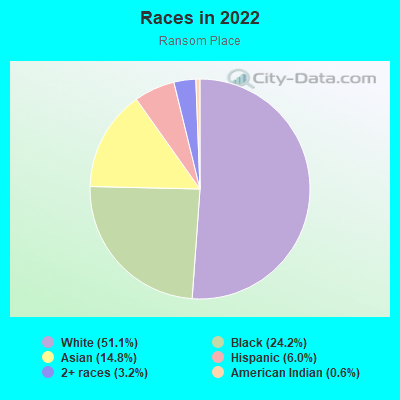
- 23851.1%White
- 11324.2%Black
- 6914.8%Asian
- 286.0%Hispanic or Latino
- 153.2%Two or more races
- 30.6%American Indian
Median household income in 2022:
| Ransom Place: | $36,858 |
| Indianapolis: | $61,501 |
Distribution of median household income
![Distribution of median household income]()
- 63Less than $10,000
- 58$10,000 to $19,999
- 9$20,000 to $29,999
- 14$30,000 to $39,999
- 37$40,000 to $49,999
- 19$50,000 to $59,999
- 7$60,000 to $74,999
- 45$75,000 to $99,999
- 17$100,000 to $124,999
- 2$125,000 to $149,999
- 5$200,000 or more

Distribution of owner-occupied house/condo value
![Distribution of owner-occupied house/condo value]()
- 1Less than $50,000
- 2$50,000 to $99,999
- 23$150,000 to $199,999
- 3$250,000 to $299,999
- 4$300,000 to $399,999
- 8$400,000 to $499,999
- 3$1,000,000 or more

Distribution of rent paid by renters
![Distribution of rent paid by renters]()
- 14$100 to $199
- 9$200 to $299
- 16$300 to $399
- 7$400 to $499
- 3$700 to $799
- 4$800 to $899
- 42$900 to $999
- 101$1,000 to $1,249
- 23$1,250 to $1,499
- 17$1,500 to $1,999

Median rent in 2022:
| Ransom Place: | $1,059 |
| Indianapolis: | $846 |
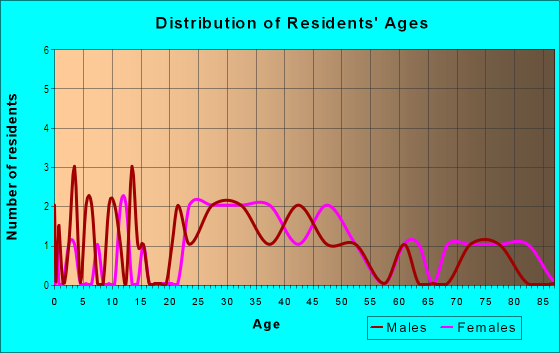
| Males: | 239 |
| Females: | 229 |
Males:
| This neighborhood: | 24.4 years |
| Whole city: | 32.9 years |
| This neighborhood: | 24.5 years |
| Whole city: | 35.4 years |
Average household size:
| Ransom Place: | 1.7 people |
| Indianapolis: | 2.3 people |
Percentage of family households:
| Ransom Place: | 12.2% |
| Indianapolis: | 42.9% |
| Here: | 9.4% |
| Indianapolis: | 37.4% |
Percentage of married-couple families with children (among all households):
| Ransom Place: | 0.0% |
| Indianapolis: | 26.5% |
Percentage of single-mother households (among all households):
| Ransom Place: | 7.5% |
| Indianapolis: | 12.9% |
Percentage of never married males 15 years old and over:
Percentage of never married females 15 years old and over:
| Ransom Place: | 40.9% |
| Indianapolis: | 19.9% |
Percentage of never married females 15 years old and over:
| Ransom Place: | 36.3% |
| city: | 19.2% |
Percentage of people that speak English not well or not at all:
| Ransom Place: | 0.0% |
| Indianapolis: | 4.2% |
Percentage of people born in this state:
Percentage of people born in another U.S. state:
Percentage of native residents but born outside the U.S.:
Percentage of foreign born residents:
| Here: | 56.3% |
| Indianapolis: | 63.1% |
Percentage of people born in another U.S. state:
| Ransom Place: | 28.0% |
| Indianapolis: | 23.6% |
Percentage of native residents but born outside the U.S.:
| Here: | 0.0% |
| city: | 1.1% |
Percentage of foreign born residents:
| Here: | 15.7% |
| Indianapolis: | 12.2% |
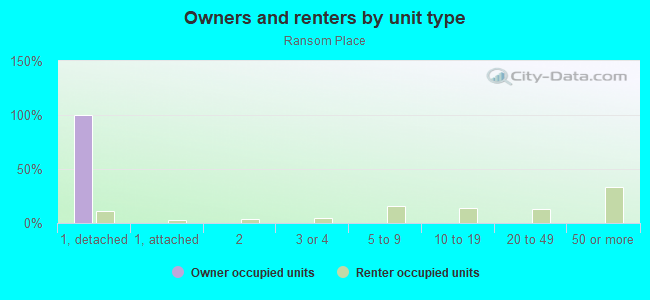
Owner-occupied
Renter-occupied

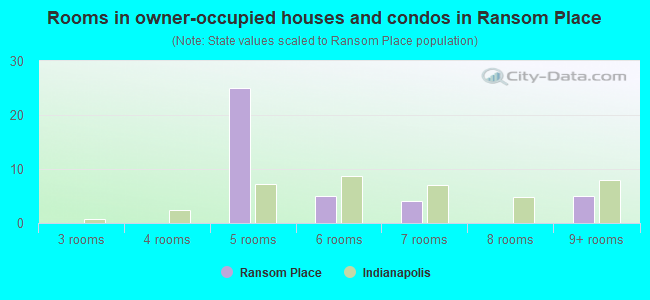
- Rooms in owner-occupied houses and condos in Ransom Place
- 01 room
- 02 rooms
- 03 rooms
- 04 rooms
- 255 rooms
- 56 rooms
- 47 rooms
- 08 rooms
- 59+ rooms
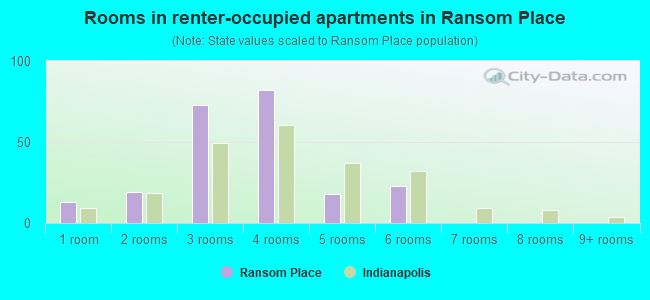
- Rooms in renter-occupied apartments in Ransom Place
- 131 room
- 192 rooms
- 733 rooms
- 824 rooms
- 185 rooms
- 236 rooms
- 07 rooms
- 08 rooms
- 09+ rooms
Owner-occupied
Renter-occupied
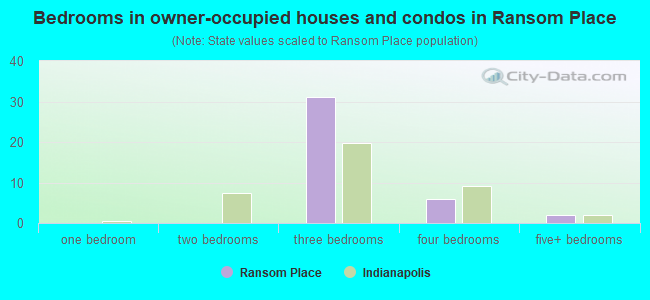
- Bedrooms in owner-occupied houses and condos in Ransom Place
- 0no bedroom
- 01 bedroom
- 02 bedrooms
- 313 bedrooms
- 64 bedrooms
- 25+ bedrooms
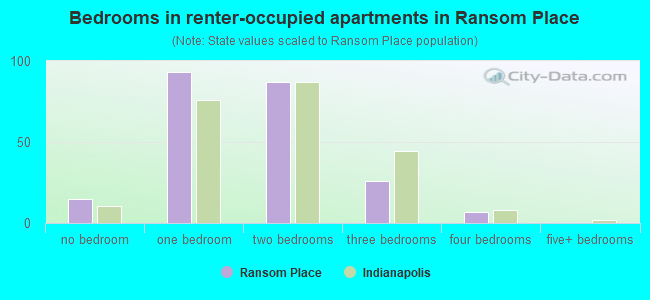
- Bedrooms in renter-occupied apartments in Ransom Place
- 15no bedroom
- 931 bedroom
- 872 bedrooms
- 263 bedrooms
- 74 bedrooms
- 05+ bedrooms
Average number of cars or other vehicles available in houses/condos:
Average number of cars or other vehicles available in apartments:
| This neighborhood: | 0.8 |
| Indianapolis: | 2.0 |
Average number of cars or other vehicles available in apartments:
| Here: | 1.2 |
| city: | 1.2 |
Percentage of units with a mortgage:
| Ransom Place: | 78.8% |
| Indianapolis: | 68.8% |
Average estimated value of detached houses in 2022 (26.6% of all units):
| Ransom Place: | $547,024 |
| Indiana: | $257,916 |
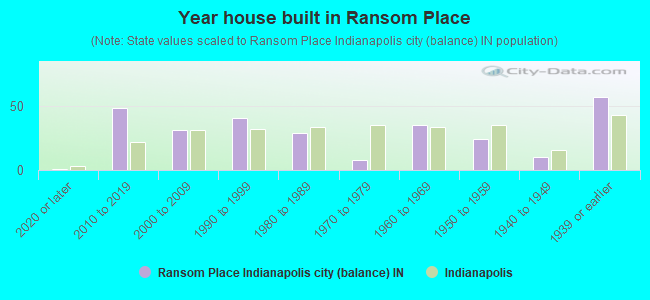
- Year house built in Ransom Place
- 12020 or later
- 492010 to 2019
- 312000 to 2009
- 411990 to 1999
- 291980 to 1989
- 81970 to 1979
- 351960 to 1969
- 241950 to 1959
- 101940 to 1949
- 571939 or earlier
City-data.com crime index for city in 2020 (higher means more crime):
| City: | 465.4 |
| U.S. average: | 219.5 |
Travel time to work (commute)
![Travel time to work (commute)]()
- 8Less than 5 minutes
- 295 to 9 minutes
- 7110 to 14 minutes
- 4615 to 19 minutes
- 2120 to 24 minutes
- 625 to 29 minutes
- 630 to 34 minutes
- 635 to 39 minutes
- 1245 to 59 minutes
- 960 to 89 minutes

Means of transportation to work
![Means of transportation to work]()
- 42.3%109Drove a car alone
- 7.0%18Carpooled
- 5.4%14Bus
- 3.9%10Bicycle
- 24.5%63Walked
- 1.2%3Other means
- 14.0%36Worked at home

Time leaving home to go to work
![Time leaving home to go to work]()
- 312:00 a.m. to 4:59 a.m.
- 16:30 a.m. to 6:59 a.m.
- 247:00 a.m. to 7:29 a.m.
- 227:30 a.m. to 7:59 a.m.
- 528:00 a.m. to 8:29 a.m.
- 218:30 a.m. to 8:59 a.m.
- 419:00 a.m. to 9:59 a.m.
- 1910:00 a.m. to 10:59 a.m.
- 1011:00 a.m. to 11:59 a.m.
- 712:00 p.m. to 3:59 p.m.
- 154:00 p.m. to 11:59 p.m.

Occupations of males:
- Percentage of males in management occupations (except farmers):
Here: 6.0% city: 10.3%
- Percentage of males in computer and mathematical occupations:
Here: 10.0% city: 4.6%
- Percentage of males in life, physical, and social science occupations:
Here: 9.6% city: 1.0%
- Percentage of males in community and social services occupations:
Here: 8.5% city: 1.3%
- Percentage of males in legal occupations:
Here: 4.3% city: 1.4%
- Percentage of males in education, training, and library occupations:
Here: 7.2% city: 2.8%
- Percentage of males in arts, design, entertainment, sports, and media occupations:
Here: 14.4% city: 1.9%
- Percentage of males in healthcare practitioners and technical occupations:
Here: 1.5% city: 2.7%
- Percentage of males in service occupations:
Here: 7.0% city: 12.5%
- Percentage of males in sales and office occupations:
Here: 15.7% city: 15.6%
- Percentage of males in construction, extraction, and maintenance occupations:
Here: 2.6% city: 7.9%
- Percentage of males in production occupations:
Here: 2.3% city: 9.0%
- Percentage of males in transportation occupations:
Here: 1.2% city: 6.4%
- Percentage of males in material moving occupations:
Here: 6.6% city: 9.4%
Occupations of females:
- Percentage of females in business and financial operations occupations:
Here: 2.3% city: 6.9%
- Percentage of females in computer and mathematical occupations:
Here: 3.2% city: 2.0%
- Percentage of females in life, physical, and social science occupations:
Here: 4.3% city: 1.2%
- Percentage of females in education, training, and library occupations:
Here: 23.0% city: 7.5%
- Percentage of females in arts, design, entertainment, sports, and media occupations:
Here: 7.3% city: 2.1%
- Percentage of females in healthcare practitioners and technical occupations:
Here: 6.6% city: 10.8%
- Percentage of females in service occupations:
Here: 23.7% city: 18.5%
- Percentage of females in sales and office occupations:
Here: 29.6% city: 26.4%
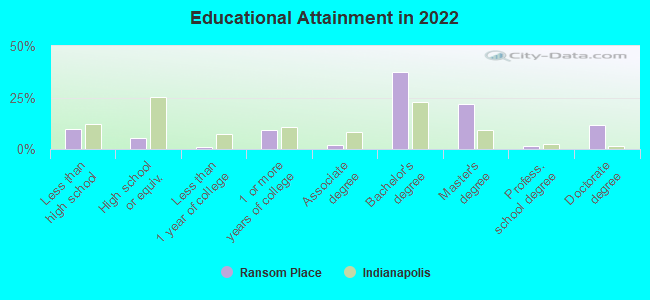
Education in this neighborhood (subdivision or community):
- Percentage of people 3 years and older in K-12 schools:
Ransom Place: 1.1% Indianapolis: 17.3%
- Percentage of people 3 years and older in undergraduate colleges:
Ransom Place: 36.0% Indianapolis: 4.5%
- Percentage of people 3 years and older in grad. or professional schools:
Ransom Place: 13.9% Indianapolis: 1.9%
- Percentage of students K-12 enrolled in private schools:
Ransom Place: 0.0% Indianapolis: 14.8%
Percentage of population below poverty level:
| Ransom Place: | 48.2% |
| Indianapolis: | 15.9% |
Median year owner moved in (as recorded in 2022):
Median year renter moved in (as recorded in 2022):
| Ransom Place: | 2004 |
| Indianapolis: | 2012 |
Median year renter moved in (as recorded in 2022):
| Ransom Place: | 2018 |
| Indianapolis: | 2020 |
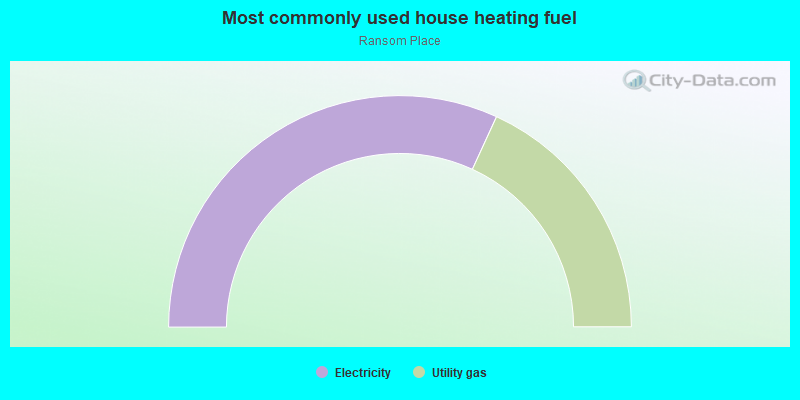
- 63.7%Electricity
- 36.3%Utility gas
Roads and streets:
W 9th St
Length: 0.21 miles
Direction: E-W
Address range: 500 to 799
Direction: E-W
Address range: 500 to 799
W St Clair St
Length: 0.16 miles
Direction: E-W
Address range: 603 to 799
Direction: E-W
Address range: 603 to 799
Paca St
Length: 0.15 miles
Direction: N-S
Address range: 800 to 961
Direction: N-S
Address range: 800 to 961
Camp St
Length: 0.09 miles
Direction: N-S
Address range: 800 to 899
Direction: N-S
Address range: 800 to 899
N Alley 650 W
Length: 0.09 miles
Direction: N-S
Direction: N-S
N California St
Length: 0.09 miles
Direction: N-S
Address range: 800 to 899
Direction: N-S
Address range: 800 to 899
Dr M L King Jr St
Length: 0.06 miles
Direction: N-S
Direction: N-S