Stallion (Shadowsprings) neighborhood in San Jose, California (CA), 95121 detailed profile
Settings
X

Business Search - 14 Million verified businesses
Area: 0.152 square miles
Population: 1,292
Population density:
| Stallion (Shadowsprings): | 8,498 people per square mile |
| San Jose: | 5,554 people per square mile |

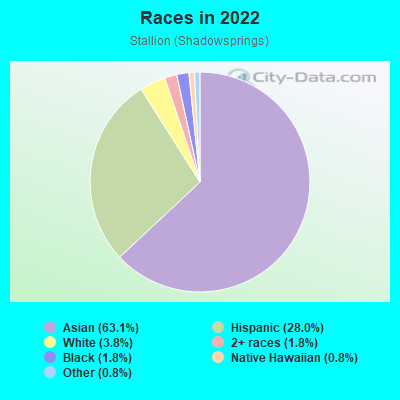
- 82263.1%Asian
- 36428.0%Hispanic or Latino
- 493.8%White
- 231.8%Black
- 241.8%Two or more races
- 100.8%Native Hawaiian and Other
Pacific Islander - 100.8%Some other race
Median household income in 2022:
| Stallion (Shadowsprings): | $121,715 |
| San Jose: | $133,835 |
Distribution of median household income
![Distribution of median household income]()
- 6Less than $10,000
- 20$10,000 to $19,999
- 29$20,000 to $29,999
- 18$30,000 to $39,999
- 17$40,000 to $49,999
- 26$50,000 to $59,999
- 29$60,000 to $74,999
- 24$75,000 to $99,999
- 54$100,000 to $124,999
- 47$125,000 to $149,999
- 66$150,000 to $199,999
- 93$200,000 or more

Distribution of owner-occupied house/condo value
![Distribution of owner-occupied house/condo value]()
- 10Less than $50,000
- 32$50,000 to $99,999
- 13$100,000 to $149,999
- 18$150,000 to $199,999
- 36$200,000 to $249,999
- 18$250,000 to $299,999
- 54$300,000 to $399,999
- 28$400,000 to $499,999
- 23$500,000 to $749,999
- 139$750,000 to $999,999
- 135$1,000,000 or more

Distribution of rent paid by renters
![Distribution of rent paid by renters]()
- 3$100 to $199
- 28$200 to $299
- 6$300 to $399
- 2$400 to $499
- 15$500 to $599
- 1$600 to $699
- 14$800 to $899
- 2$900 to $999
- 24$1,000 to $1,249
- 9$1,250 to $1,499
- 15$1,500 to $1,999
- 106$2,000 or more

Median rent in 2022:
| Stallion (Shadowsprings): | $2,830 |
| San Jose: | $2,001 |
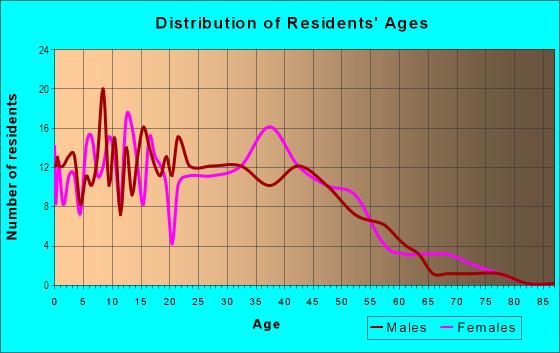
| Males: | 662 |
| Females: | 629 |
Males:
| This neighborhood: | 41.9 years |
| Whole city: | 37.6 years |
| This neighborhood: | 43.1 years |
| Whole city: | 39.1 years |
Average household size:
| Stallion (Shadowsprings): | 17.2 people |
| San Jose: | 2.9 people |
Percentage of family households:
| Stallion (Shadowsprings): | 51.6% |
| San Jose: | 49.9% |
| Here: | 70.7% |
| San Jose: | 53.0% |
Percentage of married-couple families with children (among all households):
| Stallion (Shadowsprings): | 22.2% |
| San Jose: | 25.8% |
Percentage of single-mother households (among all households):
| Stallion (Shadowsprings): | 3.4% |
| San Jose: | 5.2% |
Percentage of never married males 15 years old and over:
Percentage of never married females 15 years old and over:
| Stallion (Shadowsprings): | 16.3% |
| San Jose: | 20.9% |
Percentage of never married females 15 years old and over:
| Stallion (Shadowsprings): | 13.4% |
| city: | 16.7% |
Percentage of people that speak English not well or not at all:
| Stallion (Shadowsprings): | 32.4% |
| San Jose: | 11.4% |
Percentage of people born in this state:
Percentage of people born in another U.S. state:
Percentage of native residents but born outside the U.S.:
Percentage of foreign born residents:
| Here: | 35.2% |
| San Jose: | 46.1% |
Percentage of people born in another U.S. state:
| Stallion (Shadowsprings): | 4.8% |
| San Jose: | 10.4% |
Percentage of native residents but born outside the U.S.:
| Here: | 1.4% |
| city: | 1.7% |
Percentage of foreign born residents:
| Here: | 58.6% |
| San Jose: | 41.8% |
Owner-occupied
Renter-occupied

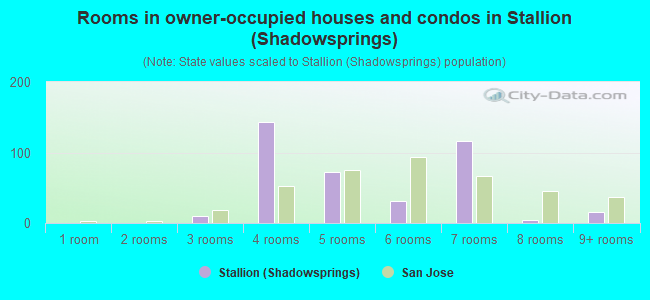
- Rooms in owner-occupied houses and condos in Stallion <
> - 01 room
- 02 rooms
- 103 rooms
- 1434 rooms
- 735 rooms
- 316 rooms
- 1177 rooms
- 48 rooms
- 159+ rooms
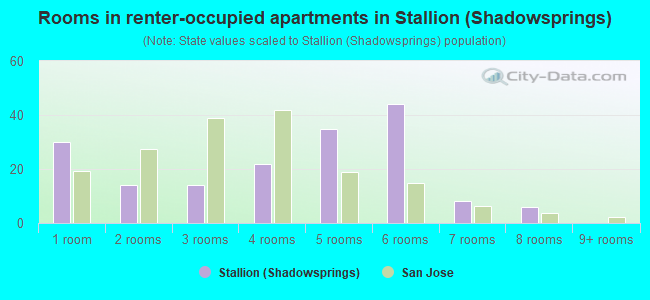
- Rooms in renter-occupied apartments in Stallion <
> - 301 room
- 142 rooms
- 143 rooms
- 224 rooms
- 355 rooms
- 446 rooms
- 87 rooms
- 68 rooms
- 09+ rooms
Owner-occupied
Renter-occupied
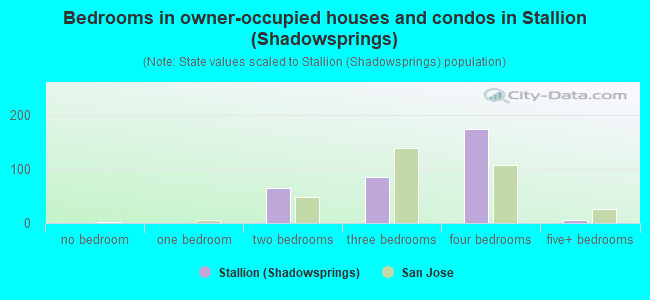
- Bedrooms in owner-occupied houses and condos in Stallion <
> - 0no bedroom
- 01 bedroom
- 652 bedrooms
- 853 bedrooms
- 1744 bedrooms
- 55+ bedrooms
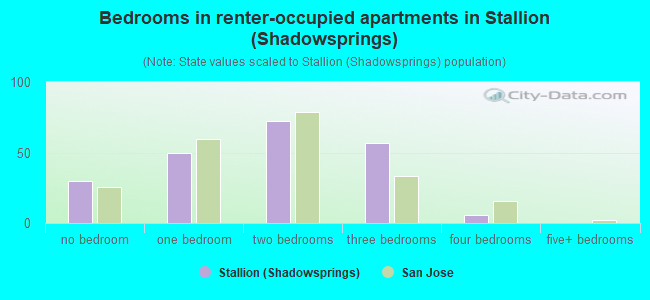
- Bedrooms in renter-occupied apartments in Stallion <
> - 30no bedroom
- 501 bedroom
- 722 bedrooms
- 573 bedrooms
- 64 bedrooms
- 05+ bedrooms
Average number of cars or other vehicles available in houses/condos:
Average number of cars or other vehicles available in apartments:
| This neighborhood: | 3.0 |
| San Jose: | 2.3 |
Average number of cars or other vehicles available in apartments:
| Here: | 2.1 |
| city: | 1.6 |
Percentage of units with a mortgage:
| Stallion (Shadowsprings): | 47.5% |
| San Jose: | 66.9% |
Housing prices:
- Average estimated value of detached houses in 2022 (74.0% of all units):
Stallion (Shadowsprings): $769,435 San Jose: $1,532,815
- Average estimated value of mobile home in 2022 (38.1% of all units):
Stallion (Shadowsprings): $253,112 San Jose: $237,683
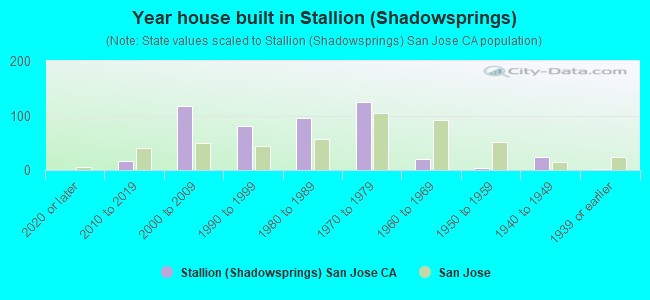
- Year house built in Stallion <
> - 02020 or later
- 162010 to 2019
- 1182000 to 2009
- 811990 to 1999
- 961980 to 1989
- 1241970 to 1979
- 201960 to 1969
- 41950 to 1959
- 231940 to 1949
- 11939 or earlier
City-data.com crime index for city in 2020 (higher means more crime):
| City: | 268.4 |
| U.S. average: | 219.5 |
Travel time to work (commute)
![Travel time to work (commute)]()
- 235 to 9 minutes
- 5210 to 14 minutes
- 13115 to 19 minutes
- 11620 to 24 minutes
- 2225 to 29 minutes
- 9530 to 34 minutes
- 1635 to 39 minutes
- 2040 to 44 minutes
- 12345 to 59 minutes
- 4960 to 89 minutes
- 1290 or more minutes

Means of transportation to work
![Means of transportation to work]()
- 72.9%474Drove a car alone
- 19.8%129Carpooled
- 1.5%10Bus
- 1.1%7Subway or elevated rail
- 0.5%3Light rail, streetcar or trolley
- 0.2%1Taxi
- 2.8%18Walked
- 1.1%7Other means
- 9.8%64Worked at home

Time leaving home to go to work
![Time leaving home to go to work]()
- 2712:00 a.m. to 4:59 a.m.
- 105:00 a.m. to 5:29 a.m.
- 595:30 a.m. to 5:59 a.m.
- 606:00 a.m. to 6:29 a.m.
- 256:30 a.m. to 6:59 a.m.
- 967:00 a.m. to 7:29 a.m.
- 667:30 a.m. to 7:59 a.m.
- 358:00 a.m. to 8:29 a.m.
- 308:30 a.m. to 8:59 a.m.
- 419:00 a.m. to 9:59 a.m.
- 2310:00 a.m. to 10:59 a.m.
- 711:00 a.m. to 11:59 a.m.
- 4612:00 p.m. to 3:59 p.m.
- 874:00 p.m. to 11:59 p.m.

Occupations of males:
- Percentage of males in management occupations (except farmers):
Here: 13.8% city: 13.0%
- Percentage of males in business and financial operations occupations:
Here: 1.5% city: 4.6%
- Percentage of males in computer and mathematical occupations:
Here: 8.2% city: 13.6%
- Percentage of males in architecture and engineering occupations:
Here: 6.4% city: 10.2%
- Percentage of males in community and social services occupations:
Here: 2.3% city: 0.8%
- Percentage of males in education, training, and library occupations:
Here: 6.7% city: 2.8%
- Percentage of males in arts, design, entertainment, sports, and media occupations:
Here: 2.5% city: 1.8%
- Percentage of males in healthcare practitioners and technical occupations:
Here: 2.6% city: 2.0%
- Percentage of males in service occupations:
Here: 10.9% city: 12.7%
- Percentage of males in sales and office occupations:
Here: 28.7% city: 12.8%
- Percentage of males in production occupations:
Here: 4.4% city: 5.5%
- Percentage of males in transportation occupations:
Here: 2.7% city: 3.6%
- Percentage of males in material moving occupations:
Here: 2.0% city: 3.1%
Occupations of females:
- Percentage of females in management occupations (except farmers):
Here: 10.1% city: 11.0%
- Percentage of females in computer and mathematical occupations:
Here: 1.7% city: 5.4%
- Percentage of females in life, physical, and social science occupations:
Here: 2.7% city: 1.7%
- Percentage of females in legal occupations:
Here: 3.3% city: 1.3%
- Percentage of females in education, training, and library occupations:
Here: 5.2% city: 8.1%
- Percentage of females in healthcare practitioners and technical occupations:
Here: 4.6% city: 6.8%
- Percentage of females in service occupations:
Here: 25.4% city: 21.7%
- Percentage of females in sales and office occupations:
Here: 21.4% city: 22.0%
- Percentage of females in production occupations:
Here: 25.5% city: 4.0%
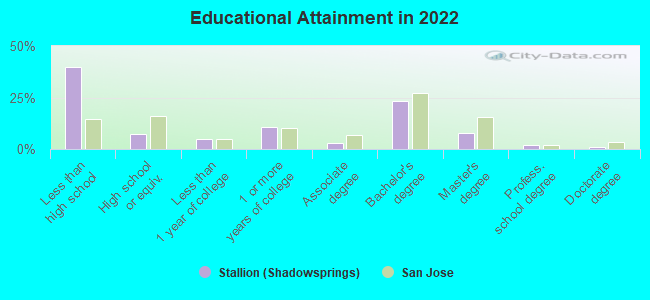
Education in this neighborhood (subdivision or community):
- Percentage of people 3 years and older in K-12 schools:
Stallion (Shadowsprings): 19.8% San Jose: 16.1%
- Percentage of people 3 years and older in undergraduate colleges:
Stallion (Shadowsprings): 5.9% San Jose: 6.5%
- Percentage of people 3 years and older in grad. or professional schools:
Stallion (Shadowsprings): 5.5% San Jose: 2.0%
- Percentage of students K-12 enrolled in private schools:
Stallion (Shadowsprings): 20.2% San Jose: 14.9%
Percentage of population below poverty level:
| Stallion (Shadowsprings): | 12.4% |
| San Jose: | 9.0% |
Median year owner moved in (as recorded in 2022):
Median year renter moved in (as recorded in 2022):
| Stallion (Shadowsprings): | 2007 |
| San Jose: | 2008 |
Median year renter moved in (as recorded in 2022):
| Stallion (Shadowsprings): | 2014 |
| San Jose: | 2020 |
Percentage of married-couple families with both working:
| Stallion (Shadowsprings): | 73.1% |
| San Jose: | 72.5% |
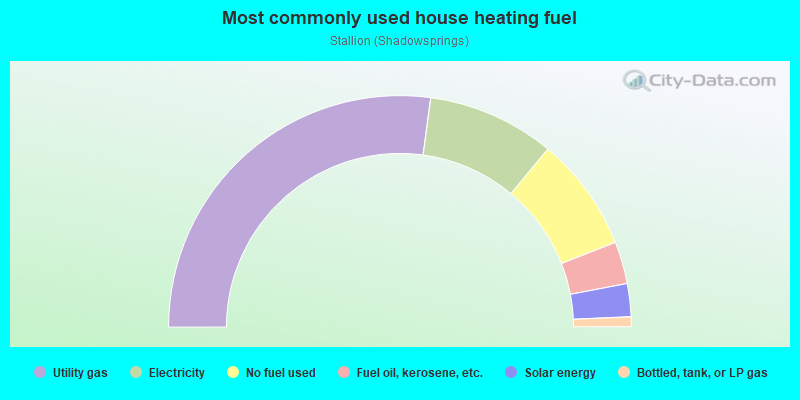
- 54.2%Utility gas
- 17.8%Electricity
- 16.0%No fuel used
- 5.9%Fuel oil, kerosene, etc.
- 4.6%Solar energy
- 1.4%Bottled, tank, or LP gas
Limited-access highways (interstate or state) in this neighborhood:
E Capitol Expy
Length: 0.05 miles
Direction: SW-NE
Direction: SW-NE
Roads and streets:
Shadow Springs Pl
Length: 0.43 miles
Directions: E-W, N-S, SE-NW, SW-NE
Address range: 3000 to 3298
Directions: E-W, N-S, SE-NW, SW-NE
Address range: 3000 to 3298
Shadow Park Pl
Length: 0.39 miles
Directions: E-W, N-S, SE-NW, SW-NE
Address range: 3200 to 3399
Directions: E-W, N-S, SE-NW, SW-NE
Address range: 3200 to 3399
Barberry Ln
Length: 0.32 miles
Directions: E-W, SW-NE
Address range: 1500 to 1699
Directions: E-W, SW-NE
Address range: 1500 to 1699
Stallion Way
Length: 0.28 miles
Direction: SE-NW
Address range: 2800 to 2980
Direction: SE-NW
Address range: 2800 to 2980
Orangewood Dr
Length: 0.21 miles
Directions: E-W, N-S, SE-NW, SW-NE
Address range: 1500 to 1599
Directions: E-W, N-S, SE-NW, SW-NE
Address range: 1500 to 1599
Staghorn Ln
Length: 0.17 miles
Direction: SW-NE
Address range: 1500 to 1699
Direction: SW-NE
Address range: 1500 to 1699
Abigail Ln
Length: 0.14 miles
Directions: N-S, SE-NW, SW-NE
Directions: N-S, SE-NW, SW-NE
Stanhope Dr
Length: 0.14 miles
Direction: SE-NW
Address range: 2800 to 2999
Direction: SE-NW
Address range: 2800 to 2999
S King Rd
Length: 0.14 miles
Direction: SE-NW
Address range: 2842 to 2883
Direction: SE-NW
Address range: 2842 to 2883
Barberry Ct
Length: 0.11 miles
Direction: SW-NE
Address range: 1500 to 1608
Direction: SW-NE
Address range: 1500 to 1608
Redfield Ct
Length: 0.11 miles
Direction: SW-NE
Address range: 1500 to 1567
Direction: SW-NE
Address range: 1500 to 1567
Citrus Grove Ct
Length: 0.11 miles
Direction: SW-NE
Address range: 1500 to 1599
Direction: SW-NE
Address range: 1500 to 1599
Amberly Ln
Length: 0.09 miles
Direction: SW-NE
Direction: SW-NE
Aborn Rd
Length: 0.05 miles
Direction: SW-NE
Direction: SW-NE
Stanhope Ct
Length: 0.05 miles
Direction: SW-NE
Address range: 1500 to 1599
Direction: SW-NE
Address range: 1500 to 1599
Staghorn Ct
Length: 0.04 miles
Direction: SW-NE
Address range: 1600 to 1699
Direction: SW-NE
Address range: 1600 to 1699
Longacre Ct
Length: 0.03 miles
Direction: SE-NW
Address range: 2800 to 2899
Direction: SE-NW
Address range: 2800 to 2899
Barrow Ct
Length: 0.03 miles
Direction: SE-NW
Address range: 2800 to 2899
Direction: SE-NW
Address range: 2800 to 2899
Armstead Ct
Length: 0.02 miles
Direction: SE-NW
Address range: 2800 to 2899
Direction: SE-NW
Address range: 2800 to 2899
Towers Ln
Length: 0.02 miles
Direction: SE-NW
Address range: 2900 to 2913
Direction: SE-NW
Address range: 2900 to 2913