Standing Rock neighborhood in Kent, Ohio (OH), 44240 detailed profile
Settings
X


Business Search - 14 Million verified businesses
Area: 0.234 square miles
Population: 654
Population density:
| Standing Rock: | 2,795 people per square mile |
| Kent: | 3,147 people per square mile |

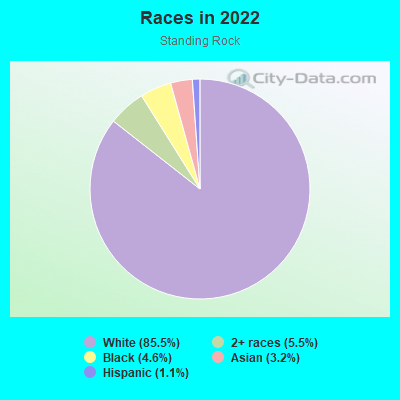
- 60885.5%White
- 395.5%Two or more races
- 334.6%Black
- 233.2%Asian
- 81.1%Hispanic or Latino

Median household income in 2022:
| Standing Rock: | $83,512 |
| Kent: | $37,505 |
Distribution of median household income
![Distribution of median household income]()
- 38Less than $10,000
- 31$10,000 to $19,999
- 54$20,000 to $29,999
- 23$30,000 to $39,999
- 13$40,000 to $49,999
- 8$50,000 to $59,999
- 12$60,000 to $74,999
- 18$75,000 to $99,999
- 35$100,000 to $124,999
- 63$125,000 to $149,999
- 23$150,000 to $199,999
- 26$200,000 or more

Distribution of owner-occupied house/condo value
![Distribution of owner-occupied house/condo value]()
- 68Less than $50,000
- 11$50,000 to $99,999
- 48$100,000 to $149,999
- 23$150,000 to $199,999
- 46$200,000 to $249,999
- 9$250,000 to $299,999
- 77$300,000 to $399,999
- 4$400,000 to $499,999
- 5$500,000 to $749,999
- 5$750,000 to $999,999
- 4$1,000,000 or more

Distribution of rent paid by renters
![Distribution of rent paid by renters]()
- 2$100 to $199
- 9$200 to $299
- 14$400 to $499
- 22$500 to $599
- 30$600 to $699
- 59$700 to $799
- 7$800 to $899
- 12$900 to $999
- 4$1,000 to $1,249
- 19$1,250 to $1,499
- 6$1,500 to $1,999
- 4$2,000 or more

Median rent in 2022:
| Standing Rock: | $647 |
| Kent: | $785 |
| Males: | 270 |
| Females: | 383 |
Males:
| This neighborhood: | 40.9 years |
| Whole city: | 24.2 years |
| This neighborhood: | 36.4 years |
| Whole city: | 23.5 years |
Average household size:
| Standing Rock: | 10.2 people |
| Kent: | 2.1 people |
Percentage of family households:
| Standing Rock: | 43.5% |
| Kent: | 34.9% |
| Here: | 38.9% |
| Kent: | 29.4% |
Percentage of married-couple families with children (among all households):
| Standing Rock: | 37.7% |
| Kent: | 24.7% |
Percentage of single-mother households (among all households):
| Standing Rock: | 5.7% |
| Kent: | 11.9% |
Percentage of never married males 15 years old and over:
Percentage of never married females 15 years old and over:
| Standing Rock: | 11.7% |
| Kent: | 29.2% |
Percentage of never married females 15 years old and over:
| Standing Rock: | 17.0% |
| city: | 31.7% |
Percentage of people that speak English not well or not at all:
| Standing Rock: | 0.2% |
| Kent: | 0.5% |
Percentage of people born in this state:
Percentage of people born in another U.S. state:
Percentage of native residents but born outside the U.S.:
Percentage of foreign born residents:
| Here: | 78.0% |
| Kent: | 71.7% |
Percentage of people born in another U.S. state:
| Standing Rock: | 17.5% |
| Kent: | 22.1% |
Percentage of native residents but born outside the U.S.:
| Here: | 1.2% |
| city: | 0.9% |
Percentage of foreign born residents:
| Here: | 3.2% |
| Kent: | 5.3% |
Owner-occupied
Renter-occupied

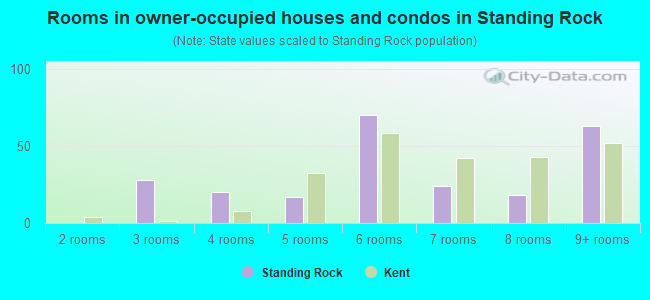
- Rooms in owner-occupied houses and condos in Standing Rock
- 01 room
- 02 rooms
- 283 rooms
- 204 rooms
- 175 rooms
- 706 rooms
- 247 rooms
- 188 rooms
- 639+ rooms
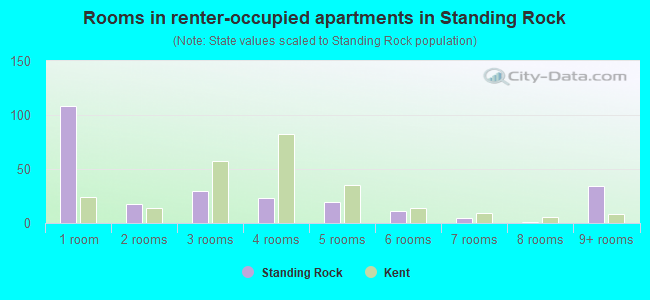
- Rooms in renter-occupied apartments in Standing Rock
- 1081 room
- 182 rooms
- 303 rooms
- 234 rooms
- 195 rooms
- 116 rooms
- 57 rooms
- 18 rooms
- 349+ rooms
Owner-occupied
Renter-occupied
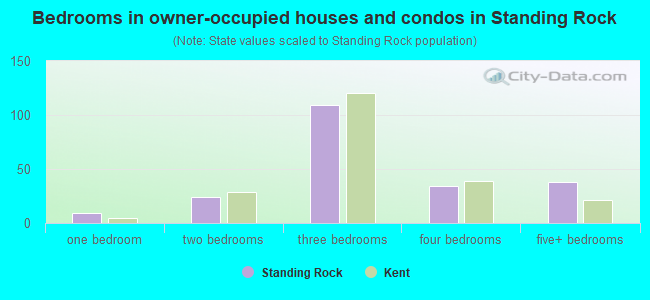
- Bedrooms in owner-occupied houses and condos in Standing Rock
- 0no bedroom
- 91 bedroom
- 242 bedrooms
- 1093 bedrooms
- 344 bedrooms
- 385+ bedrooms
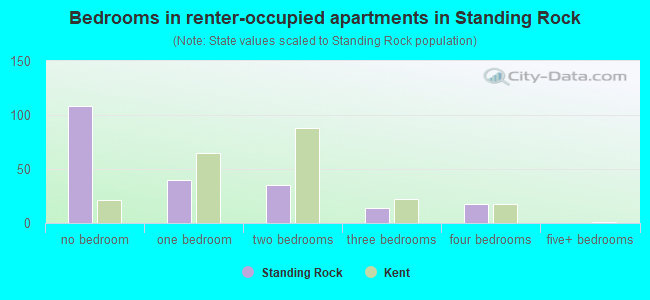
- Bedrooms in renter-occupied apartments in Standing Rock
- 108no bedroom
- 401 bedroom
- 352 bedrooms
- 143 bedrooms
- 184 bedrooms
- 05+ bedrooms
Average number of cars or other vehicles available in houses/condos:
Average number of cars or other vehicles available in apartments:
| This neighborhood: | 1.7 |
| Kent: | 1.9 |
Average number of cars or other vehicles available in apartments:
| Here: | 1.0 |
| city: | 1.2 |
Percentage of units with a mortgage:
| Standing Rock: | 65.0% |
| Kent: | 57.8% |
Housing prices:
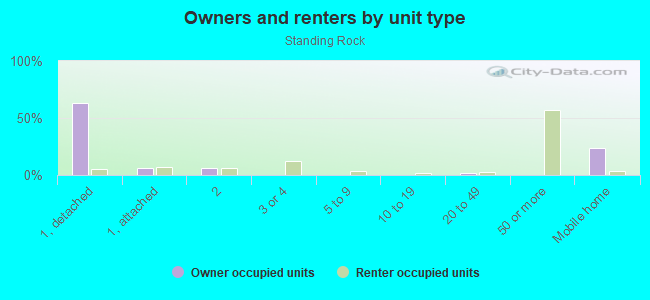
- Average estimated value of detached houses in 2022 (57.6% of all units):
Standing Rock: $279,427 Ohio: $254,366
- Average estimated value of townhouses or other attached units in 2022 (10.8% of all units):
This neighborhood: $273,245 Ohio: $225,733
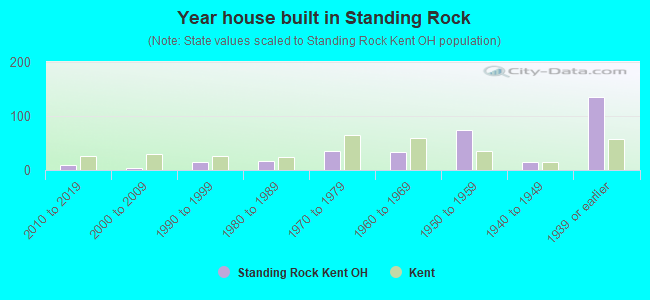
- Year house built in Standing Rock
- 02020 or later
- 102010 to 2019
- 32000 to 2009
- 141990 to 1999
- 161980 to 1989
- 361970 to 1979
- 341960 to 1969
- 751950 to 1959
- 151940 to 1949
- 1351939 or earlier
City-data.com crime index for city in 2020 (higher means more crime):
| City: | 90.7 |
| U.S. average: | 219.5 |
Travel time to work (commute)
![Travel time to work (commute)]()
- 4Less than 5 minutes
- 285 to 9 minutes
- 1710 to 14 minutes
- 2015 to 19 minutes
- 2720 to 24 minutes
- 1925 to 29 minutes
- 1730 to 34 minutes
- 735 to 39 minutes
- 440 to 44 minutes
- 745 to 59 minutes
- 260 to 89 minutes
- 290 or more minutes

Means of transportation to work
![Means of transportation to work]()
- 62.7%187Drove a car alone
- 27.1%81Carpooled
- 2.0%6Bus
- 4.7%14Walked
- 3.0%9Other means
- 29.5%88Worked at home

Time leaving home to go to work
![Time leaving home to go to work]()
- 912:00 a.m. to 4:59 a.m.
- 15:00 a.m. to 5:29 a.m.
- 25:30 a.m. to 5:59 a.m.
- 136:00 a.m. to 6:29 a.m.
- 136:30 a.m. to 6:59 a.m.
- 267:00 a.m. to 7:29 a.m.
- 187:30 a.m. to 7:59 a.m.
- 168:00 a.m. to 8:29 a.m.
- 78:30 a.m. to 8:59 a.m.
- 119:00 a.m. to 9:59 a.m.
- 610:00 a.m. to 10:59 a.m.
- 611:00 a.m. to 11:59 a.m.
- 2112:00 p.m. to 3:59 p.m.
- 54:00 p.m. to 11:59 p.m.

Occupations of males:
- Percentage of males in management occupations (except farmers):
Here: 7.1% city: 6.3%
- Percentage of males in business and financial operations occupations:
Here: 3.3% city: 5.2%
- Percentage of males in computer and mathematical occupations:
Here: 3.8% city: 9.7%
- Percentage of males in architecture and engineering occupations:
Here: 6.8% city: 3.3%
- Percentage of males in life, physical, and social science occupations:
Here: 3.1% city: 1.8%
- Percentage of males in legal occupations:
Here: 5.8% city: 0.5%
- Percentage of males in education, training, and library occupations:
Here: 7.4% city: 5.4%
- Percentage of males in arts, design, entertainment, sports, and media occupations:
Here: 10.7% city: 1.7%
- Percentage of males in healthcare practitioners and technical occupations:
Here: 5.3% city: 3.7%
- Percentage of males in service occupations:
Here: 7.8% city: 24.2%
- Percentage of males in sales and office occupations:
Here: 14.3% city: 12.2%
- Percentage of males in construction, extraction, and maintenance occupations:
Here: 4.6% city: 2.4%
- Percentage of males in production occupations:
Here: 8.9% city: 5.0%
- Percentage of males in material moving occupations:
Here: 6.9% city: 4.7%
Occupations of females:
- Percentage of females in management occupations (except farmers):
Here: 4.3% city: 7.1%
- Percentage of females in business and financial operations occupations:
Here: 6.2% city: 4.1%
- Percentage of females in community and social services occupations:
Here: 30.2% city: 4.6%
- Percentage of females in legal occupations:
Here: 1.9% city: 0.2%
- Percentage of females in education, training, and library occupations:
Here: 20.8% city: 16.2%
- Percentage of females in arts, design, entertainment, sports, and media occupations:
Here: 3.8% city: 1.2%
- Percentage of females in healthcare practitioners and technical occupations:
Here: 2.4% city: 3.2%
- Percentage of females in service occupations:
Here: 13.6% city: 29.0%
- Percentage of females in sales and office occupations:
Here: 15.4% city: 24.3%
- Percentage of females in production occupations:
Here: 1.3% city: 3.1%
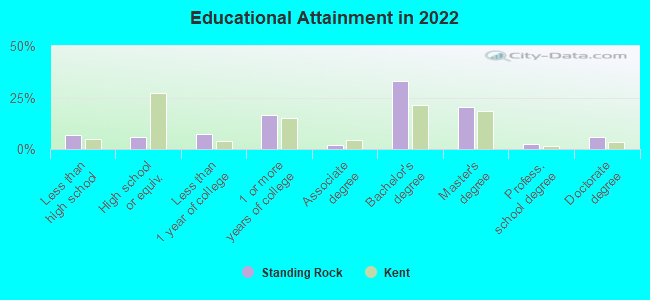
Education in this neighborhood (subdivision or community):
- Percentage of people 3 years and older in K-12 schools:
Standing Rock: 20.9% Kent: 10.8%
- Percentage of people 3 years and older in undergraduate colleges:
Standing Rock: 10.8% Kent: 33.0%
- Percentage of people 3 years and older in grad. or professional schools:
Standing Rock: 8.2% Kent: 3.5%
- Percentage of students K-12 enrolled in private schools:
Standing Rock: 9.2% Kent: 10.0%
Percentage of population below poverty level:
| Standing Rock: | 12.8% |
| Kent: | 25.5% |
Median year owner moved in (as recorded in 2022):
| Standing Rock: | 2005 |
| Kent: | 2006 |
Percentage of married-couple families with both working:
| Standing Rock: | 99.7% |
| Kent: | 80.4% |
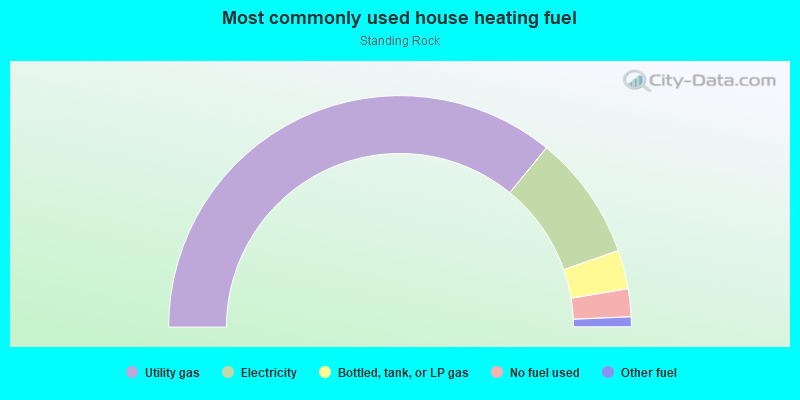
- 71.9%Utility gas
- 17.5%Electricity
- 5.4%Bottled, tank, or LP gas
- 3.9%No fuel used
- 1.4%Other fuel
Roads and streets:
River Bend Blvd
Length: 0.43 miles
Direction: E-W
Address range: 457 to 498
Direction: E-W
Address range: 457 to 498
River Edge Dr
Length: 0.28 miles
Directions: E-W, N-S, SE-NW, SW-NE
Address range: 1400 to 1599
Directions: E-W, N-S, SE-NW, SW-NE
Address range: 1400 to 1599
River Trail Dr (River Trl)
Length: 0.21 miles
Directions: N-S, SW-NE
Address range: 1400 to 1499
Directions: N-S, SW-NE
Address range: 1400 to 1499
Standing Rock Dr
Length: 0.18 miles
Direction: E-W
Address range: 200 to 313
Direction: E-W
Address range: 200 to 313
River Park Dr
Length: 0.10 miles
Directions: N-S, SW-NE
Address range: 1400 to 1499
Directions: N-S, SW-NE
Address range: 1400 to 1499