Trails neighborhood in Garland, Texas (TX), 75043, 75150 detailed profile
Settings
X


Business Search - 14 Million verified businesses
Area: 0.108 square miles
Population: 189
Population density:
| Trails: | 1,746 people per square mile |
| Garland: | 4,214 people per square mile |

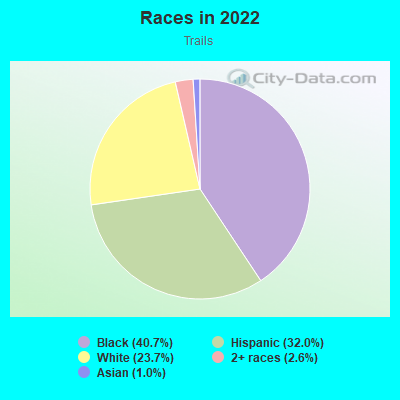
- 7940.7%Black
- 6232.0%Hispanic or Latino
- 4623.7%White
- 52.6%Two or more races
- 21.0%Asian
Median household income in 2022:
| Trails: | $62,957 |
| Garland: | $71,191 |
Distribution of median household income
![Distribution of median household income]()
- 5Less than $10,000
- 6$10,000 to $19,999
- 40$20,000 to $29,999
- 12$30,000 to $39,999
- 19$40,000 to $49,999
- 13$50,000 to $59,999
- 8$60,000 to $74,999
- 4$75,000 to $99,999
- 14$100,000 to $124,999
- 6$125,000 to $149,999
- 4$150,000 to $199,999
- 2$200,000 or more

Distribution of owner-occupied house/condo value
![Distribution of owner-occupied house/condo value]()
- 5Less than $50,000
- 2$50,000 to $99,999
- 4$100,000 to $149,999
- 12$150,000 to $199,999
- 6$200,000 to $249,999
- 7$250,000 to $299,999
- 4$300,000 to $399,999
- 1$400,000 to $499,999

Distribution of rent paid by renters
![Distribution of rent paid by renters]()
- 5$200 to $299
- 2$300 to $399
- 1$400 to $499
- 2$500 to $599
- 1$700 to $799
- 5$800 to $899
- 22$900 to $999
- 57$1,000 to $1,249
- 13$1,250 to $1,499
- 2$1,500 to $1,999
- 4$2,000 or more

Median rent in 2022:
| Trails: | $1,307 |
| Garland: | $1,257 |
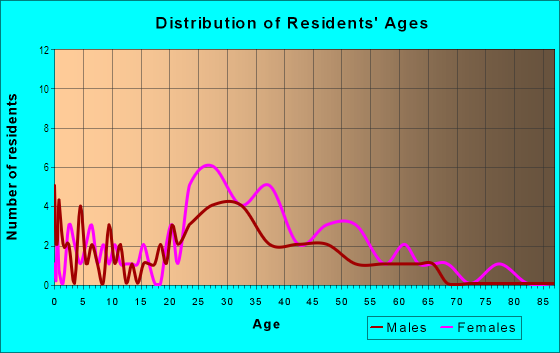
| Males: | 99 |
| Females: | 90 |
Males:
| This neighborhood: | 38.7 years |
| Whole city: | 33.8 years |
| This neighborhood: | 55.3 years |
| Whole city: | 35.1 years |
Average household size:
| Trails: | 2.5 people |
| Garland: | 2.9 people |
Percentage of family households:
| Trails: | 33.7% |
| Garland: | 56.1% |
| Here: | 20.7% |
| Garland: | 49.3% |
Percentage of married-couple families with children (among all households):
| Trails: | 18.8% |
| Garland: | 23.5% |
Percentage of single-mother households (among all households):
| Trails: | 59.4% |
| Garland: | 7.8% |
Percentage of never married males 15 years old and over:
Percentage of never married females 15 years old and over:
| Trails: | 29.2% |
| Garland: | 19.1% |
Percentage of never married females 15 years old and over:
| Trails: | 13.1% |
| city: | 15.9% |
Percentage of people that speak English not well or not at all:
| Trails: | 3.2% |
| Garland: | 9.6% |
Percentage of people born in this state:
Percentage of people born in another U.S. state:
Percentage of native residents but born outside the U.S.:
Percentage of foreign born residents:
| Here: | 55.1% |
| Garland: | 50.2% |
Percentage of people born in another U.S. state:
| Trails: | 34.1% |
| Garland: | 18.8% |
Percentage of native residents but born outside the U.S.:
| Here: | 2.1% |
| city: | 0.8% |
Percentage of foreign born residents:
| Here: | 8.7% |
| Garland: | 30.2% |
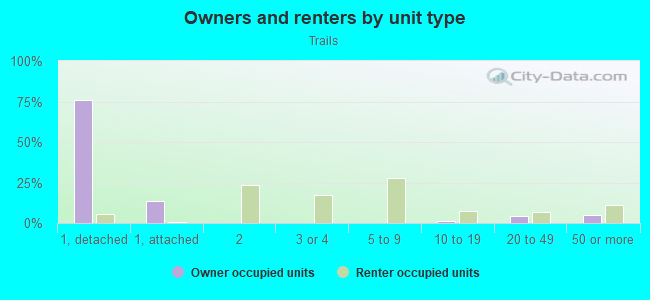
Owner-occupied
Renter-occupied

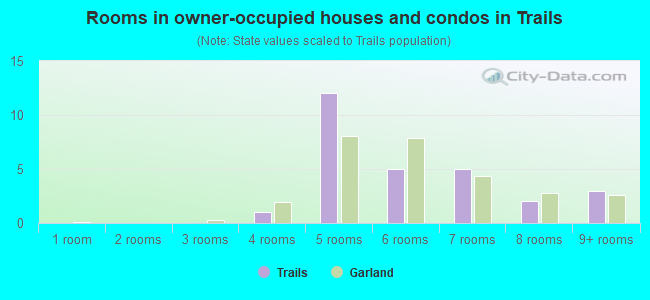
- Rooms in owner-occupied houses and condos in Trails
- 01 room
- 02 rooms
- 03 rooms
- 14 rooms
- 125 rooms
- 56 rooms
- 57 rooms
- 28 rooms
- 39+ rooms
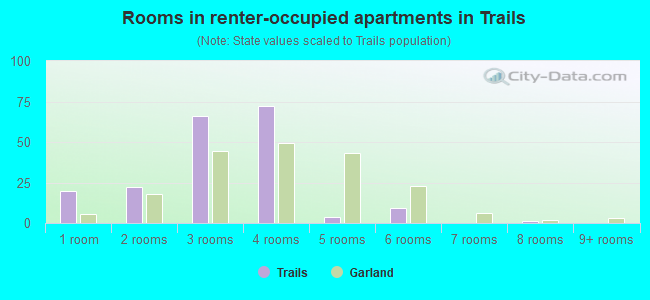
- Rooms in renter-occupied apartments in Trails
- 201 room
- 222 rooms
- 663 rooms
- 724 rooms
- 45 rooms
- 96 rooms
- 07 rooms
- 18 rooms
- 09+ rooms
Owner-occupied
Renter-occupied
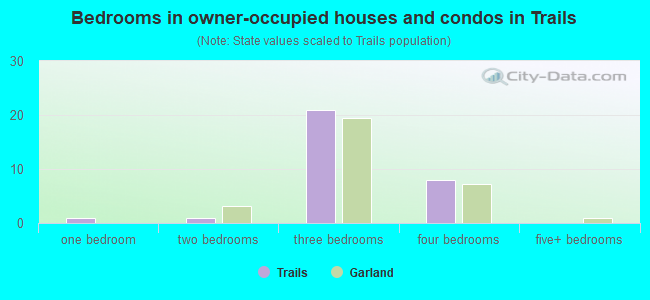
- Bedrooms in owner-occupied houses and condos in Trails
- 0no bedroom
- 11 bedroom
- 12 bedrooms
- 213 bedrooms
- 84 bedrooms
- 05+ bedrooms
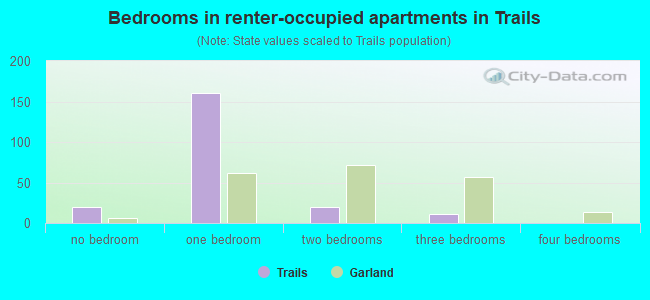
- Bedrooms in renter-occupied apartments in Trails
- 20no bedroom
- 1611 bedroom
- 202 bedrooms
- 113 bedrooms
- 04 bedrooms
- 05+ bedrooms
Average number of cars or other vehicles available in houses/condos:
Average number of cars or other vehicles available in apartments:
| This neighborhood: | 1.6 |
| Garland: | 2.2 |
Average number of cars or other vehicles available in apartments:
| Here: | 1.1 |
| city: | 1.6 |
Percentage of units with a mortgage:
| Trails: | 76.3% |
| Garland: | 59.5% |
Average estimated value of detached houses in 2022 (30.2% of all units):
| Trails: | $205,127 |
| Garland: | $265,641 |
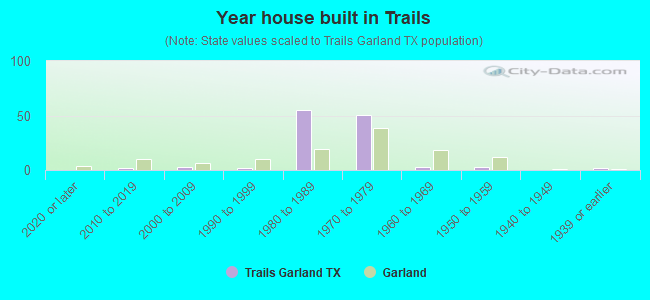
- Year house built in Trails
- 02020 or later
- 22010 to 2019
- 32000 to 2009
- 21990 to 1999
- 551980 to 1989
- 501970 to 1979
- 31960 to 1969
- 31950 to 1959
- 01940 to 1949
- 21939 or earlier
City-data.com crime index for city in 2020 (higher means more crime):
| City: | 222.1 |
| U.S. average: | 219.5 |
Travel time to work (commute)
![Travel time to work (commute)]()
- 55 to 9 minutes
- 410 to 14 minutes
- 1315 to 19 minutes
- 1420 to 24 minutes
- 625 to 29 minutes
- 3630 to 34 minutes
- 435 to 39 minutes
- 840 to 44 minutes
- 845 to 59 minutes
- 760 to 89 minutes
- 390 or more minutes

Means of transportation to work
![Means of transportation to work]()
- 71.9%93Drove a car alone
- 15.5%20Carpooled
- 13.9%18Other means
- 7.0%9Worked at home

Time leaving home to go to work
![Time leaving home to go to work]()
- 112:00 a.m. to 4:59 a.m.
- 35:00 a.m. to 5:29 a.m.
- 55:30 a.m. to 5:59 a.m.
- 126:00 a.m. to 6:29 a.m.
- 86:30 a.m. to 6:59 a.m.
- 197:00 a.m. to 7:29 a.m.
- 237:30 a.m. to 7:59 a.m.
- 148:00 a.m. to 8:29 a.m.
- 48:30 a.m. to 8:59 a.m.
- 79:00 a.m. to 9:59 a.m.
- 110:00 a.m. to 10:59 a.m.
- 411:00 a.m. to 11:59 a.m.
- 512:00 p.m. to 3:59 p.m.
- 74:00 p.m. to 11:59 p.m.

Occupations of males:
- Percentage of males in management occupations (except farmers):
Here: 13.2% city: 7.6%
- Percentage of males in business and financial operations occupations:
Here: 1.0% city: 2.9%
- Percentage of males in computer and mathematical occupations:
Here: 1.5% city: 4.3%
- Percentage of males in architecture and engineering occupations:
Here: 6.5% city: 2.6%
- Percentage of males in education, training, and library occupations:
Here: 4.1% city: 2.1%
- Percentage of males in arts, design, entertainment, sports, and media occupations:
Here: 3.0% city: 1.7%
- Percentage of males in service occupations:
Here: 1.7% city: 14.0%
- Percentage of males in sales and office occupations:
Here: 25.4% city: 15.2%
- Percentage of males in construction, extraction, and maintenance occupations:
Here: 11.9% city: 17.9%
- Percentage of males in transportation occupations:
Here: 12.7% city: 6.5%
Occupations of females:
- Percentage of females in management occupations (except farmers):
Here: 2.1% city: 6.9%
- Percentage of females in business and financial operations occupations:
Here: 5.6% city: 6.2%
- Percentage of females in computer and mathematical occupations:
Here: 1.7% city: 3.2%
- Percentage of females in community and social services occupations:
Here: 5.0% city: 1.4%
- Percentage of females in legal occupations:
Here: 2.4% city: 0.8%
- Percentage of females in education, training, and library occupations:
Here: 5.6% city: 7.8%
- Percentage of females in arts, design, entertainment, sports, and media occupations:
Here: 3.0% city: 1.6%
- Percentage of females in healthcare practitioners and technical occupations:
Here: 5.0% city: 6.3%
- Percentage of females in service occupations:
Here: 20.4% city: 25.4%
- Percentage of females in sales and office occupations:
Here: 50.8% city: 30.7%
- Percentage of females in construction, extraction, and maintenance occupations:
Here: 1.4% city: 0.5%
- Percentage of females in production occupations:
Here: 2.7% city: 4.6%
- Percentage of females in material moving occupations:
Here: 4.7% city: 3.2%
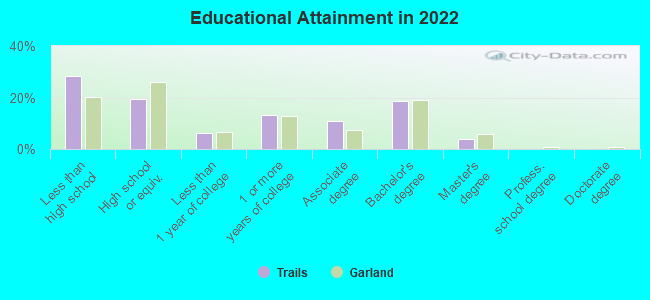
Education in this neighborhood (subdivision or community):
- Percentage of people 3 years and older in K-12 schools:
Trails: 27.1% Garland: 20.3%
- Percentage of people 3 years and older in undergraduate colleges:
Trails: 3.3% Garland: 3.5%
- Percentage of people 3 years and older in grad. or professional schools:
Trails: 3.3% Garland: 1.0%
- Percentage of students K-12 enrolled in private schools:
Trails: 14.3% Garland: 4.8%
Percentage of population below poverty level:
| Trails: | 14.1% |
| Garland: | 12.1% |
Median year owner moved in (as recorded in 2022):
Median year renter moved in (as recorded in 2022):
| Trails: | 2301 |
| Garland: | 2008 |
Median year renter moved in (as recorded in 2022):
| Trails: | 2317 |
| Garland: | 2020 |
Percentage of married-couple families with both working:
| Trails: | 66.2% |
| Garland: | 64.6% |
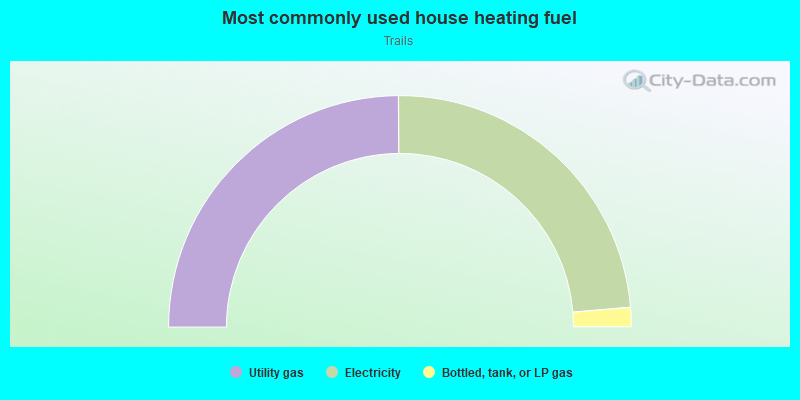
- 49.8%Utility gas
- 47.5%Electricity
- 2.7%Bottled, tank, or LP gas
Roads and streets:
Audubon Park
Length: 0.40 miles
Directions: E-W, N-S, SE-NW, SW-NE
Directions: E-W, N-S, SE-NW, SW-NE
Pebblebeach Dr
Length: 0.24 miles
Directions: E-W, SW-NE
Address range: 700 to 836
Directions: E-W, SW-NE
Address range: 700 to 836
Briarcliff Dr
Length: 0.22 miles
Directions: E-W, N-S, SE-NW, SW-NE
Address range: 500 to 699
Directions: E-W, N-S, SE-NW, SW-NE
Address range: 500 to 699
Trailcrest Dr
Length: 0.17 miles
Directions: E-W, N-S, SE-NW, SW-NE
Address range: 500 to 599
Directions: E-W, N-S, SE-NW, SW-NE
Address range: 500 to 599
Cypress Pt
Length: 0.03 miles
Direction: N-S
Address range: 6120 to 6199
Direction: N-S
Address range: 6120 to 6199
Trails Pkwy
Length: 0.01 miles
Direction: E-W
Direction: E-W