Victoria neighborhood in Loma Linda, California (CA), 92354, 92408 detailed profile
Settings
X

Business Search - 14 Million verified businesses
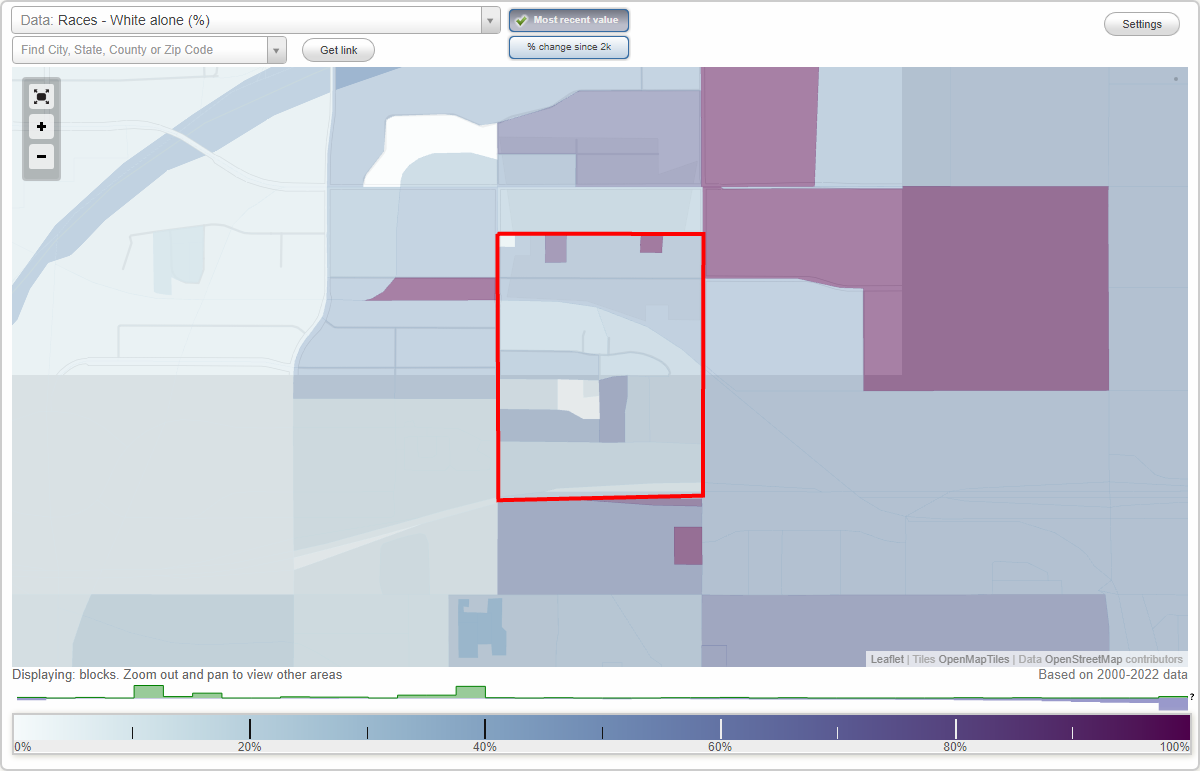
Area: 0.327 square miles
Population: 201
Population density:
| Victoria: | 615 people per square mile |
| Loma Linda: | 3,386 people per square mile |

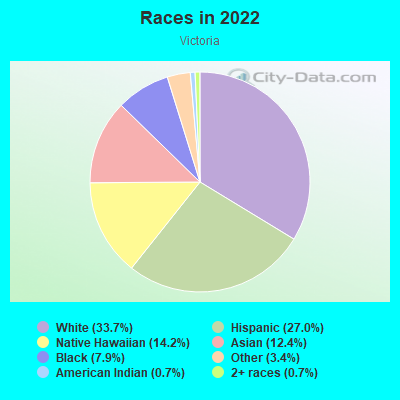
- 9033.7%White
- 7227.0%Hispanic or Latino
- 3814.2%Native Hawaiian and Other
Pacific Islander - 3312.4%Asian
- 217.9%Black
- 93.4%Some other race
- 20.7%American Indian
- 20.7%Two or more races
Median household income in 2022:
| Victoria: | $62,989 |
| Loma Linda: | $70,685 |
Distribution of median household income
![Distribution of median household income]()
- 10Less than $10,000
- 9$10,000 to $19,999
- 47$20,000 to $29,999
- 9$30,000 to $39,999
- 5$40,000 to $49,999
- 16$50,000 to $59,999
- 13$60,000 to $74,999
- 17$75,000 to $99,999
- 14$100,000 to $124,999
- 4$125,000 to $149,999
- 3$150,000 to $199,999
- 40$200,000 or more

Distribution of owner-occupied house/condo value
![Distribution of owner-occupied house/condo value]()
- 3Less than $50,000
- 3$100,000 to $149,999
- 4$250,000 to $299,999
- 18$300,000 to $399,999
- 12$400,000 to $499,999
- 4$500,000 to $749,999
- 16$750,000 to $999,999
- 3$1,000,000 or more

Distribution of rent paid by renters
![Distribution of rent paid by renters]()
- 12$100 to $199
- 3$500 to $599
- 10$1,000 to $1,249
- 4$1,250 to $1,499
- 52$1,500 to $1,999
- 50$2,000 or more

Median rent in 2022:
| Victoria: | $1,770 |
| Loma Linda: | $1,502 |
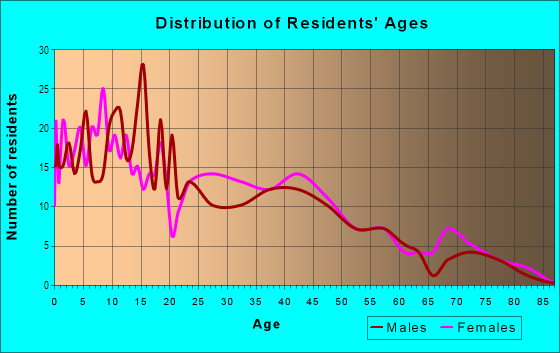
| Males: | 113 |
| Females: | 88 |
Males:
| This neighborhood: | 29.6 years |
| Whole city: | 36.2 years |
| This neighborhood: | 27.6 years |
| Whole city: | 39.1 years |
Average household size:
| Victoria: | 2.3 people |
| Loma Linda: | 2.6 people |
Percentage of family households:
| Victoria: | 40.7% |
| Loma Linda: | 43.5% |
| Here: | 39.5% |
| Loma Linda: | 47.8% |
Percentage of married-couple families with children (among all households):
| Victoria: | 36.4% |
| Loma Linda: | 28.1% |
Percentage of single-mother households (among all households):
| Victoria: | 7.5% |
| Loma Linda: | 7.2% |
Percentage of never married males 15 years old and over:
Percentage of never married females 15 years old and over:
| Victoria: | 30.2% |
| Loma Linda: | 16.5% |
Percentage of never married females 15 years old and over:
| Victoria: | 12.5% |
| city: | 20.8% |
Percentage of people born in this state:
Percentage of people born in another U.S. state:
Percentage of native residents but born outside the U.S.:
Percentage of foreign born residents:
| Here: | 61.8% |
| Loma Linda: | 51.1% |
Percentage of people born in another U.S. state:
| Victoria: | 15.8% |
| Loma Linda: | 16.9% |
Percentage of native residents but born outside the U.S.:
| Here: | 0.5% |
| city: | 1.7% |
Percentage of foreign born residents:
| Here: | 21.9% |
| Loma Linda: | 30.3% |
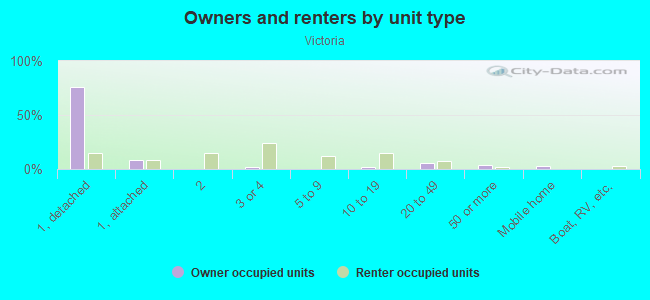
Owner-occupied
Renter-occupied

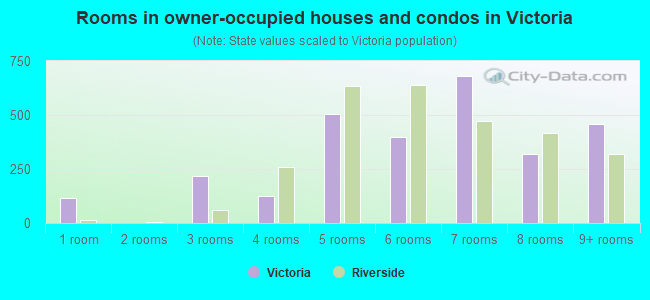
- Rooms in owner-occupied houses and condos in Victoria
- 21 room
- 32 rooms
- 23 rooms
- 84 rooms
- 55 rooms
- 106 rooms
- 137 rooms
- 98 rooms
- 29+ rooms
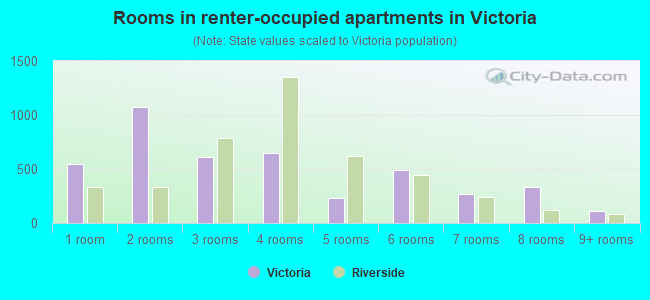
- Rooms in renter-occupied apartments in Victoria
- 21 room
- 182 rooms
- 123 rooms
- 314 rooms
- 235 rooms
- 236 rooms
- 07 rooms
- 08 rooms
- 29+ rooms
Owner-occupied
Renter-occupied
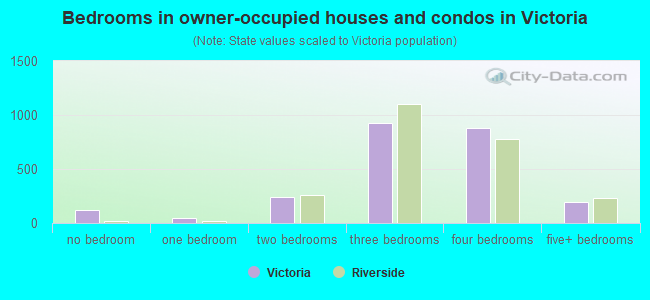
- Bedrooms in owner-occupied houses and condos in Victoria
- 2no bedroom
- 31 bedroom
- 142 bedrooms
- 153 bedrooms
- 44 bedrooms
- 175+ bedrooms
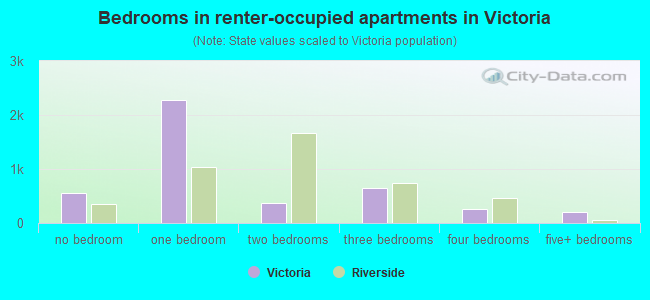
- Bedrooms in renter-occupied apartments in Victoria
- 2no bedroom
- 211 bedroom
- 572 bedrooms
- 73 bedrooms
- 104 bedrooms
- 05+ bedrooms
Average number of cars or other vehicles available in houses/condos:
Average number of cars or other vehicles available in apartments:
| This neighborhood: | |
| Loma Linda: |
Average number of cars or other vehicles available in apartments:
| Here: | 1.5 |
| city: | 1.4 |
Percentage of units with a mortgage:
| Victoria: | 84.5% |
| Loma Linda: | 60.1% |
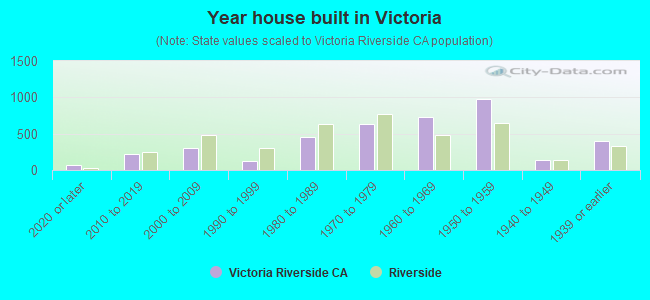
- Year house built in Victoria
- 212020 or later
- 42010 to 2019
- 22000 to 2009
- 161990 to 1999
- 401980 to 1989
- 241970 to 1979
- 131960 to 1969
- 01950 to 1959
- 131940 to 1949
- 21939 or earlier
City-data.com crime index for city in 2020 (higher means more crime):
| City: | 212.8 |
| U.S. average: | 219.5 |
Travel time to work (commute)
![Travel time to work (commute)]()
- 14Less than 5 minutes
- 245 to 9 minutes
- 10310 to 14 minutes
- 5015 to 19 minutes
- 8720 to 24 minutes
- 1225 to 29 minutes
- 6030 to 34 minutes
- 1635 to 39 minutes
- 3240 to 44 minutes
- 1645 to 59 minutes
- 2260 to 89 minutes
- 490 or more minutes

Means of transportation to work
![Means of transportation to work]()
- 68.7%76Drove a car alone
- 8.1%9Carpooled
- 7.2%8Motorcycle
- 10.8%12Walked
- 9.9%11Worked at home

Time leaving home to go to work
![Time leaving home to go to work]()
- 2512:00 a.m. to 4:59 a.m.
- 55:00 a.m. to 5:29 a.m.
- 155:30 a.m. to 5:59 a.m.
- 446:00 a.m. to 6:29 a.m.
- 316:30 a.m. to 6:59 a.m.
- 1237:00 a.m. to 7:29 a.m.
- 177:30 a.m. to 7:59 a.m.
- 338:00 a.m. to 8:29 a.m.
- 188:30 a.m. to 8:59 a.m.
- 409:00 a.m. to 9:59 a.m.
- 1810:00 a.m. to 10:59 a.m.
- 411:00 a.m. to 11:59 a.m.
- 1412:00 p.m. to 3:59 p.m.
- 534:00 p.m. to 11:59 p.m.

Occupations of males:
- Percentage of males in management occupations (except farmers):
Here: 21.7% city: 9.5%
- Percentage of males in business and financial operations occupations:
Here: 6.8% city: 3.0%
- Percentage of males in computer and mathematical occupations:
Here: 10.5% city: 5.4%
- Percentage of males in architecture and engineering occupations:
Here: 11.9% city: 4.9%
- Percentage of males in life, physical, and social science occupations:
Here: 4.1% city: 2.7%
- Percentage of males in community and social services occupations:
Here: 3.3% city: 2.1%
- Percentage of males in education, training, and library occupations:
Here: 3.7% city: 4.3%
- Percentage of males in healthcare practitioners and technical occupations:
Here: 48.4% city: 18.5%
- Percentage of males in service occupations:
Here: 19.0% city: 13.9%
- Percentage of males in sales and office occupations:
Here: 11.0% city: 12.7%
- Percentage of males in construction, extraction, and maintenance occupations:
Here: 14.9% city: 5.2%
- Percentage of males in transportation occupations:
Here: 9.9% city: 5.4%
- Percentage of males in material moving occupations:
Here: 6.4% city: 6.7%
Occupations of females:
- Percentage of females in management occupations (except farmers):
Here: 21.2% city: 3.4%
- Percentage of females in business and financial operations occupations:
Here: 15.1% city: 5.1%
- Percentage of females in architecture and engineering occupations:
Here: 7.6% city: 0.4%
- Percentage of females in life, physical, and social science occupations:
Here: 19.5% city: 1.1%
- Percentage of females in community and social services occupations:
Here: 6.5% city: 3.7%
- Percentage of females in education, training, and library occupations:
Here: 8.2% city: 9.7%
- Percentage of females in arts, design, entertainment, sports, and media occupations:
Here: 5.8% city: 1.4%
- Percentage of females in healthcare practitioners and technical occupations:
Here: 30.6% city: 28.2%
- Percentage of females in service occupations:
Here: 104.7% city: 20.7%
- Percentage of females in sales and office occupations:
Here: 7.3% city: 18.0%
- Percentage of females in production occupations:
Here: 5.4% city: 0.3%
- Percentage of females in transportation occupations:
Here: 11.0% city: 2.2%
- Percentage of females in material moving occupations:
Here: 3.6% city: 3.8%
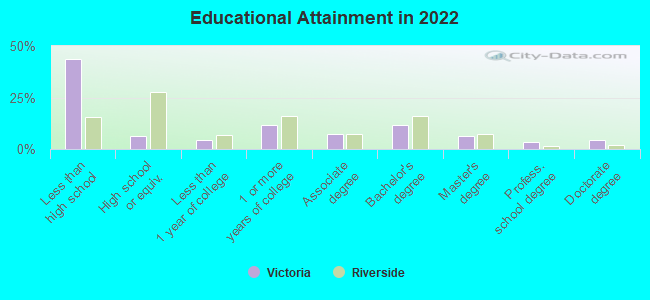
Education in this neighborhood (subdivision or community):
- Percentage of people 3 years and older in K-12 schools:
Victoria: 36.3% Loma Linda: 13.8%
- Percentage of people 3 years and older in undergraduate colleges:
Victoria: 4.5% Loma Linda: 7.1%
- Percentage of people 3 years and older in grad. or professional schools:
Victoria: 23.4% Loma Linda: 6.1%
- Percentage of students K-12 enrolled in private schools:
Victoria: 2.7% Loma Linda: 15.1%
Percentage of population below poverty level:
| Victoria: | 9.7% |
| Loma Linda: | 12.8% |
Median year renter moved in (as recorded in 2022):
| Victoria: | 2004 |
| Loma Linda: | 2016 |
Percentage of married-couple families with both working:
| Victoria: | 84.8% |
| Loma Linda: | 54.1% |
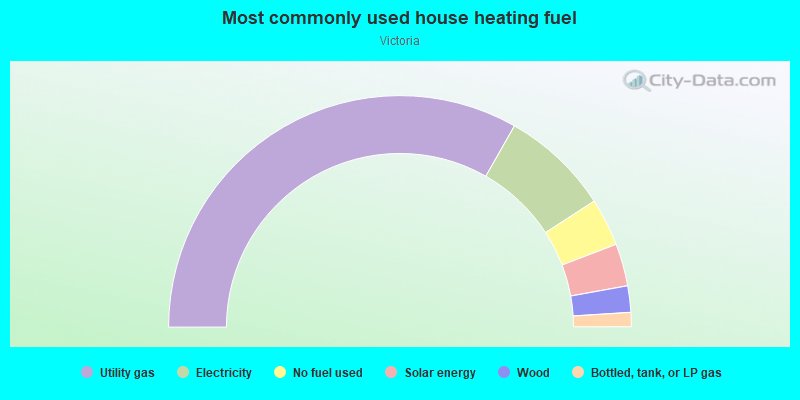
- 62.5%Utility gas
- 19.6%Electricity
- 11.7%Wood
- 3.0%Bottled, tank, or LP gas
- 2.3%Other fuel
- 0.9%Solar energy
Limited-access highways (interstate or state) in this neighborhood:
San Bernardino Fwy (I- 10)
Length: 0.55 miles
Direction: E-W
Direction: E-W
Roads and streets:
Coulston St (E Coulston St)
Length: 0.55 miles
Direction: E-W
Address range: 1650 to 25416
Direction: E-W
Address range: 1650 to 25416
Sterling Ave (Mountain View Ave)
Length: 0.52 miles
Direction: N-S
Address range: 1701 to 10299
Direction: N-S
Address range: 1701 to 10299
Gould St (E Gould St)
Length: 0.33 miles
Directions: E-W, SE-NW
Address range: 1700 to 1999
Directions: E-W, SE-NW
Address range: 1700 to 1999
Hardt St (E Hardt St)
Length: 0.29 miles
Directions: E-W, N-S, SE-NW, SW-NE
Address range: 1800 to 1999
Directions: E-W, N-S, SE-NW, SW-NE
Address range: 1800 to 1999
Curtis St
Length: 0.25 miles
Direction: N-S
Address range: 1500 to 1829
Direction: N-S
Address range: 1500 to 1829
Elm Ave
Length: 0.16 miles
Direction: N-S
Address range: 1600 to 1827
Direction: N-S
Address range: 1600 to 1827
Rosena Ave
Length: 0.16 miles
Direction: N-S
Address range: 1600 to 1899
Direction: N-S
Address range: 1600 to 1899
Davidson St
Length: 0.13 miles
Directions: E-W, SE-NW
Address range: 1701 to 25398
Directions: E-W, SE-NW
Address range: 1701 to 25398
Coloma St (S Coloma St)
Length: 0.08 miles
Direction: N-S
Address range: 1800 to 1899
Direction: N-S
Address range: 1800 to 1899
Shedden Dr (Shedden St)
Length: 0.05 miles
Direction: N-S
Address range: 1500 to 1599
Direction: N-S
Address range: 1500 to 1599
Railroad features:
Burlington Northern Santa Fe Rlwy
Length: 0.35 miles
Directions: E-W, SE-NW
Directions: E-W, SE-NW