West End neighborhood in Ithaca, New York (NY), 14850 detailed profile
Settings
X


Business Search - 14 Million verified businesses
Area: 0.875 square miles
Population: 29
Population density:
| West End: | 33 people per square mile |
| Ithaca: | 5,740 people per square mile |

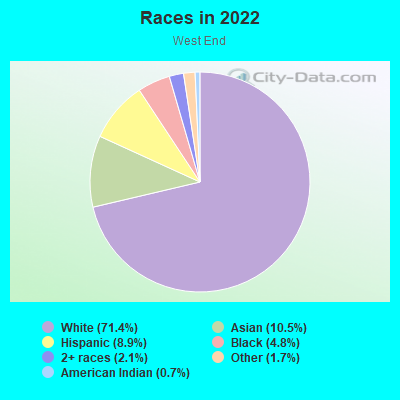
- 2668.4%White
- 718.4%Two or more races
- 25.3%American Indian
- 25.3%Some other race
- 12.6%Asian
Median household income in 2022:
| West End: | $18,388 |
| Ithaca: | $45,468 |
Distribution of median household income
![Distribution of median household income]()
- 2Less than $10,000
- 9$10,000 to $19,999
- 4$20,000 to $29,999
- 2$30,000 to $39,999
- 2$40,000 to $49,999
- 1$50,000 to $59,999
- 2$60,000 to $74,999
- 4$75,000 to $99,999
- 3$100,000 to $124,999
- 3$125,000 to $149,999
- 2$150,000 to $199,999
- 1$200,000 or more

Distribution of owner-occupied house/condo value
![Distribution of owner-occupied house/condo value]()
- 2Less than $50,000
- 1$50,000 to $99,999
- 3$100,000 to $149,999
- 4$150,000 to $199,999
- 3$200,000 to $249,999
- 1$250,000 to $299,999
- 2$300,000 to $399,999
- 2$400,000 to $499,999
- 1$500,000 to $749,999
- 1$750,000 to $999,999
- 1$1,000,000 or more

Distribution of rent paid by renters
![Distribution of rent paid by renters]()
- 1Less than $100
- 2$100 to $199
- 1$200 to $299
- 2$300 to $399
- 1$400 to $499
- 6$500 to $599
- 10$600 to $699
- 18$700 to $799
- 2$800 to $899
- 2$900 to $999
- 2$1,000 to $1,249
- 2$1,250 to $1,499
- 2$1,500 to $1,999
- 2$2,000 or more

Median rent in 2022:
| West End: | $306 |
| Ithaca: | $1,274 |
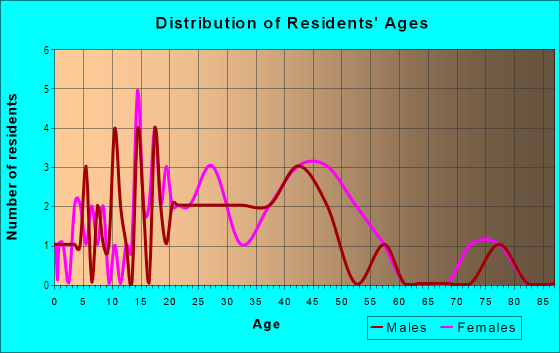
| Males: | 12 |
| Females: | 17 |
Males:
| This neighborhood: | 10.3 years |
| Whole city: | 22.9 years |
| This neighborhood: | 10.6 years |
| Whole city: | 22.7 years |
Average household size:
| West End: | 0.5 people |
| Ithaca: | 1.8 people |
Percentage of family households:
| West End: | 30.5% |
| Ithaca: | 21.1% |
| Here: | 38.6% |
| Ithaca: | 21.1% |
Percentage of married-couple families with children (among all households):
| West End: | 31.0% |
| Ithaca: | 26.0% |
Percentage of single-mother households (among all households):
| West End: | 25.5% |
| Ithaca: | 12.6% |
Percentage of never married males 15 years old and over:
Percentage of never married females 15 years old and over:
| West End: | 15.8% |
| Ithaca: | 37.7% |
Percentage of never married females 15 years old and over:
| West End: | 11.4% |
| city: | 34.4% |
Percentage of people that speak English not well or not at all:
| West End: | 0.0% |
| Ithaca: | 1.0% |
Percentage of people born in this state:
Percentage of people born in another U.S. state:
Percentage of native residents but born outside the U.S.:
Percentage of foreign born residents:
| Here: | 51.5% |
| Ithaca: | 40.5% |
Percentage of people born in another U.S. state:
| West End: | 33.7% |
| Ithaca: | 37.5% |
Percentage of native residents but born outside the U.S.:
| Here: | 1.3% |
| city: | 2.4% |
Percentage of foreign born residents:
| Here: | 13.5% |
| Ithaca: | 19.7% |
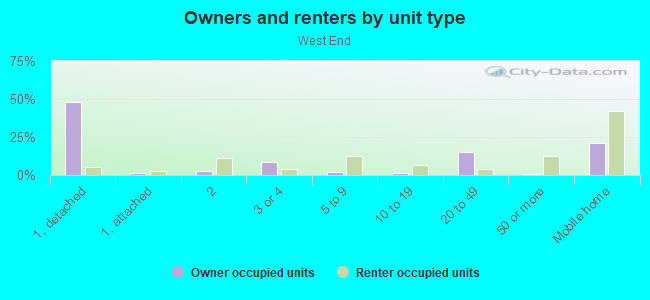
Owner-occupied
Renter-occupied

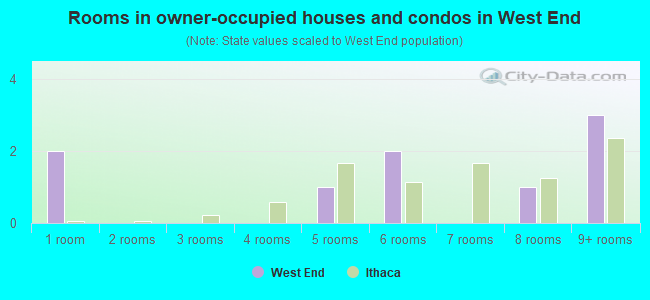
- Rooms in owner-occupied houses and condos in West End
- 21 room
- 02 rooms
- 03 rooms
- 04 rooms
- 15 rooms
- 26 rooms
- 07 rooms
- 18 rooms
- 39+ rooms
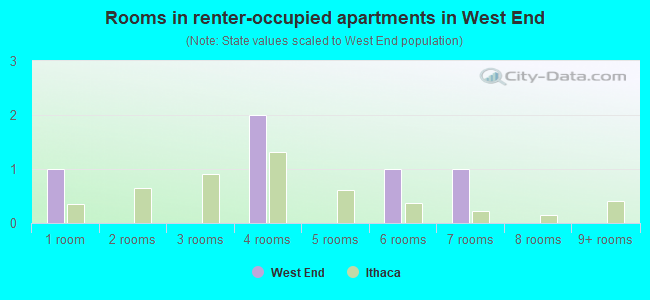
- Rooms in renter-occupied apartments in West End
- 11 room
- 02 rooms
- 03 rooms
- 24 rooms
- 05 rooms
- 16 rooms
- 17 rooms
- 08 rooms
- 09+ rooms
Owner-occupied
Renter-occupied
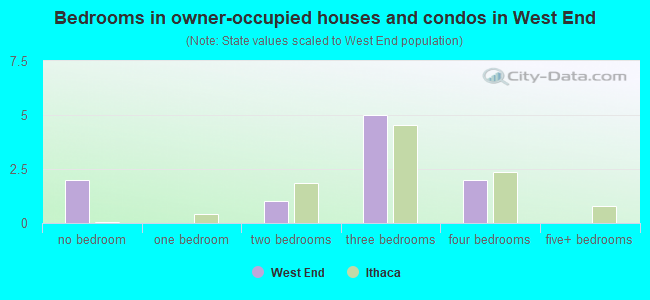
- Bedrooms in owner-occupied houses and condos in West End
- 2no bedroom
- 01 bedroom
- 12 bedrooms
- 53 bedrooms
- 24 bedrooms
- 05+ bedrooms
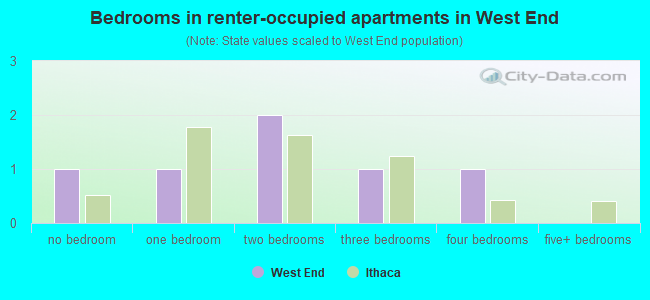
- Bedrooms in renter-occupied apartments in West End
- 1no bedroom
- 11 bedroom
- 22 bedrooms
- 13 bedrooms
- 14 bedrooms
- 05+ bedrooms
Average number of cars or other vehicles available in houses/condos:
Average number of cars or other vehicles available in apartments:
| This neighborhood: | 1.9 |
| Ithaca: | 1.6 |
Average number of cars or other vehicles available in apartments:
| Here: | 1.1 |
| city: | 1.0 |
Percentage of units with a mortgage:
| West End: | 53.3% |
| Ithaca: | 57.6% |
Housing prices:
- Average estimated value of detached houses in 2022 (55.6% of all units):
West End: $2,102,405 Ithaca: $346,289
- Average estimated value of housing units in 2-unit structures in 2022 (16.7% of all units):
This neighborhood: $6,124,114 Ithaca: $300,793
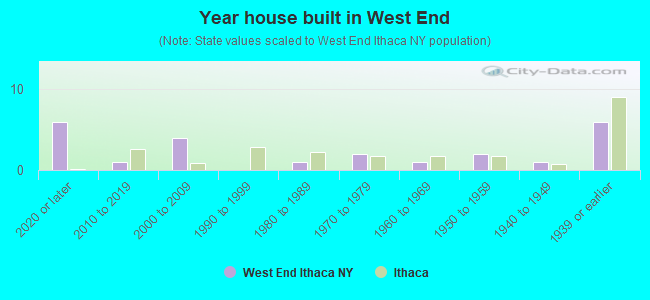
- Year house built in West End
- 62020 or later
- 12010 to 2019
- 42000 to 2009
- 01990 to 1999
- 11980 to 1989
- 21970 to 1979
- 11960 to 1969
- 21950 to 1959
- 11940 to 1949
- 61939 or earlier
City-data.com crime index for city in 2020 (higher means more crime):
| City: | 265.9 |
| U.S. average: | 219.5 |
Travel time to work (commute)
![Travel time to work (commute)]()
- 25 to 9 minutes
- 310 to 14 minutes
- 515 to 19 minutes
- 120 to 24 minutes
- 130 to 34 minutes

Means of transportation to work
![Means of transportation to work]()
- 66.0%10Drove a car alone
- 13.2%2Long-distance train or commuter rail
- 13.2%2Motorcycle
- 13.2%2Bicycle
- 13.2%2Worked at home

Time leaving home to go to work
![Time leaving home to go to work]()
- 16:30 a.m. to 6:59 a.m.
- 27:00 a.m. to 7:29 a.m.
- 17:30 a.m. to 7:59 a.m.
- 58:00 a.m. to 8:29 a.m.
- 18:30 a.m. to 8:59 a.m.
- 19:00 a.m. to 9:59 a.m.
- 112:00 p.m. to 3:59 p.m.

Occupations of males:
- Percentage of males in management occupations (except farmers):
Here: 15.6% city: 6.8%
- Percentage of males in business and financial operations occupations:
Here: 4.3% city: 4.4%
- Percentage of males in computer and mathematical occupations:
Here: 8.3% city: 6.5%
- Percentage of males in architecture and engineering occupations:
Here: 3.6% city: 3.1%
- Percentage of males in legal occupations:
Here: 19.7% city: 2.4%
- Percentage of males in education, training, and library occupations:
Here: 10.6% city: 22.0%
- Percentage of males in arts, design, entertainment, sports, and media occupations:
Here: 7.5% city: 5.6%
- Percentage of males in service occupations:
Here: 19.9% city: 18.1%
- Percentage of males in sales and office occupations:
Here: 4.4% city: 13.8%
- Percentage of males in production occupations:
Here: 4.1% city: 1.1%
Occupations of females:
- Percentage of females in management occupations (except farmers):
Here: 21.4% city: 6.2%
- Percentage of females in business and financial operations occupations:
Here: 8.5% city: 4.5%
- Percentage of females in life, physical, and social science occupations:
Here: 3.0% city: 8.1%
- Percentage of females in community and social services occupations:
Here: 14.1% city: 6.6%
- Percentage of females in legal occupations:
Here: 2.9% city: 0.7%
- Percentage of females in education, training, and library occupations:
Here: 16.9% city: 22.2%
- Percentage of females in arts, design, entertainment, sports, and media occupations:
Here: 4.7% city: 4.7%
- Percentage of females in healthcare practitioners and technical occupations:
Here: 13.2% city: 3.5%
- Percentage of females in service occupations:
Here: 3.7% city: 19.5%
- Percentage of females in sales and office occupations:
Here: 10.2% city: 14.3%
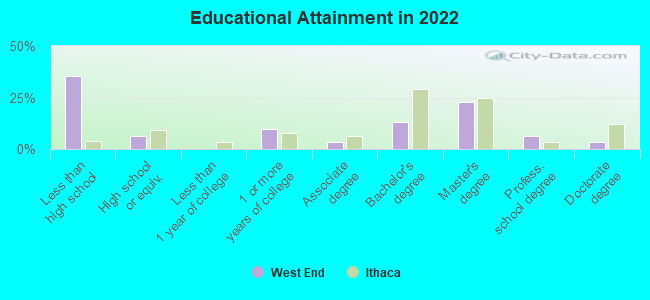
Education in this neighborhood (subdivision or community):
- Percentage of people 3 years and older in K-12 schools:
West End: 82.8% Ithaca: 5.1%
- Percentage of people 3 years and older in undergraduate colleges:
West End: 3.4% Ithaca: 42.7%
- Percentage of people 3 years and older in grad. or professional schools:
West End: 3.4% Ithaca: 12.4%
- Percentage of students K-12 enrolled in private schools:
West End: 29.2% Ithaca: 15.4%
Percentage of population below poverty level:
| West End: | 9.5% |
| Ithaca: | 33.1% |
Median year owner moved in (as recorded in 2022):
Median year renter moved in (as recorded in 2022):
| West End: | 481 |
| Ithaca: | 2007 |
Median year renter moved in (as recorded in 2022):
| West End: | 484 |
| Ithaca: | 2019 |
Percentage of married-couple families with both working:
| West End: | 578.7% |
| Ithaca: | 83.1% |
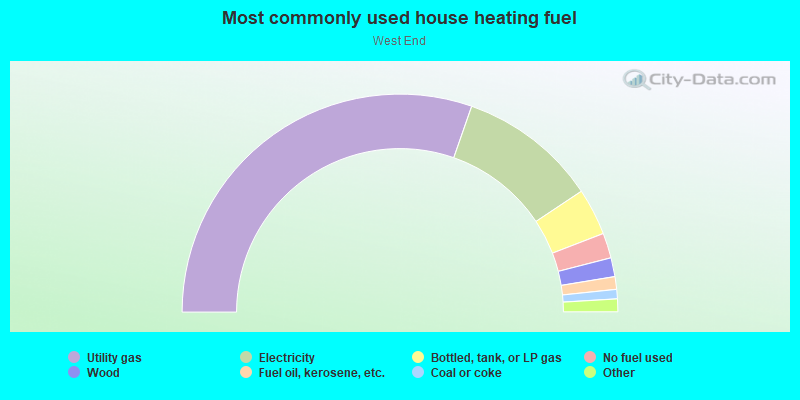
- 60.7%Utility gas
- 20.6%Electricity
- 7.0%Bottled, tank, or LP gas
- 3.7%No fuel used
- 2.8%Wood
- 1.9%Fuel oil, kerosene, etc.
- 1.4%Coal or coke
- 0.9%Solar energy
- 0.9%Other fuel
Highways in this neighborhood:
Park Rd (State Hwy 89)
Length: 1.00 miles
Directions: E-W, N-S, SE-NW, SW-NE
Address range: 700 to 799
Directions: E-W, N-S, SE-NW, SW-NE
Address range: 700 to 799
Cliff St (State Hwy 96)
Length: 0.96 miles
Directions: N-S, SE-NW
Address range: 207 to 999
Directions: N-S, SE-NW
Address range: 207 to 999
Floral Ave (State Hwy 13A)
Length: 0.92 miles
Direction: SW-NE
Address range: 226 to 499
Direction: SW-NE
Address range: 226 to 499
State Hwy 79 (Hector St)
Length: 0.60 miles
Directions: E-W, N-S, SE-NW
Address range: 230 to 799
Directions: E-W, N-S, SE-NW
Address range: 230 to 799
Taughannock Blvd (State Hwy 89)
Length: 0.08 miles
Directions: N-S, SE-NW
Directions: N-S, SE-NW
Roads and streets:
Cass Park Access Rd
Length: 0.80 miles
Directions: E-W, N-S, SE-NW, SW-NE
Directions: E-W, N-S, SE-NW, SW-NE
Chestnut St
Length: 0.39 miles
Directions: N-S, SW-NE
Address range: 500 to 704
Directions: N-S, SW-NE
Address range: 500 to 704
Abbott Ln
Length: 0.20 miles
Directions: E-W, SW-NE
Directions: E-W, SW-NE
Vinegar Hill
Length: 0.09 miles
Direction: SW-NE
Direction: SW-NE
Elm St
Length: 0.06 miles
Direction: SW-NE
Direction: SW-NE
Other features:
Linderman Crk
Length: 0.64 miles
Directions: E-W, SE-NW, SW-NE
Directions: E-W, SE-NW, SW-NE