Woodside Park neighborhood in Silver Spring, Maryland (MD), 20910 detailed profile
Settings
X


Business Search - 14 Million verified businesses
Area: 0.334 square miles
Population: 2,382
Population density:
| Woodside Park: | 7,137 people per square mile |
| Silver Spring: | 7,993 people per square mile |

- 1,33553.9%White
- 53121.4%Black
- 1817.3%Hispanic or Latino
- 1666.7%Some other race
- 1636.6%Two or more races
- 1024.1%Asian

Median household income in 2022:
| Woodside Park: | $174,903 |
| Silver Spring: | $81,557 |
Distribution of median household income
![Distribution of median household income]()
- 10Less than $10,000
- 28$10,000 to $19,999
- 149$20,000 to $29,999
- 220$30,000 to $39,999
- 54$40,000 to $49,999
- 164$50,000 to $59,999
- 20$60,000 to $74,999
- 189$75,000 to $99,999
- 45$100,000 to $124,999
- 121$125,000 to $149,999
- 111$150,000 to $199,999
- 436$200,000 or more

Distribution of owner-occupied house/condo value
![Distribution of owner-occupied house/condo value]()
- 91$300,000 to $399,999
- 39$400,000 to $499,999
- 217$500,000 to $749,999
- 372$750,000 to $999,999
- 125$1,000,000 or more

Distribution of rent paid by renters
![Distribution of rent paid by renters]()
- 49$1,000 to $1,249
- 361$1,250 to $1,499
- 313$1,500 to $1,999
- 148$2,000 or more

| Males: | 1,176 |
| Females: | 1,206 |
Males:
| This neighborhood: | 41.4 years |
| Whole city: | 36.7 years |
| This neighborhood: | 46.4 years |
| Whole city: | 36.5 years |
Average household size:
| Woodside Park: | 6.0 people |
| Silver Spring: | 2.2 people |
Percentage of family households:
| Woodside Park: | 33.9% |
| Silver Spring: | 38.8% |
| Here: | 56.3% |
| Silver Spring: | 32.5% |
Percentage of married-couple families with children (among all households):
| Woodside Park: | 45.3% |
| Silver Spring: | 34.5% |
Percentage of single-mother households (among all households):
| Woodside Park: | 0.0% |
| Silver Spring: | 6.6% |
Percentage of never married males 15 years old and over:
Percentage of never married females 15 years old and over:
| Woodside Park: | 17.2% |
| Silver Spring: | 22.2% |
Percentage of never married females 15 years old and over:
| Woodside Park: | 11.9% |
| place: | 24.3% |
Percentage of people that speak English not well or not at all:
| Woodside Park: | 0.6% |
| Silver Spring: | 9.9% |
Percentage of people born in this state:
Percentage of people born in another U.S. state:
Percentage of native residents but born outside the U.S.:
Percentage of foreign born residents:
| Here: | 14.0% |
| Silver Spring: | 19.7% |
Percentage of people born in another U.S. state:
| Woodside Park: | 72.5% |
| Silver Spring: | 45.9% |
Percentage of native residents but born outside the U.S.:
| Here: | 0.8% |
| place: | 2.4% |
Percentage of foreign born residents:
| Here: | 12.7% |
| Silver Spring: | 32.0% |
Owner-occupied
Renter-occupied

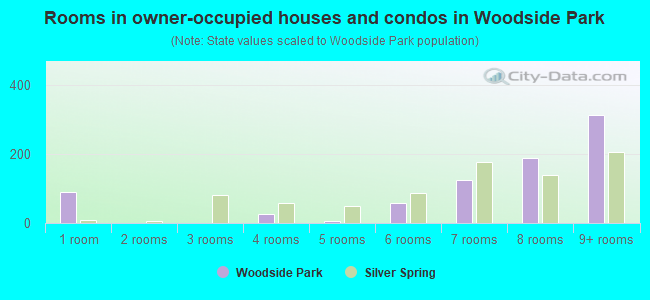
- Rooms in owner-occupied houses and condos in Woodside Park
- 901 room
- 02 rooms
- 03 rooms
- 274 rooms
- 65 rooms
- 576 rooms
- 1267 rooms
- 1898 rooms
- 3149+ rooms
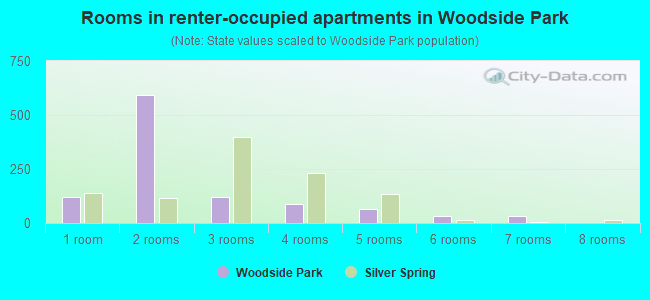
- Rooms in renter-occupied apartments in Woodside Park
- 1211 room
- 5912 rooms
- 1203 rooms
- 904 rooms
- 665 rooms
- 346 rooms
- 327 rooms
- 08 rooms
- 09+ rooms
Owner-occupied
Renter-occupied
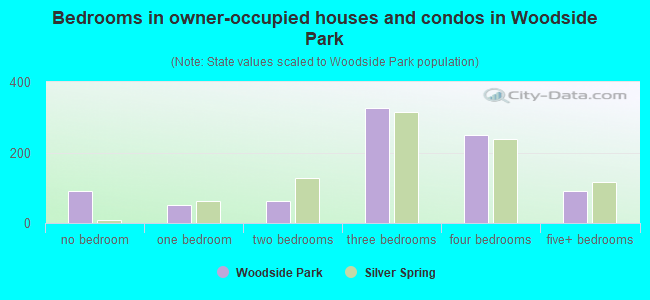
- Bedrooms in owner-occupied houses and condos in Woodside Park
- 90no bedroom
- 501 bedroom
- 612 bedrooms
- 3253 bedrooms
- 2494 bedrooms
- 925+ bedrooms
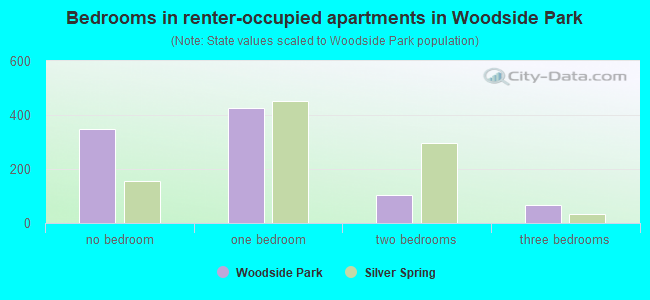
- Bedrooms in renter-occupied apartments in Woodside Park
- 349no bedroom
- 4261 bedroom
- 1032 bedrooms
- 663 bedrooms
- 04 bedrooms
- 05+ bedrooms
Average number of cars or other vehicles available in houses/condos:
Average number of cars or other vehicles available in apartments:
| This neighborhood: | 2.0 |
| Silver Spring: | 1.7 |
Average number of cars or other vehicles available in apartments:
| Here: | |
| place: |
Percentage of units with a mortgage:
| Woodside Park: | 57.7% |
| Silver Spring: | 76.3% |
Average estimated value of detached houses in 2022 (58.1% of all units):
| Woodside Park: | $848,218 |
| Maryland: | $526,819 |
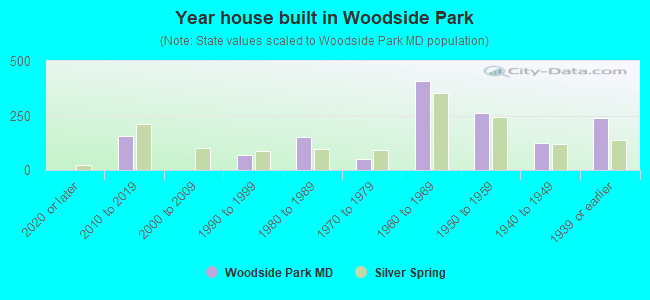
- Year house built in Woodside Park
- 02020 or later
- 1562010 to 2019
- 02000 to 2009
- 701990 to 1999
- 1531980 to 1989
- 491970 to 1979
- 4091960 to 1969
- 2621950 to 1959
- 1241940 to 1949
- 2381939 or earlier
Travel time to work (commute)
![Travel time to work (commute)]()
- 63Less than 5 minutes
- 205 to 9 minutes
- 10810 to 14 minutes
- 8315 to 19 minutes
- 7320 to 24 minutes
- 6225 to 29 minutes
- 16030 to 34 minutes
- 5235 to 39 minutes
- 6540 to 44 minutes
- 34645 to 59 minutes
- 7160 to 89 minutes
- 890 or more minutes

Means of transportation to work
![Means of transportation to work]()
- 42.7%637Drove a car alone
- 3.9%58Carpooled
- 3.3%49Bus
- 16.2%241Subway or elevated rail
- 3.3%49Taxi
- 3.2%47Bicycle
- 21.3%318Walked
- 1.0%15Other means
- 23.2%346Worked at home

Time leaving home to go to work
![Time leaving home to go to work]()
- 912:00 a.m. to 4:59 a.m.
- 95:30 a.m. to 5:59 a.m.
- 826:00 a.m. to 6:29 a.m.
- 696:30 a.m. to 6:59 a.m.
- 1817:00 a.m. to 7:29 a.m.
- 1167:30 a.m. to 7:59 a.m.
- 2188:00 a.m. to 8:29 a.m.
- 1688:30 a.m. to 8:59 a.m.
- 599:00 a.m. to 9:59 a.m.
- 1910:00 a.m. to 10:59 a.m.
- 3511:00 a.m. to 11:59 a.m.
- 3512:00 p.m. to 3:59 p.m.
- 364:00 p.m. to 11:59 p.m.

Occupations of males:
- Percentage of males in management occupations (except farmers):
Here: 16.8% place: 11.4%
- Percentage of males in business and financial operations occupations:
Here: 2.2% place: 6.8%
- Percentage of males in computer and mathematical occupations:
Here: 12.4% place: 9.4%
- Percentage of males in architecture and engineering occupations:
Here: 21.4% place: 4.5%
- Percentage of males in legal occupations:
Here: 4.2% place: 3.6%
- Percentage of males in education, training, and library occupations:
Here: 7.1% place: 6.2%
- Percentage of males in arts, design, entertainment, sports, and media occupations:
Here: 5.9% place: 3.9%
- Percentage of males in healthcare practitioners and technical occupations:
Here: 4.7% place: 2.5%
- Percentage of males in service occupations:
Here: 18.2% place: 10.9%
- Percentage of males in sales and office occupations:
Here: 3.6% place: 9.6%
- Percentage of males in transportation occupations:
Here: 2.0% place: 6.4%
Occupations of females:
- Percentage of females in management occupations (except farmers):
Here: 17.6% place: 13.0%
- Percentage of females in business and financial operations occupations:
Here: 8.3% place: 8.9%
- Percentage of females in computer and mathematical occupations:
Here: 15.6% place: 5.0%
- Percentage of females in architecture and engineering occupations:
Here: 2.2% place: 1.3%
- Percentage of females in life, physical, and social science occupations:
Here: 1.8% place: 3.4%
- Percentage of females in community and social services occupations:
Here: 1.4% place: 2.9%
- Percentage of females in legal occupations:
Here: 1.4% place: 4.2%
- Percentage of females in education, training, and library occupations:
Here: 29.8% place: 11.2%
- Percentage of females in arts, design, entertainment, sports, and media occupations:
Here: 4.9% place: 4.5%
- Percentage of females in healthcare practitioners and technical occupations:
Here: 1.2% place: 5.3%
- Percentage of females in service occupations:
Here: 10.1% place: 20.4%
- Percentage of females in sales and office occupations:
Here: 3.6% place: 16.7%
- Percentage of females in production occupations:
Here: 2.1% place: 0.9%
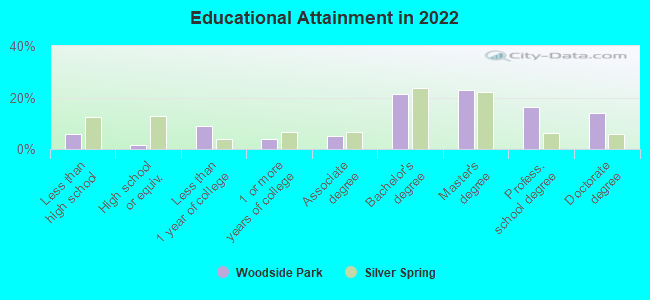
Education in this neighborhood (subdivision or community):
- Percentage of people 3 years and older in K-12 schools:
Woodside Park: 22.8% Silver Spring: 14.1%
- Percentage of people 3 years and older in undergraduate colleges:
Woodside Park: 7.7% Silver Spring: 3.4%
- Percentage of people 3 years and older in grad. or professional schools:
Woodside Park: 4.4% Silver Spring: 2.0%
- Percentage of students K-12 enrolled in private schools:
Woodside Park: 53.7% Silver Spring: 12.6%
Percentage of population below poverty level:
| Woodside Park: | 1.7% |
| Silver Spring: | 11.0% |
Median year owner moved in (as recorded in 2022):
| Woodside Park: | 2003 |
| Silver Spring: | 2011 |
Percentage of married-couple families with both working:
| Woodside Park: | 89.6% |
| Silver Spring: | 80.2% |

- 65.1%Utility gas
- 30.8%Electricity
- 4.1%Fuel oil, kerosene, etc.
Highways in this neighborhood:
Dale Dr (State Hwy 391)
Length: 1.06 miles
Directions: E-W, SE-NW
Address range: 910 to 1699
Directions: E-W, SE-NW
Address range: 910 to 1699
US Hwy 29 (Colesville Rd)
Length: 0.42 miles
Directions: N-S, SW-NE
Address range: 8900 to 9206
Directions: N-S, SW-NE
Address range: 8900 to 9206
Roads and streets:
Highland Dr
Length: 0.80 miles
Directions: E-W, SE-NW, SW-NE
Address range: 900 to 1499
Directions: E-W, SE-NW, SW-NE
Address range: 900 to 1499
Woodland Dr
Length: 0.76 miles
Directions: N-S, SE-NW
Address range: 8800 to 9302
Directions: N-S, SE-NW
Address range: 8800 to 9302
Woodside Pkwy
Length: 0.72 miles
Directions: E-W, SE-NW, SW-NE
Address range: 1000 to 1399
Directions: E-W, SE-NW, SW-NE
Address range: 1000 to 1399
Fairview Rd
Length: 0.55 miles
Directions: E-W, N-S, SW-NE
Address range: 8900 to 9199
Directions: E-W, N-S, SW-NE
Address range: 8900 to 9199
Alton Pkwy
Length: 0.50 miles
Directions: N-S, SW-NE
Address range: 8800 to 9199
Directions: N-S, SW-NE
Address range: 8800 to 9199
Noyes Dr
Length: 0.38 miles
Directions: E-W, SE-NW
Address range: 1100 to 1299
Directions: E-W, SE-NW
Address range: 1100 to 1299
Pinecrest Cir
Length: 0.24 miles
Directions: E-W, SE-NW, SW-NE
Address range: 1200 to 1299
Directions: E-W, SE-NW, SW-NE
Address range: 1200 to 1299
Grace Church Rd
Length: 0.23 miles
Directions: E-W, N-S, SW-NE
Address range: 1500 to 1599
Directions: E-W, N-S, SW-NE
Address range: 1500 to 1599
Crosby Rd
Length: 0.23 miles
Direction: N-S
Address range: 9100 to 9299
Direction: N-S
Address range: 9100 to 9299
N Noyes Dr
Length: 0.21 miles
Directions: E-W, SE-NW
Address range: 1010 to 1109
Directions: E-W, SE-NW
Address range: 1010 to 1109
Burton St
Length: 0.19 miles
Directions: E-W, SE-NW
Address range: 1200 to 1299
Directions: E-W, SE-NW
Address range: 1200 to 1299
S Noyes Dr
Length: 0.17 miles
Directions: E-W, SE-NW
Address range: 1000 to 1099
Directions: E-W, SE-NW
Address range: 1000 to 1099
Ballard St
Length: 0.14 miles
Directions: E-W, SE-NW, SW-NE
Address range: 1200 to 1299
Directions: E-W, SE-NW, SW-NE
Address range: 1200 to 1299
Spring St
Length: 0.14 miles
Directions: E-W, SW-NE
Address range: 1200 to 1244
Directions: E-W, SW-NE
Address range: 1200 to 1244
Midwood Rd
Length: 0.12 miles
Directions: N-S, SW-NE
Address range: 9200 to 9499
Directions: N-S, SW-NE
Address range: 9200 to 9499
S Mansion Dr
Length: 0.12 miles
Directions: E-W, SW-NE
Address range: 1001 to 1099
Directions: E-W, SW-NE
Address range: 1001 to 1099
N Mansion Dr
Length: 0.12 miles
Directions: E-W, N-S, SE-NW
Address range: 1000 to 1099
Directions: E-W, N-S, SE-NW
Address range: 1000 to 1099
Watson Rd
Length: 0.08 miles
Direction: SW-NE
Address range: 9100 to 9199
Direction: SW-NE
Address range: 9100 to 9199
Mansion Dr
Length: 0.07 miles
Direction: E-W
Address range: 900 to 999
Direction: E-W
Address range: 900 to 999
Rowen Rd
Length: 0.06 miles
Direction: E-W
Address range: 814 to 899
Direction: E-W
Address range: 814 to 899
Pinecrest Ct
Length: 0.04 miles
Direction: N-S
Address range: 1300 to 1399
Direction: N-S
Address range: 1300 to 1399
Noyes Ct
Length: 0.03 miles
Direction: E-W
Address range: 1 to 99
Direction: E-W
Address range: 1 to 99
Luzerne Ave
Length: 0.02 miles
Direction: SW-NE
Address range: 1680 to 1711
Direction: SW-NE
Address range: 1680 to 1711