Races in Abernant, Alabama (AL) Detailed Stats
Ancestries, Foreign-born residents, place of birth
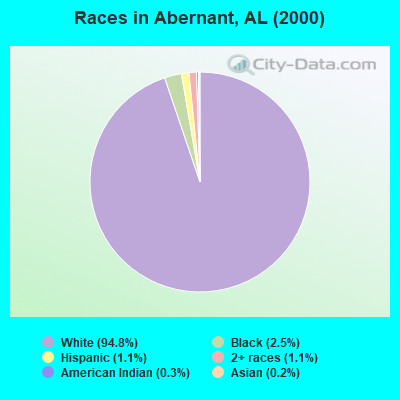
Race distribution in Abernant

- 6,64794.8%White alone
- 1742.5%Black alone
- 801.1%Hispanic
- 761.1%Two or more races
- 230.3%American Indian alone
- 110.2%Asian alone
- 10.01%Other race alone
- 10.01%Native Hawaiian and Other
Pacific Islander alone
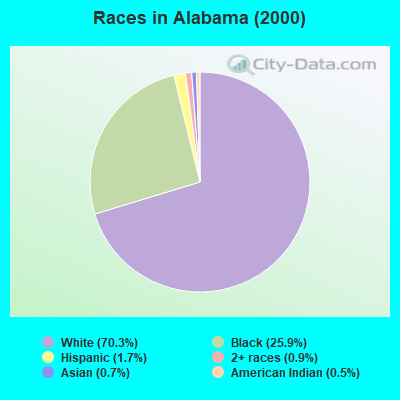
2000
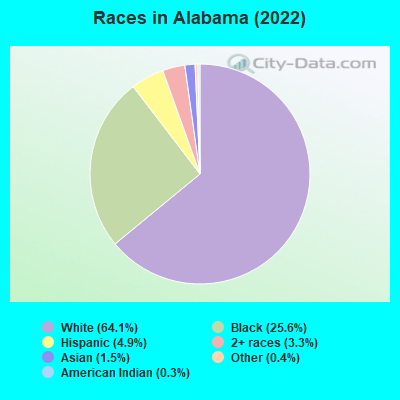
2022
-
- 3,125,81970.3%White alone
- 1,150,07625.9%Black alone
- 75,8301.7%Hispanic
- 39,0860.9%Two or more races
- 30,9890.7%Asian alone
- 21,6180.5%American Indian alone
- 2,6230.06%Other race alone
- 1,0590.02%Native Hawaiian and Other
Pacific Islander alone
-
- 3,250,18264.1%White alone
- 1,296,50025.6%Black alone
- 246,4774.9%Hispanic
- 169,8803.3%Two or more races
- 76,6821.5%Asian alone
- 19,9270.4%Other race alone
- 12,6940.3%American Indian alone
- 1,9540.04%Native Hawaiian and Other
Pacific Islander alone
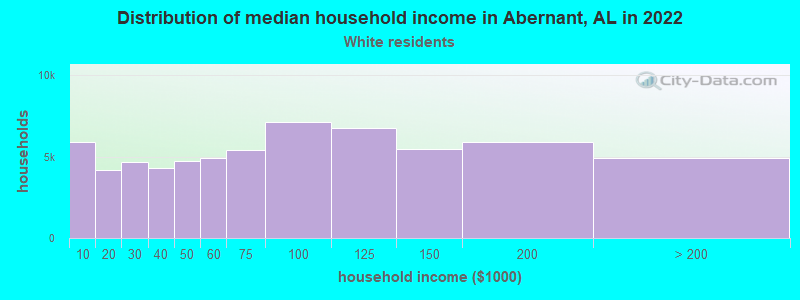
Income and house value in Abernant
- Median household income in 2022
- $78,241White non-Hispanic householders
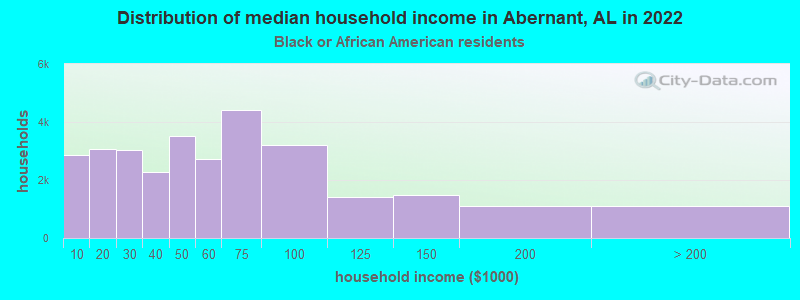
- $52,893Black householders
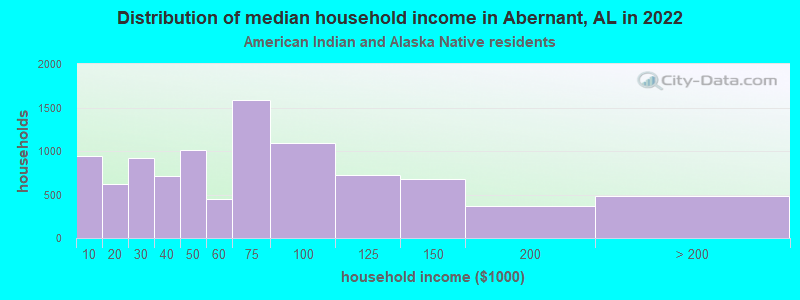
- $69,854American Indian and Alaska Native householders
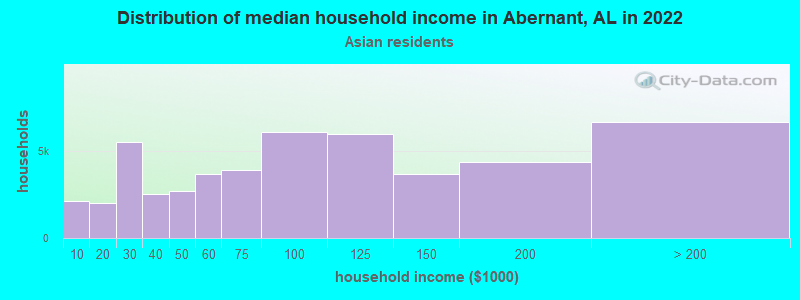
- $131,853Asian householders
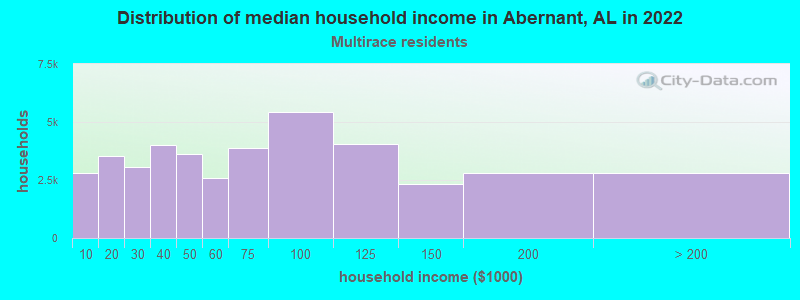
- $58,729Two or more races householders
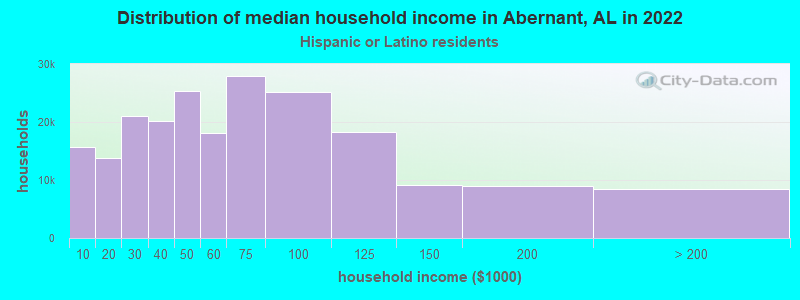
- over $200,000Hispanic or Latino race householders
- Median 2022 house value
- $304,362White Non-Hispanic householders
- $504,738Black or African American householders
- $288,646American Indian or Alaska Native householders
- $916,753Asian householders
- $338,413Two or more races householders
- $117,868Hispanic or Latino householders
Household income for White non-Hispanic householders
Household income for Black householders
Household income for American Indian and Alaska Native householders
Household income for Asian householders
Household income for Two or more races householders
Household income for Hispanic or Latino race householders
Zip code: 35111