Races in Accokeek, Maryland (MD) Detailed Stats
Data:
Races - White alone (%)
Races - White alone (% change since 2000)
Races - Black alone (%)
Races - Black alone (% change since 2000)
Races - American Indian alone (%)
Races - American Indian alone (% change since 2000)
Races - Asian alone (%)
Races - Asian alone (% change since 2000)
Races - Hispanic (%)
Races - Hispanic (% change since 2000)
Races - Native Hawaiian and Other Pacific Islander alone (%)
Races - Native Hawaiian and Other Pacific Islander alone (% change since 2000)
Races - Two or more races(%)
Races - Two or more races(% change since 2000)
Races - Other race alone (%)
Races - Other race alone (% change since 2000)
Racial diversity
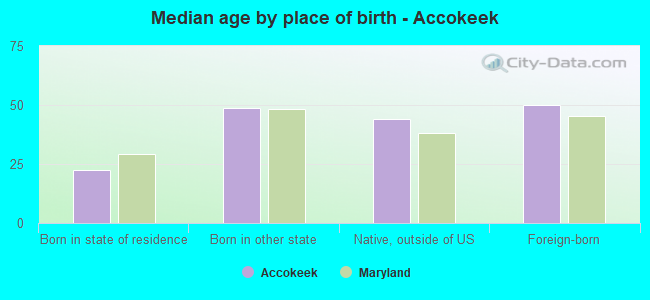
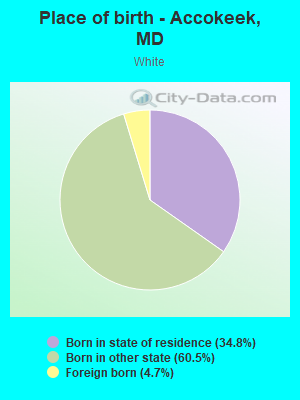
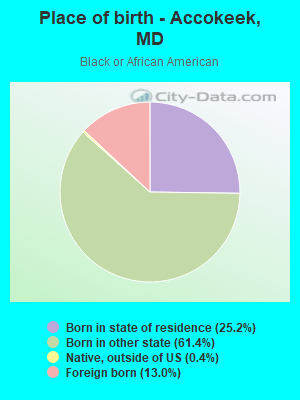
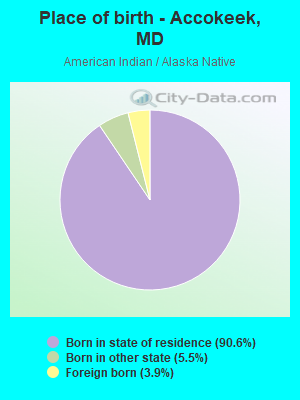
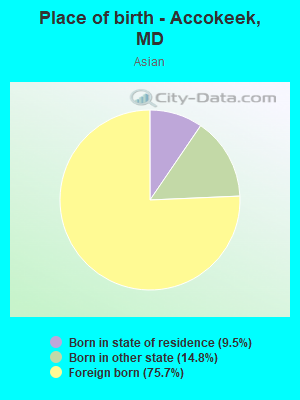
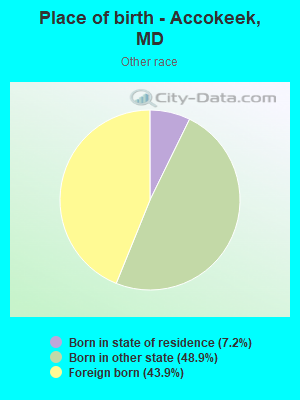
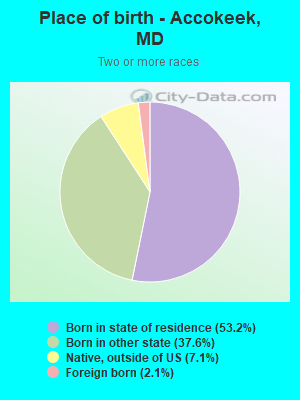
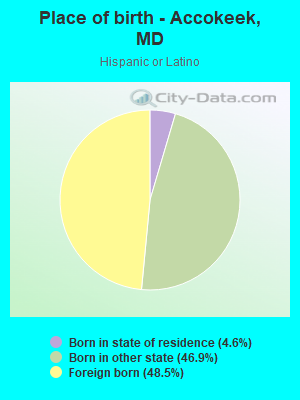
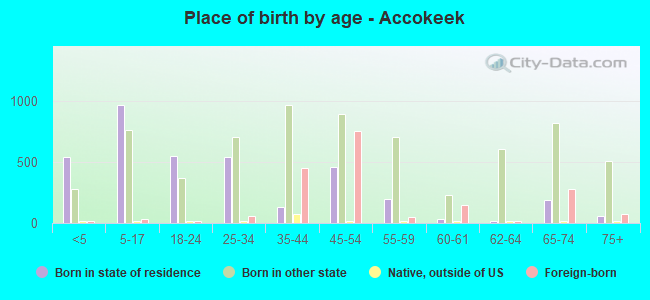
Place of birth - Born in state of residence (%)
Place of birth - Born in state of residence (%) - White
Place of birth - Born in state of residence (%) - Black or African American
Place of birth - Born in state of residence (%) - Asian
Place of birth - Born in state of residence (%) - Hispanic or Latino
Place of birth - Born in state of residence (%) - American Indian and Alaska Native
Place of birth - Born in state of residence (%) - Multirace
Place of birth - Born in state of residence (%) - Other Race
Place of birth - Born in other state (%)
Place of birth - Born in other state (%) - White
Place of birth - Born in other state (%) - Black or African American
Place of birth - Born in other state (%) - Asian
Place of birth - Born in other state (%) - Hispanic or Latino
Place of birth - Born in other state (%) - American Indian and Alaska Native
Place of birth - Born in other state (%) - Multirace
Place of birth - Born in other state (%) - Other Race
Place of birth - Native, outside of US (%)
Place of birth - Native, outside of US (%) - White
Place of birth - Native, outside of US (%) - Black or African American
Place of birth - Native, outside of US (%) - Asian
Place of birth - Native, outside of US (%) - Hispanic or Latino
Place of birth - Native, outside of US (%) - American Indian and Alaska Native
Place of birth - Native, outside of US (%) - Multirace
Place of birth - Native, outside of US (%) - Other Race
Place of birth - Foreign born (%)
Place of birth - Foreign born (%) - White
Place of birth - Foreign born (%) - Black or African American
Place of birth - Foreign born (%) - Asian
Place of birth - Foreign born (%) - Hispanic or Latino
Place of birth - Foreign born (%) - American Indian and Alaska Native
Place of birth - Foreign born (%) - Multirace
Place of birth - Foreign born (%) - Other Race
Residents speaking English at home (%)
Residents speaking English at home - Born in the United States (%)
Residents speaking English at home - Native, born elsewhere (%)
Residents speaking English at home - Foreign born (%)
Residents speaking Spanish at home (%)
Residents speaking Spanish at home - Born in the United States (%)
Residents speaking Spanish at home - Native, born elsewhere (%)
Residents speaking Spanish at home - Foreign born (%)
Residents speaking other language at home (%)
Residents speaking other language at home - Born in the United States (%)
Residents speaking other language at home - Native, born elsewhere (%)
Residents speaking other language at home - Foreign born (%)
Marital status - Never married (%)
Marital status - Now married (%)
Marital status - Separated (%)
Marital status - Widowed (%)
Marital status - Divorced (%)
Ancestries Reported - Arab (%)
Ancestries Reported - Czech (%)
Ancestries Reported - Danish (%)
Ancestries Reported - Dutch (%)
Ancestries Reported - English (%)
Ancestries Reported - French (%)
Ancestries Reported - French Canadian (%)
Ancestries Reported - German (%)
Ancestries Reported - Greek (%)
Ancestries Reported - Hungarian (%)
Ancestries Reported - Irish (%)
Ancestries Reported - Italian (%)
Ancestries Reported - Lithuanian (%)
Ancestries Reported - Norwegian (%)
Ancestries Reported - Polish (%)
Ancestries Reported - Portuguese (%)
Ancestries Reported - Russian (%)
Ancestries Reported - Scotch-Irish (%)
Ancestries Reported - Scottish (%)
Ancestries Reported - Slovak (%)
Ancestries Reported - Subsaharan African (%)
Ancestries Reported - Swedish (%)
Ancestries Reported - Swiss (%)
Ancestries Reported - Ukrainian (%)
Ancestries Reported - United States (%)
Ancestries Reported - Welsh (%)
Ancestries Reported - West Indian (%)
Ancestries Reported - Other (%)
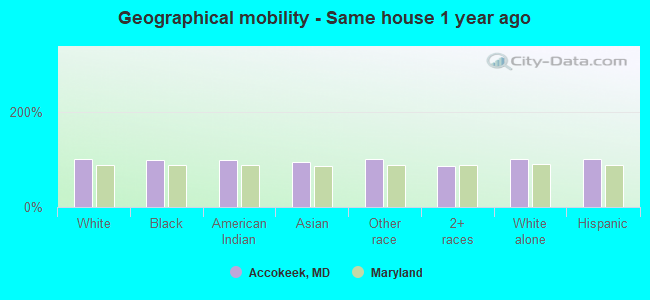
Geographical mobility - Same house 1 year ago (%)
Geographical mobility - Same house 1 year ago (%) - White
Geographical mobility - Same house 1 year ago (%) - Black or African American
Geographical mobility - Same house 1 year ago (%) - Asian
Geographical mobility - Same house 1 year ago (%) - Hispanic or Latino
Geographical mobility - Same house 1 year ago (%) - American Indian and Alaska Native
Geographical mobility - Same house 1 year ago (%) - Multirace
Geographical mobility - Same house 1 year ago (%) - Other Race
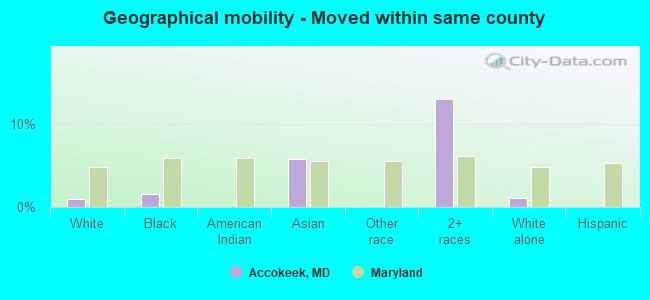
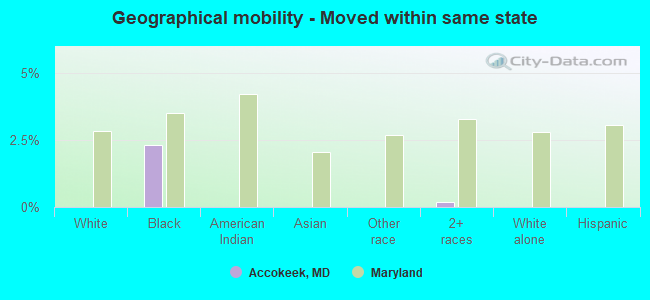
Geographical mobility - Moved within same county (%)
Geographical mobility - Moved within same county (%) - White
Geographical mobility - Moved within same county (%) - Black or African American
Geographical mobility - Moved within same county (%) - Asian
Geographical mobility - Moved within same county (%) - Hispanic or Latino
Geographical mobility - Moved within same county (%) - American Indian and Alaska Native
Geographical mobility - Moved within same county (%) - Multirace
Geographical mobility - Moved within same county (%) - Other Race
Geographical mobility - Moved from different county within same state (%)
Geographical mobility - Moved from different county within same state (%) - White
Geographical mobility - Moved from different county within same state (%) - Black or African American
Geographical mobility - Moved from different county within same state (%) - Asian
Geographical mobility - Moved from different county within same state (%) - Hispanic or Latino
Geographical mobility - Moved from different county within same state (%) - American Indian and Alaska Native
Geographical mobility - Moved from different county within same state (%) - Multirace
Geographical mobility - Moved from different county within same state (%) - Other Race
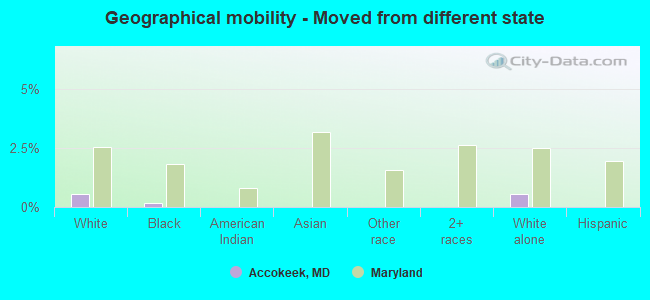
Geographical mobility - Moved from different state (%)
Geographical mobility - Moved from different state (%) - White
Geographical mobility - Moved from different state (%) - Black or African American
Geographical mobility - Moved from different state (%) - Asian
Geographical mobility - Moved from different state (%) - Hispanic or Latino
Geographical mobility - Moved from different state (%) - American Indian and Alaska Native
Geographical mobility - Moved from different state (%) - Multirace
Geographical mobility - Moved from different state (%) - Other Race
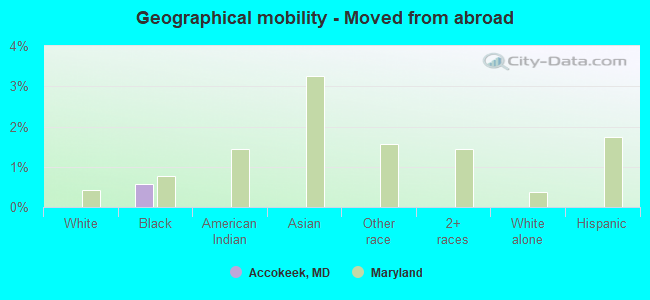
Geographical mobility - Moved from abroad (%)
Geographical mobility - Moved from abroad (%) - White
Geographical mobility - Moved from abroad (%) - Black or African American
Geographical mobility - Moved from abroad (%) - Asian
Geographical mobility - Moved from abroad (%) - Hispanic or Latino
Geographical mobility - Moved from abroad (%) - American Indian and Alaska Native
Geographical mobility - Moved from abroad (%) - Multirace
Geographical mobility - Moved from abroad (%) - Other Race
Place of birth for the foreign-born population - Ireland (%)
Place of birth for the foreign-born population - Denmark (%)
Place of birth for the foreign-born population - Norway (%)
Place of birth for the foreign-born population - Sweden (%)
Place of birth for the foreign-born population - United Kingdom (%)
Place of birth for the foreign-born population - England (%)
Place of birth for the foreign-born population - Scotland (%)
Place of birth for the foreign-born population - Other Northern Europe (%)
Place of birth for the foreign-born population - Austria (%)
Place of birth for the foreign-born population - Belgium (%)
Place of birth for the foreign-born population - France (%)
Place of birth for the foreign-born population - Germany (%)
Place of birth for the foreign-born population - Netherlands (%)
Place of birth for the foreign-born population - Switzerland (%)
Place of birth for the foreign-born population - Other Western Europe (%)
Place of birth for the foreign-born population - Greece (%)
Place of birth for the foreign-born population - Italy (%)
Place of birth for the foreign-born population - Portugal (%)
Place of birth for the foreign-born population - Spain (%)
Place of birth for the foreign-born population - Other Southern Europe (%)
Place of birth for the foreign-born population - Albania (%)
Place of birth for the foreign-born population - Belarus (%)
Place of birth for the foreign-born population - Bosnia and Herzegovina (%)
Place of birth for the foreign-born population - Bulgaria (%)
Place of birth for the foreign-born population - Croatia (%)
Place of birth for the foreign-born population - Czechoslovakia (%)
Place of birth for the foreign-born population - Hungary (%)
Place of birth for the foreign-born population - Latvia (%)
Place of birth for the foreign-born population - Lithuania (%)
Place of birth for the foreign-born population - North Macedonia (Macedonia) (%)
Place of birth for the foreign-born population - Moldova (%)
Place of birth for the foreign-born population - Poland (%)
Place of birth for the foreign-born population - Romania (%)
Place of birth for the foreign-born population - Russia (%)
Place of birth for the foreign-born population - Serbia (%)
Place of birth for the foreign-born population - Ukraine (%)
Place of birth for the foreign-born population - Other Eastern Europe (%)
Place of birth for the foreign-born population - China (%)
Place of birth for the foreign-born population - Hong Kong (%)
Place of birth for the foreign-born population - Taiwan (%)
Place of birth for the foreign-born population - Japan (%)
Place of birth for the foreign-born population - Korea (%)
Place of birth for the foreign-born population - Other Eastern Asia (%)
Place of birth for the foreign-born population - Afghanistan (%)
Place of birth for the foreign-born population - Bangladesh (%)
Place of birth for the foreign-born population - India (%)
Place of birth for the foreign-born population - Iran (%)
Place of birth for the foreign-born population - Kazakhstan (%)
Place of birth for the foreign-born population - Nepal (%)
Place of birth for the foreign-born population - Pakistan (%)
Place of birth for the foreign-born population - Sri Lanka (%)
Place of birth for the foreign-born population - Uzbekistan (%)
Place of birth for the foreign-born population - Other South Central Asia (%)
Place of birth for the foreign-born population - Burma (%)
Place of birth for the foreign-born population - Cambodia (%)
Place of birth for the foreign-born population - Indonesia (%)
Place of birth for the foreign-born population - Laos (%)
Place of birth for the foreign-born population - Malaysia (%)
Place of birth for the foreign-born population - Philippines (%)
Place of birth for the foreign-born population - Singapore (%)
Place of birth for the foreign-born population - Thailand (%)
Place of birth for the foreign-born population - Vietnam (%)
Place of birth for the foreign-born population - Other South Eastern Asia (%)
Place of birth for the foreign-born population - Armenia (%)
Place of birth for the foreign-born population - Iraq (%)
Place of birth for the foreign-born population - Israel (%)
Place of birth for the foreign-born population - Jordan (%)
Place of birth for the foreign-born population - Kuwait (%)
Place of birth for the foreign-born population - Lebanon (%)
Place of birth for the foreign-born population - Saudi Arabia (%)
Place of birth for the foreign-born population - Syria (%)
Place of birth for the foreign-born population - Turkey (%)
Place of birth for the foreign-born population - Yemen (%)
Place of birth for the foreign-born population - Other Western Asia (%)
Place of birth for the foreign-born population - Eritrea (%)
Place of birth for the foreign-born population - Ethiopia (%)
Place of birth for the foreign-born population - Kenya (%)
Place of birth for the foreign-born population - Somalia (%)
Place of birth for the foreign-born population - Uganda (%)
Place of birth for the foreign-born population - Zimbabwe (%)
Place of birth for the foreign-born population - Other Eastern Africa (%)
Place of birth for the foreign-born population - Cameroon (%)
Place of birth for the foreign-born population - Congo (%)
Place of birth for the foreign-born population - Democratic Republic of Congo (Zaire) (%)
Place of birth for the foreign-born population - Other Middle Africa (%)
Place of birth for the foreign-born population - Egypt (%)
Place of birth for the foreign-born population - Morocco (%)
Place of birth for the foreign-born population - Sudan (%)
Place of birth for the foreign-born population - Other Northern Africa (%)
Place of birth for the foreign-born population - South Africa (%)
Place of birth for the foreign-born population - Other Southern Africa (%)
Place of birth for the foreign-born population - Cabo Verde (%)
Place of birth for the foreign-born population - Ghana (%)
Place of birth for the foreign-born population - Liberia (%)
Place of birth for the foreign-born population - Nigeria (%)
Place of birth for the foreign-born population - Senegal (%)
Place of birth for the foreign-born population - Sierra Leone (%)
Place of birth for the foreign-born population - Other Western Africa (%)
Place of birth for the foreign-born population - Australia (%)
Place of birth for the foreign-born population - New Zealand (%)
Place of birth for the foreign-born population - Fiji (%)
Place of birth for the foreign-born population - Micronesia (%)
Place of birth for the foreign-born population - Bahamas (%)
Place of birth for the foreign-born population - Barbados (%)
Place of birth for the foreign-born population - Cuba (%)
Place of birth for the foreign-born population - Dominica (%)
Place of birth for the foreign-born population - Dominican Republic (%)
Place of birth for the foreign-born population - Grenada (%)
Place of birth for the foreign-born population - Haiti (%)
Place of birth for the foreign-born population - Jamaica (%)
Place of birth for the foreign-born population - St. Vincent and the Grenadines (%)
Place of birth for the foreign-born population - Trinidad and Tobago (%)
Place of birth for the foreign-born population - West Indies (%)
Place of birth for the foreign-born population - Other Caribbean (%)
Place of birth for the foreign-born population - Belize (%)
Place of birth for the foreign-born population - Costa Rica (%)
Place of birth for the foreign-born population - El Salvador (%)
Place of birth for the foreign-born population - Guatemala (%)
Place of birth for the foreign-born population - Honduras (%)
Place of birth for the foreign-born population - Mexico (%)
Place of birth for the foreign-born population - Nicaragua (%)
Place of birth for the foreign-born population - Panama (%)
Place of birth for the foreign-born population - Other Central America (%)
Place of birth for the foreign-born population - Argentina (%)
Place of birth for the foreign-born population - Bolivia (%)
Place of birth for the foreign-born population - Brazil (%)
Place of birth for the foreign-born population - Chile (%)
Place of birth for the foreign-born population - Colombia (%)
Place of birth for the foreign-born population - Ecuador (%)
Place of birth for the foreign-born population - Guyana (%)
Place of birth for the foreign-born population - Peru (%)
Place of birth for the foreign-born population - Uruguay (%)
Place of birth for the foreign-born population - Venezuela (%)
Place of birth for the foreign-born population - Other South America (%)
Place of birth for the foreign-born population - Canada (%)
Place of birth for the foreign-born population - Other Northern America (%)
Place of birth for the foreign-born population - Other (%)
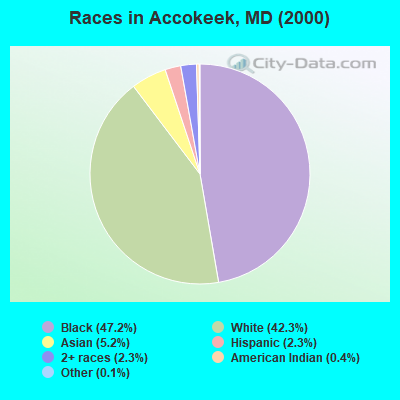
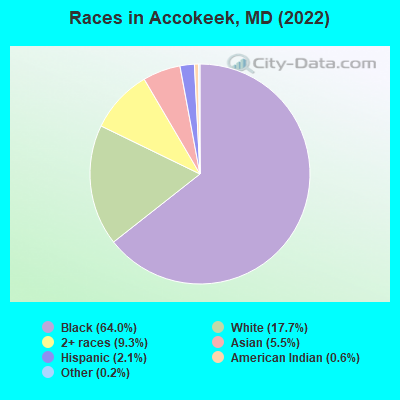
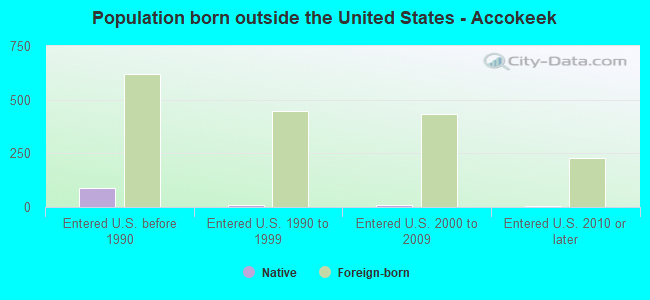
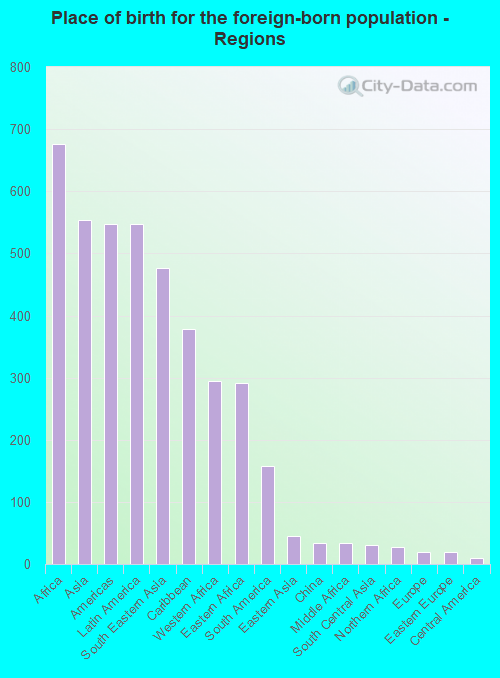
According to 2022 data, the most numerous races in Accokeek, MD are White alone (2,237 residents), Black alone (8,064 residents), and Hispanic (267 residents). 83.5% of Accokeek residents speak English at home. 14.2% of Accokeek, MD residents are foreign-born (5.0% born in Africa, 4.1% born in Asia, 4.0% born in Latin America), which is 12.3% less than the foreign-born rate of 16.0% across the entire state of Maryland.
Race distribution in Accokeek
2000 2022
3,286,547 62.1% White alone 1,464,735 27.7% Black alone 227,916 4.3% Hispanic 209,738 4.0% Asian alone 82,946 1.6% Two or more races 13,312 0.3% American Indian alone 9,379 0.2% Other race alone 1,913 0.04% Native Hawaiian and Other
2,906,492 47.1% White alone 1,800,914 29.2% Black alone 705,842 11.4% Hispanic 401,818 6.5% Asian alone 291,317 4.7% Two or more races 46,930 0.8% Other race alone 8,930 0.1% American Indian alone 2,417 0.04% Native Hawaiian and Other
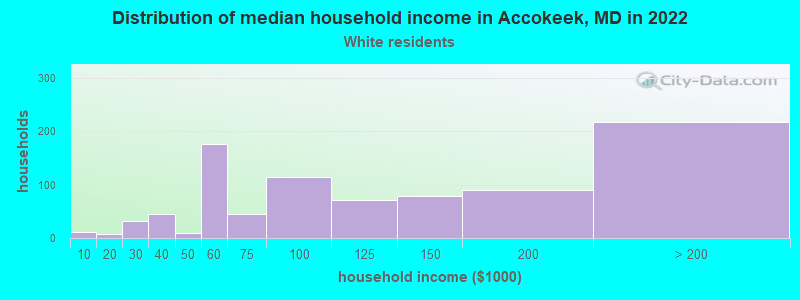
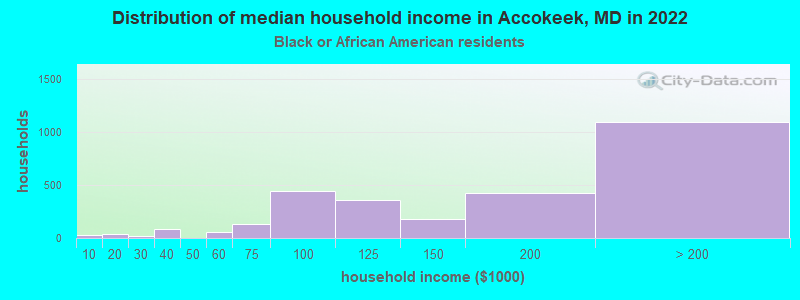
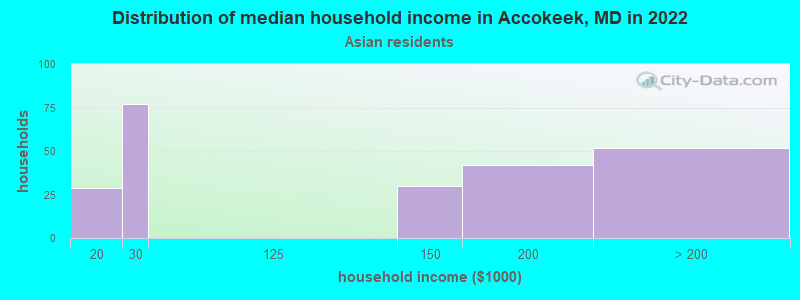
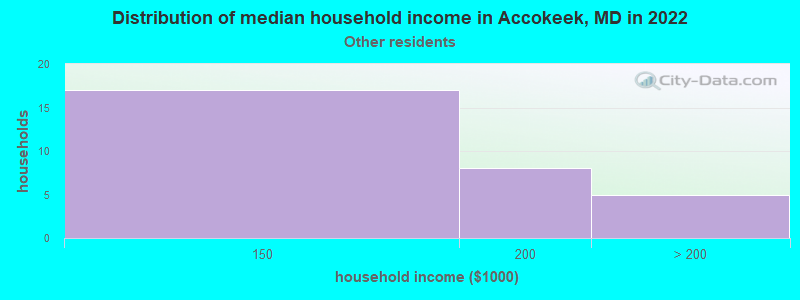
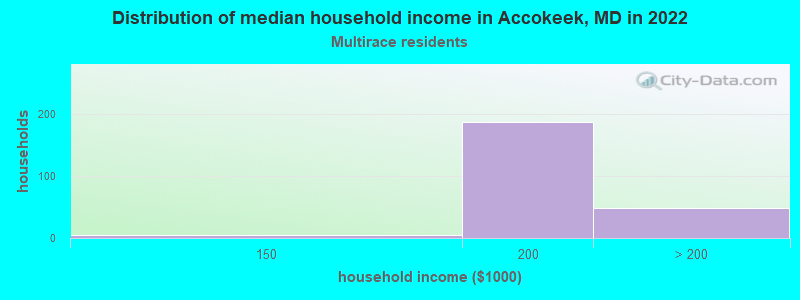
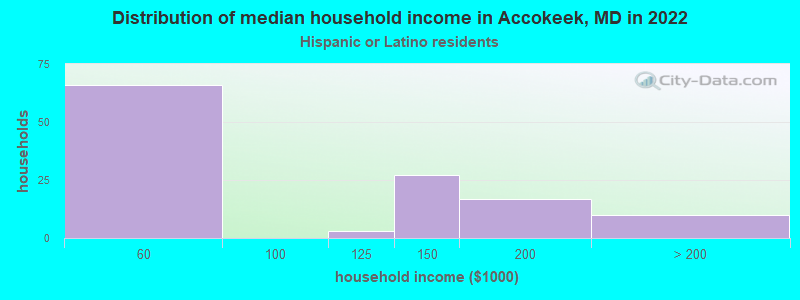
Income and house value in Accokeek Median household income in 2022 $112,736 White non-Hispanic householders$151,124 Black householders$137,693 Asian householders$114,101 Some other race householders$170,254 Two or more races householdersMedian 2022 house value $412,455 White Non-Hispanic householders$605,359 Black or African American householders$366,657 American Indian or Alaska Native householders $459,640 Asian householders$435,492 Some other race householders$581,489 Two or more races householders$431,884 Hispanic or Latino householders
Median age by race in Accokeek
50.1 Median age for White residents54.4 48.5 44.6 Median age for Black or African American residents41.4 47.4 63.7 Median age for American Indian / Alaska Native residents-888,297,871.5 -689,905,591.2 52.5 Median age for Asian residents45.0 56.1 -571,600,480.8 Median age for Native Hawaiian / Pacific Islander residents-720,061,021.4 -760,942,760.2 43.6 Median age for Other race residents42.4 42.3 12.5 Median age for Two or more races residents25.7 4.8 49.1 Median age for White alone residents51.6 43.8 48.7 Median age for Hispanic or Latino residents34.8 49.2
Owner/renter occupied households by race in Accokeek
House owners and renters - White residents 819 95.4% Owner occupied39 4.6% Renter occupiedHouse owners and renters - Black or African American residents 2,863 99.5% Owner occupied15 0.5% Renter occupiedHouse owners and renters - American Indian / Alaska Native residents 4 100.0% Owner occupiedHouse owners and renters - Asian residents 253 100.0% Owner occupiedHouse owners and renters - Other race residents 38 100.0% Owner occupiedHouse owners and renters - Two or more races residents 280 100.0% Owner occupiedHouse owners and renters - White alone residents 789 95.3% Owner occupied39 4.7% Renter occupiedHouse owners and renters - Hispanic or Latino residents 123 99.1% Owner occupied1 0.9% Renter occupied
Language usage in Accokeek
English speakers - Total 83.5% of residents of Accokeek speak English at home.
2.0% of residents speak Spanish at home 174 73.1% Speak English very well64 26.9% Speak English less than very well13.5% of residents speak other language at home 1,305 81.9% Speak English very well289 18.1% Speak English less than very well
English speakers - Born in the United States 92.7% of residents of Accokeek speak English at home.
1.7% of residents speak Spanish at home 109 100.0% Speak English very well6.3% of residents speak other language at home 399 96.6% Speak English very well14 3.4% Speak English less than very well
All residents speak only English at home
English speakers - Foreign-born 31.3% of residents of Accokeek speak English at home.
7.0% of residents speak Spanish at home 63 49.6% Speak English very well64 50.4% Speak English less than very well65.1% of residents speak other language at home 916 77.4% Speak English very well268 22.6% Speak English less than very well
White (Caucasian) - Speak only English Native:
98.5% (2,008)Foreign-born:
42.7% (43)
White (Caucasian) - Speak another language Native:
2.2% (44)Foreign-born:
64.2% (64)
Black or African American - Speak only English Native:
95.1% (6,254)Foreign-born:
38.1% (395)
Black or African American - Speak another language Native:
5.1% (334)Foreign-born:
61.9% (642)
Asian - Speak only English Native:
46.5% (67)Foreign-born:
23.3% (121)
Asian - Speak another language Native:
49.6% (72)Foreign-born:
78.6% (410)
Other race - Speak another language Native:
17.6% (11)Foreign-born:
100.0% (52)
Two or more races - Speak only English Native:
96.2% (815)Foreign-born:
56.3% (15)
Two or more races - Speak another language Native:
2.0% (17)Foreign-born:
35.1% (9)
White alone - Speak only English Native:
96.6% (1,987)Foreign-born:
48.4% (48)
White alone - Speak another language Native:
2.9% (59)Foreign-born:
52.5% (52)
Hispanic or Latino - Speak only English Native:
78.0% (96)Foreign-born:
1.4% (2)
Hispanic or Latino - Speak another language Native:
26.6% (33)Foreign-born:
99.1% (127)
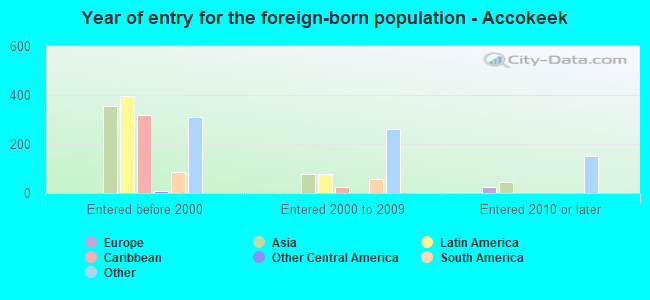
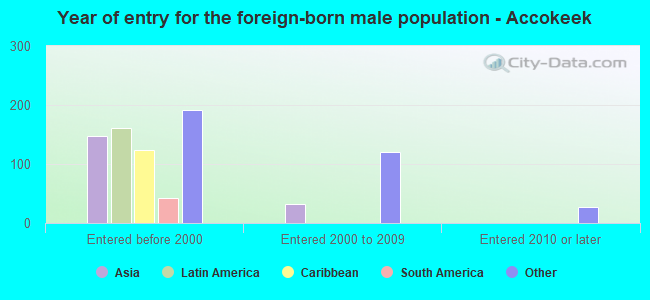
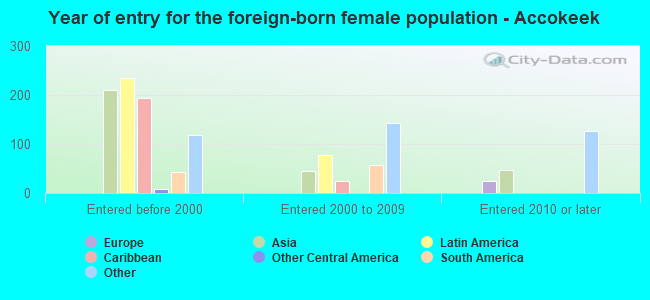
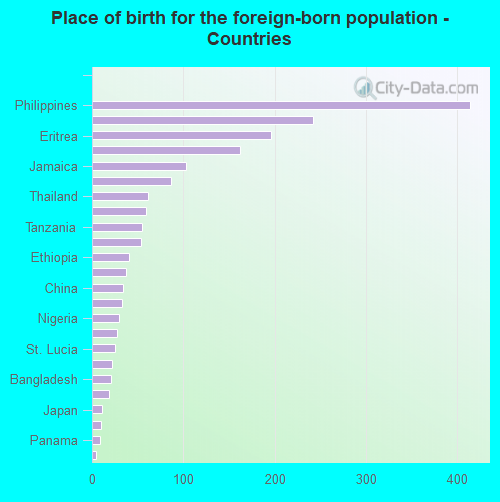
Foreign-born residents in Accokeek 1,796 residents are foreign born (5.0% Africa , 4.1% Asia , 4.0% Latin America ).
This city:
14.2%Maryland:
15.7%
Marital status for residents in Accokeek Marital status - White (Caucasian) population 15 years and over
Males 33.5% Never married50.2% Now married1.1% Separated6.2% Widowed9.0% DivorcedFemales 14.0% Never married62.3% Now married0.0% Separated9.8% Widowed13.9% DivorcedWomen who gave birth in the past 12 months Now married:
100.0% (3)Unmarried:
0.0% (0)
Women who did not give birth in the past 12 months Now married:
58.0% (261)Unmarried:
42.0% (189)
Marital status - Black or African American population 15 years and over
Males 38.2% Never married50.2% Now married1.0% Separated2.7% Widowed7.9% DivorcedFemales 29.7% Never married43.5% Now married2.2% Separated8.1% Widowed16.5% DivorcedWomen who gave birth in the past 12 months Now married:
100.0% (21)Unmarried:
0.0% (0)
Women who did not give birth in the past 12 months Now married:
43.2% (818)Unmarried:
56.8% (1,075)
Marital status - Asian population 15 years and over
Males 17.2% Never married66.4% Now married12.3% Separated4.1% Widowed0.0% DivorcedFemales 5.2% Never married64.9% Now married0.0% Separated30.0% Widowed0.0% DivorcedWomen who gave birth in the past 12 months Now married:
100.0% (7)Unmarried:
0.0% (0)
Women who did not give birth in the past 12 months Now married:
86.9% (120)Unmarried:
13.1% (18)
Marital status - Other race population 15 years and over
Males 34.9% Never married65.1% Now married0.0% Separated0.0% Widowed0.0% DivorcedFemales 53.7% Never married7.5% Now married0.0% Separated0.0% Widowed38.8% DivorcedWomen who did not give birth in the past 12 months Now married:
12.2% (6)Unmarried:
87.8% (40)
Marital status - Two or more races population 15 years and over
Males 50.6% Never married22.8% Now married0.0% Separated0.0% Widowed26.6% DivorcedFemales 10.6% Never married61.5% Now married0.0% Separated0.0% Widowed27.9% DivorcedWomen who did not give birth in the past 12 months Now married:
58.5% (34)Unmarried:
41.5% (24)
Marital status - White alone, not Hispanic / Latino population 15 years and over
Males 33.8% Never married50.6% Now married1.1% Separated6.2% Widowed8.3% DivorcedFemales 15.1% Never married66.1% Now married0.0% Separated10.6% Widowed8.2% DivorcedWomen who gave birth in the past 12 months Now married:
100.0% (3)Unmarried:
0.0% (0)
Women who did not give birth in the past 12 months Now married:
64.4% (281)Unmarried:
35.6% (155)
Marital status - Hispanic or Latino population 15 years and over
Males 0.0% Never married58.9% Now married0.0% Separated0.0% Widowed41.1% DivorcedFemales 26.1% Never married16.2% Now married0.0% Separated0.0% Widowed57.7% DivorcedWomen who did not give birth in the past 12 months Now married:
12.3% (13)Unmarried:
87.7% (96)
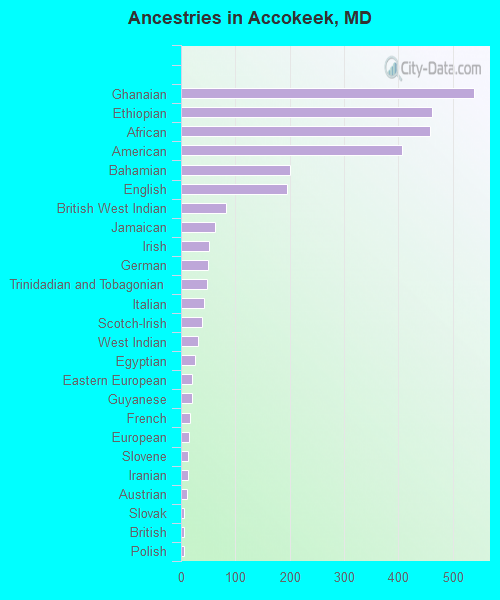
Ancestries in Accokeek
540 6.9% Ghanaian462 5.9% Ethiopian458 5.9% African407 5.2% American200 2.6% Bahamian195 2.5% English83 1.1% British West Indian62 0.8% Jamaican52 0.7% Irish50 0.6% German48 0.6% Trinidadian and Tobagonian43 0.6% Italian38 0.5% Scotch-Irish32 0.4% West Indian26 0.3% Egyptian21 0.3% Eastern European20 0.3% Guyanese16 0.2% French15 0.2% European13 0.2% Slovene12 0.2% Iranian11 0.1% Austrian6 0.08% Slovak5 0.06% British5 0.06% Polish2 0.03% Turkish1 0.01% Dutch
Children Nativity (place of birth) in Accokeek
Children under 6 years - Living with two parents Both parents native 367 100.0% NativeBoth parents foreign-born 163 100.0% NativeOne native, one foreign-born parent 58 100.0% NativeChildren under 6 years - Living with one parent Native parent 116 100.0% NativeChildren 6 to 17 years - Living with two parents Both parents native 616 100.0% Native0 0.0% Foreign-bornBoth parents foreign-born 387 93.1% Native29 6.9% Foreign-bornOne native, one foreign-born parent 113 100.0% NativeChildren 6 to 17 years - Living with one parent Native parent 373 100.0% NativeForeign-born parent 57 51.9% Native53 48.1% Foreign-born
Grandparents responsible for own grandchildren in Accokeek
Grandparents (30 to 59 years) Black or African American 24 23.0% Responsible for grandchildren81 77.0% Not responsible for grandchildrenGrandparents (60 years and over) Black or African American 37 17.9% Responsible for grandchildren172 82.1% Not responsible for grandchildren