Races in Acushnet, Massachusetts (MA) Detailed Stats
Ancestries, Foreign-born residents, place of birth

Recent posts about races in Acushnet, Massachusetts on our local forum with over 2,400,000 registered users:
 | Under $250k any Massachusetts single family house with yard (117 replies) |
| Big MA Ancestry Data Thread by Town (31 replies) |
| Another shooting in New Bedford (69 replies) |
| Armed standoff in Dartmouth (22 replies) |
| Massachusetts Cities' Population in 2020, 2040? (21 replies) |
| New Bedford, give me the good, the bad, and the ugly (28 replies) |
10.2% of Acushnet, MA residents are foreign-born (8.1% born in Europe), which is 75.9% less than the foreign-born rate of 18.0% across the entire state of Massachusetts.
Race distribution in Acushnet

- 9,84296.9%White alone
- 1071.1%Two or more races
- 800.8%Hispanic
- 550.5%Other race alone
- 420.4%Black alone
- 170.2%Asian alone
- 160.2%American Indian alone
- 20.02%Native Hawaiian and Other
Pacific Islander alone
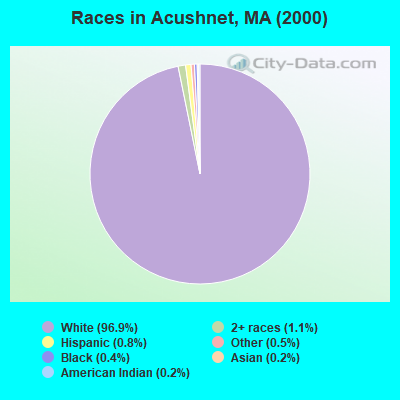
2000
2022
-
- 5,198,35981.9%White alone
- 428,7296.8%Hispanic
- 318,3295.0%Black alone
- 236,7863.7%Asian alone
- 110,3381.7%Two or more races
- 43,5860.7%Other race alone
- 11,2640.2%American Indian alone
- 1,7060.03%Native Hawaiian and Other
Pacific Islander alone

-
- 4,676,62767.0%White alone
- 911,03813.0%Hispanic
- 501,4637.2%Asian alone
- 459,7406.6%Black alone
- 341,8894.9%Two or more races
- 84,4031.2%Other race alone
- 5,8380.08%American Indian alone
- 9760.01%Native Hawaiian and Other
Pacific Islander alone

Income and house value in Acushnet
- Median household income in 2022
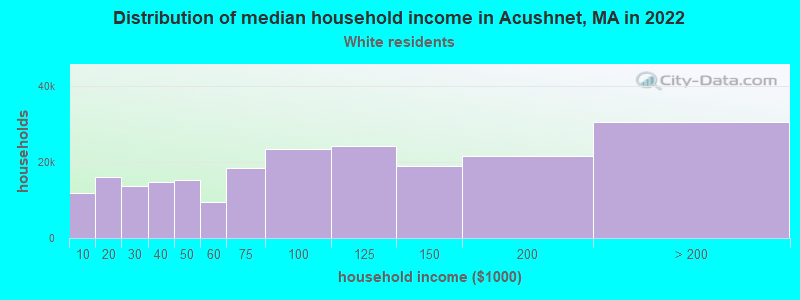
- $98,448White non-Hispanic householders
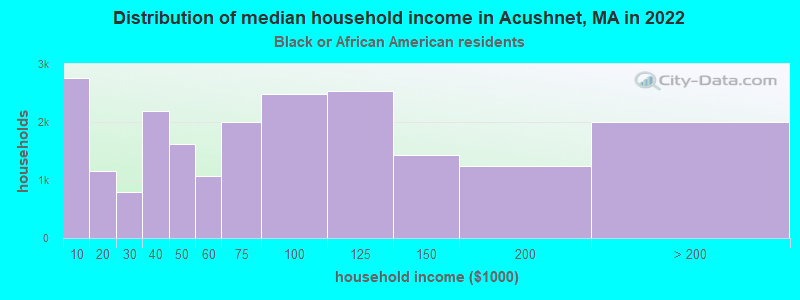
- $140,337Black householders
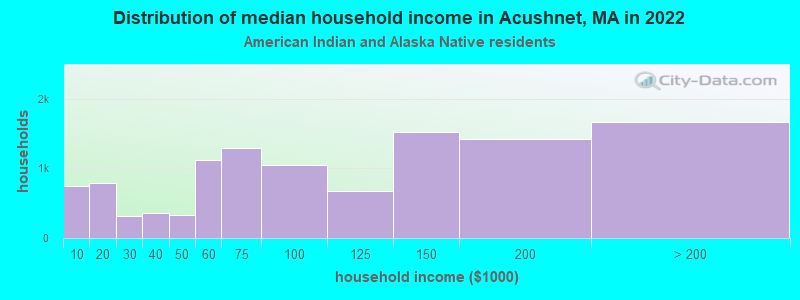
- $141,034American Indian and Alaska Native householders
- $127,577Asian householders
- $118,850Some other race householders
- $106,370Two or more races householders
- $56,449Hispanic or Latino race householders
- Median 2022 house value
- $411,148White Non-Hispanic householders
- $376,201American Indian or Alaska Native householders
- $587,355Asian householders
- $330,387Some other race householders
- $422,308Two or more races householders
- $330,387Hispanic or Latino householders
Household income for White non-Hispanic householders
Household income for Black householders
Household income for American Indian and Alaska Native householders
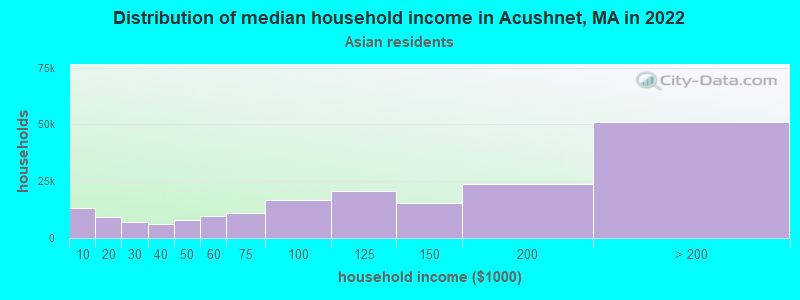
Household income for Asian householders
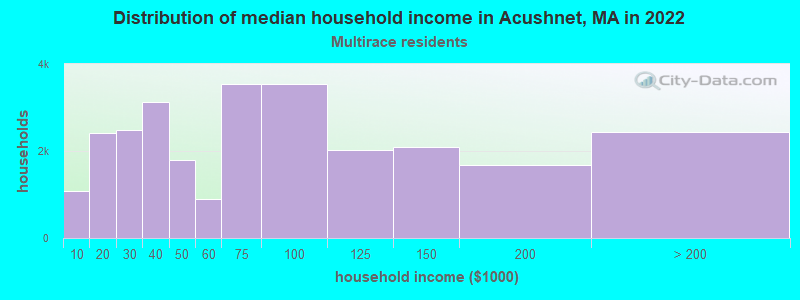
Household income for Two or more races householders
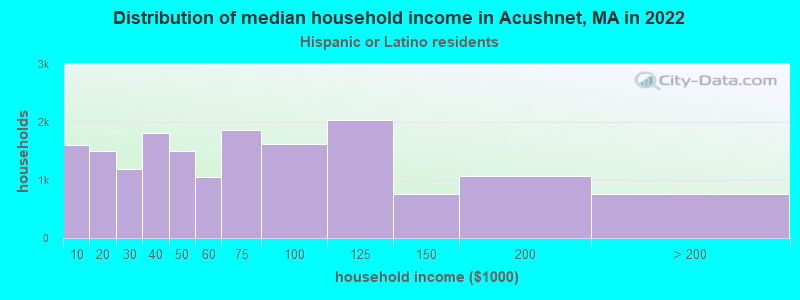
Household income for Hispanic or Latino race householders
Foreign-born residents in Acushnet
1,040 residents are foreign born (8.1% Europe).
| This city: | 10.2% |
| Massachusetts: | 12.2% |
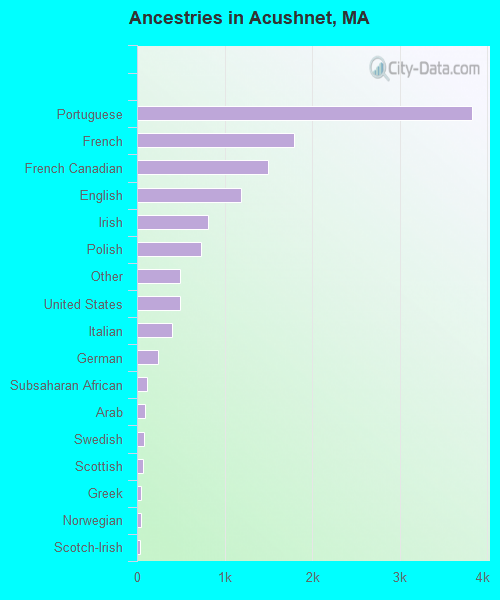
Ancestries in Acushnet

- 3,82731.6%Portuguese
- 1,79114.8%French
- 1,49212.3%French Canadian
- 1,1899.8%English
- 8126.7%Irish
- 7336.1%Polish
- 4934.1%Other
- 4874.0%United States
- 3973.3%Italian
- 2402.0%German
- 1110.9%Subsaharan African
- 970.8%Arab
- 850.7%Swedish
- 640.5%Scottish
- 450.4%Greek
- 420.3%Norwegian
- 360.3%Scotch-Irish
- 330.3%Dutch
- 270.2%Welsh
- 260.2%Russian
- 230.2%West Indian
- 200.2%Czech
- 190.2%Slovak
- 110.09%Danish
- 80.07%Ukrainian
- 50.04%Hungarian
Zip codes: 02743.