Races in Agawam Town, Massachusetts (MA) Detailed Stats
Data:
Races - White alone (%)
Races - White alone (% change since 2000)
Races - Black alone (%)
Races - Black alone (% change since 2000)
Races - American Indian alone (%)
Races - American Indian alone (% change since 2000)
Races - Asian alone (%)
Races - Asian alone (% change since 2000)
Races - Hispanic (%)
Races - Hispanic (% change since 2000)
Races - Native Hawaiian and Other Pacific Islander alone (%)
Races - Native Hawaiian and Other Pacific Islander alone (% change since 2000)
Races - Two or more races(%)
Races - Two or more races(% change since 2000)
Races - Other race alone (%)
Races - Other race alone (% change since 2000)
Racial diversity
Place of birth - Born in state of residence (%)
Place of birth - Born in state of residence (%) - White
Place of birth - Born in state of residence (%) - Black or African American
Place of birth - Born in state of residence (%) - Asian
Place of birth - Born in state of residence (%) - Hispanic or Latino
Place of birth - Born in state of residence (%) - American Indian and Alaska Native
Place of birth - Born in state of residence (%) - Multirace
Place of birth - Born in state of residence (%) - Other Race
Place of birth - Born in other state (%)
Place of birth - Born in other state (%) - White
Place of birth - Born in other state (%) - Black or African American
Place of birth - Born in other state (%) - Asian
Place of birth - Born in other state (%) - Hispanic or Latino
Place of birth - Born in other state (%) - American Indian and Alaska Native
Place of birth - Born in other state (%) - Multirace
Place of birth - Born in other state (%) - Other Race
Place of birth - Native, outside of US (%)
Place of birth - Native, outside of US (%) - White
Place of birth - Native, outside of US (%) - Black or African American
Place of birth - Native, outside of US (%) - Asian
Place of birth - Native, outside of US (%) - Hispanic or Latino
Place of birth - Native, outside of US (%) - American Indian and Alaska Native
Place of birth - Native, outside of US (%) - Multirace
Place of birth - Native, outside of US (%) - Other Race
Place of birth - Foreign born (%)
Place of birth - Foreign born (%) - White
Place of birth - Foreign born (%) - Black or African American
Place of birth - Foreign born (%) - Asian
Place of birth - Foreign born (%) - Hispanic or Latino
Place of birth - Foreign born (%) - American Indian and Alaska Native
Place of birth - Foreign born (%) - Multirace
Place of birth - Foreign born (%) - Other Race
Residents speaking English at home (%)
Residents speaking English at home - Born in the United States (%)
Residents speaking English at home - Native, born elsewhere (%)
Residents speaking English at home - Foreign born (%)
Residents speaking Spanish at home (%)
Residents speaking Spanish at home - Born in the United States (%)
Residents speaking Spanish at home - Native, born elsewhere (%)
Residents speaking Spanish at home - Foreign born (%)
Residents speaking other language at home (%)
Residents speaking other language at home - Born in the United States (%)
Residents speaking other language at home - Native, born elsewhere (%)
Residents speaking other language at home - Foreign born (%)
Marital status - Never married (%)
Marital status - Now married (%)
Marital status - Separated (%)
Marital status - Widowed (%)
Marital status - Divorced (%)
Ancestries Reported - Arab (%)
Ancestries Reported - Czech (%)
Ancestries Reported - Danish (%)
Ancestries Reported - Dutch (%)
Ancestries Reported - English (%)
Ancestries Reported - French (%)
Ancestries Reported - French Canadian (%)
Ancestries Reported - German (%)
Ancestries Reported - Greek (%)
Ancestries Reported - Hungarian (%)
Ancestries Reported - Irish (%)
Ancestries Reported - Italian (%)
Ancestries Reported - Lithuanian (%)
Ancestries Reported - Norwegian (%)
Ancestries Reported - Polish (%)
Ancestries Reported - Portuguese (%)
Ancestries Reported - Russian (%)
Ancestries Reported - Scotch-Irish (%)
Ancestries Reported - Scottish (%)
Ancestries Reported - Slovak (%)
Ancestries Reported - Subsaharan African (%)
Ancestries Reported - Swedish (%)
Ancestries Reported - Swiss (%)
Ancestries Reported - Ukrainian (%)
Ancestries Reported - United States (%)
Ancestries Reported - Welsh (%)
Ancestries Reported - West Indian (%)
Ancestries Reported - Other (%)
Geographical mobility - Same house 1 year ago (%)
Geographical mobility - Same house 1 year ago (%) - White
Geographical mobility - Same house 1 year ago (%) - Black or African American
Geographical mobility - Same house 1 year ago (%) - Asian
Geographical mobility - Same house 1 year ago (%) - Hispanic or Latino
Geographical mobility - Same house 1 year ago (%) - American Indian and Alaska Native
Geographical mobility - Same house 1 year ago (%) - Multirace
Geographical mobility - Same house 1 year ago (%) - Other Race
Geographical mobility - Moved within same county (%)
Geographical mobility - Moved within same county (%) - White
Geographical mobility - Moved within same county (%) - Black or African American
Geographical mobility - Moved within same county (%) - Asian
Geographical mobility - Moved within same county (%) - Hispanic or Latino
Geographical mobility - Moved within same county (%) - American Indian and Alaska Native
Geographical mobility - Moved within same county (%) - Multirace
Geographical mobility - Moved within same county (%) - Other Race
Geographical mobility - Moved from different county within same state (%)
Geographical mobility - Moved from different county within same state (%) - White
Geographical mobility - Moved from different county within same state (%) - Black or African American
Geographical mobility - Moved from different county within same state (%) - Asian
Geographical mobility - Moved from different county within same state (%) - Hispanic or Latino
Geographical mobility - Moved from different county within same state (%) - American Indian and Alaska Native
Geographical mobility - Moved from different county within same state (%) - Multirace
Geographical mobility - Moved from different county within same state (%) - Other Race
Geographical mobility - Moved from different state (%)
Geographical mobility - Moved from different state (%) - White
Geographical mobility - Moved from different state (%) - Black or African American
Geographical mobility - Moved from different state (%) - Asian
Geographical mobility - Moved from different state (%) - Hispanic or Latino
Geographical mobility - Moved from different state (%) - American Indian and Alaska Native
Geographical mobility - Moved from different state (%) - Multirace
Geographical mobility - Moved from different state (%) - Other Race
Geographical mobility - Moved from abroad (%)
Geographical mobility - Moved from abroad (%) - White
Geographical mobility - Moved from abroad (%) - Black or African American
Geographical mobility - Moved from abroad (%) - Asian
Geographical mobility - Moved from abroad (%) - Hispanic or Latino
Geographical mobility - Moved from abroad (%) - American Indian and Alaska Native
Geographical mobility - Moved from abroad (%) - Multirace
Geographical mobility - Moved from abroad (%) - Other Race
Place of birth for the foreign-born population - Ireland (%)
Place of birth for the foreign-born population - Denmark (%)
Place of birth for the foreign-born population - Norway (%)
Place of birth for the foreign-born population - Sweden (%)
Place of birth for the foreign-born population - United Kingdom (%)
Place of birth for the foreign-born population - England (%)
Place of birth for the foreign-born population - Scotland (%)
Place of birth for the foreign-born population - Other Northern Europe (%)
Place of birth for the foreign-born population - Austria (%)
Place of birth for the foreign-born population - Belgium (%)
Place of birth for the foreign-born population - France (%)
Place of birth for the foreign-born population - Germany (%)
Place of birth for the foreign-born population - Netherlands (%)
Place of birth for the foreign-born population - Switzerland (%)
Place of birth for the foreign-born population - Other Western Europe (%)
Place of birth for the foreign-born population - Greece (%)
Place of birth for the foreign-born population - Italy (%)
Place of birth for the foreign-born population - Portugal (%)
Place of birth for the foreign-born population - Spain (%)
Place of birth for the foreign-born population - Other Southern Europe (%)
Place of birth for the foreign-born population - Albania (%)
Place of birth for the foreign-born population - Belarus (%)
Place of birth for the foreign-born population - Bosnia and Herzegovina (%)
Place of birth for the foreign-born population - Bulgaria (%)
Place of birth for the foreign-born population - Croatia (%)
Place of birth for the foreign-born population - Czechoslovakia (%)
Place of birth for the foreign-born population - Hungary (%)
Place of birth for the foreign-born population - Latvia (%)
Place of birth for the foreign-born population - Lithuania (%)
Place of birth for the foreign-born population - North Macedonia (Macedonia) (%)
Place of birth for the foreign-born population - Moldova (%)
Place of birth for the foreign-born population - Poland (%)
Place of birth for the foreign-born population - Romania (%)
Place of birth for the foreign-born population - Russia (%)
Place of birth for the foreign-born population - Serbia (%)
Place of birth for the foreign-born population - Ukraine (%)
Place of birth for the foreign-born population - Other Eastern Europe (%)
Place of birth for the foreign-born population - China (%)
Place of birth for the foreign-born population - Hong Kong (%)
Place of birth for the foreign-born population - Taiwan (%)
Place of birth for the foreign-born population - Japan (%)
Place of birth for the foreign-born population - Korea (%)
Place of birth for the foreign-born population - Other Eastern Asia (%)
Place of birth for the foreign-born population - Afghanistan (%)
Place of birth for the foreign-born population - Bangladesh (%)
Place of birth for the foreign-born population - India (%)
Place of birth for the foreign-born population - Iran (%)
Place of birth for the foreign-born population - Kazakhstan (%)
Place of birth for the foreign-born population - Nepal (%)
Place of birth for the foreign-born population - Pakistan (%)
Place of birth for the foreign-born population - Sri Lanka (%)
Place of birth for the foreign-born population - Uzbekistan (%)
Place of birth for the foreign-born population - Other South Central Asia (%)
Place of birth for the foreign-born population - Burma (%)
Place of birth for the foreign-born population - Cambodia (%)
Place of birth for the foreign-born population - Indonesia (%)
Place of birth for the foreign-born population - Laos (%)
Place of birth for the foreign-born population - Malaysia (%)
Place of birth for the foreign-born population - Philippines (%)
Place of birth for the foreign-born population - Singapore (%)
Place of birth for the foreign-born population - Thailand (%)
Place of birth for the foreign-born population - Vietnam (%)
Place of birth for the foreign-born population - Other South Eastern Asia (%)
Place of birth for the foreign-born population - Armenia (%)
Place of birth for the foreign-born population - Iraq (%)
Place of birth for the foreign-born population - Israel (%)
Place of birth for the foreign-born population - Jordan (%)
Place of birth for the foreign-born population - Kuwait (%)
Place of birth for the foreign-born population - Lebanon (%)
Place of birth for the foreign-born population - Saudi Arabia (%)
Place of birth for the foreign-born population - Syria (%)
Place of birth for the foreign-born population - Turkey (%)
Place of birth for the foreign-born population - Yemen (%)
Place of birth for the foreign-born population - Other Western Asia (%)
Place of birth for the foreign-born population - Eritrea (%)
Place of birth for the foreign-born population - Ethiopia (%)
Place of birth for the foreign-born population - Kenya (%)
Place of birth for the foreign-born population - Somalia (%)
Place of birth for the foreign-born population - Uganda (%)
Place of birth for the foreign-born population - Zimbabwe (%)
Place of birth for the foreign-born population - Other Eastern Africa (%)
Place of birth for the foreign-born population - Cameroon (%)
Place of birth for the foreign-born population - Congo (%)
Place of birth for the foreign-born population - Democratic Republic of Congo (Zaire) (%)
Place of birth for the foreign-born population - Other Middle Africa (%)
Place of birth for the foreign-born population - Egypt (%)
Place of birth for the foreign-born population - Morocco (%)
Place of birth for the foreign-born population - Sudan (%)
Place of birth for the foreign-born population - Other Northern Africa (%)
Place of birth for the foreign-born population - South Africa (%)
Place of birth for the foreign-born population - Other Southern Africa (%)
Place of birth for the foreign-born population - Cabo Verde (%)
Place of birth for the foreign-born population - Ghana (%)
Place of birth for the foreign-born population - Liberia (%)
Place of birth for the foreign-born population - Nigeria (%)
Place of birth for the foreign-born population - Senegal (%)
Place of birth for the foreign-born population - Sierra Leone (%)
Place of birth for the foreign-born population - Other Western Africa (%)
Place of birth for the foreign-born population - Australia (%)
Place of birth for the foreign-born population - New Zealand (%)
Place of birth for the foreign-born population - Fiji (%)
Place of birth for the foreign-born population - Micronesia (%)
Place of birth for the foreign-born population - Bahamas (%)
Place of birth for the foreign-born population - Barbados (%)
Place of birth for the foreign-born population - Cuba (%)
Place of birth for the foreign-born population - Dominica (%)
Place of birth for the foreign-born population - Dominican Republic (%)
Place of birth for the foreign-born population - Grenada (%)
Place of birth for the foreign-born population - Haiti (%)
Place of birth for the foreign-born population - Jamaica (%)
Place of birth for the foreign-born population - St. Vincent and the Grenadines (%)
Place of birth for the foreign-born population - Trinidad and Tobago (%)
Place of birth for the foreign-born population - West Indies (%)
Place of birth for the foreign-born population - Other Caribbean (%)
Place of birth for the foreign-born population - Belize (%)
Place of birth for the foreign-born population - Costa Rica (%)
Place of birth for the foreign-born population - El Salvador (%)
Place of birth for the foreign-born population - Guatemala (%)
Place of birth for the foreign-born population - Honduras (%)
Place of birth for the foreign-born population - Mexico (%)
Place of birth for the foreign-born population - Nicaragua (%)
Place of birth for the foreign-born population - Panama (%)
Place of birth for the foreign-born population - Other Central America (%)
Place of birth for the foreign-born population - Argentina (%)
Place of birth for the foreign-born population - Bolivia (%)
Place of birth for the foreign-born population - Brazil (%)
Place of birth for the foreign-born population - Chile (%)
Place of birth for the foreign-born population - Colombia (%)
Place of birth for the foreign-born population - Ecuador (%)
Place of birth for the foreign-born population - Guyana (%)
Place of birth for the foreign-born population - Peru (%)
Place of birth for the foreign-born population - Uruguay (%)
Place of birth for the foreign-born population - Venezuela (%)
Place of birth for the foreign-born population - Other South America (%)
Place of birth for the foreign-born population - Canada (%)
Place of birth for the foreign-born population - Other Northern America (%)
Place of birth for the foreign-born population - Other (%)
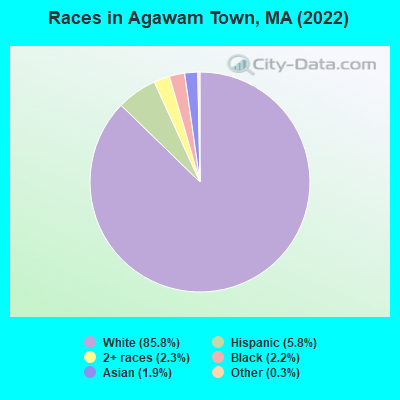
According to 2022 data, the most numerous races in Agawam Town, MA are White alone (24,357 residents), Hispanic (1,660 residents), and Asian alone (545 residents). 88.9% of Agawam Town residents speak English at home.
Race distribution in Agawam Town 24,357 85.8% White alone 1,660 5.8% Hispanic 641 2.3% Two or more races 633 2.2% Black alone 545 1.9% Asian alone 73 0.3% Other race alone
2000 2022
5,198,359 81.9% White alone 428,729 6.8% Hispanic 318,329 5.0% Black alone 236,786 3.7% Asian alone 110,338 1.7% Two or more races 43,586 0.7% Other race alone 11,264 0.2% American Indian alone 1,706 0.03% Native Hawaiian and Other
4,676,627 67.0% White alone 911,038 13.0% Hispanic 501,463 7.2% Asian alone 459,740 6.6% Black alone 341,889 4.9% Two or more races 84,403 1.2% Other race alone 5,838 0.08% American Indian alone 976 0.01% Native Hawaiian and Other
Income and house value in Agawam Town Median household income in 2022 $79,771 White non-Hispanic householders$55,472 Black householders$111,992 Asian householders$52,588 Some other race householders$82,261 Two or more races householders$59,131 Hispanic or Latino race householders
Median age by race in Agawam Town
49.7 Median age for White residents48.1 51.5 41.8 Median age for Black or African American residents48.5 39.5 -655,238,094.6 Median age for American Indian / Alaska Native residents-649,474,688.9 -657,223,795.4 38.9 Median age for Asian residents36.0 51.9 -514,227,641.8 Median age for Native Hawaiian / Pacific Islander residents-666,666,666.0 -508,717,948.2 31.6 Median age for Other race residents19.0 63.6 33.2 Median age for Two or more races residents29.6 38.3 48.9 Median age for White alone residents46.4 51.8 26.5 Median age for Hispanic or Latino residents30.2 15.5
Owner/renter occupied households by race in Agawam Town
House owners and renters - White residents 7,760 80.2% Owner occupied1,914 19.8% Renter occupiedHouse owners and renters - Black or African American residents 95 30.3% Owner occupied219 69.7% Renter occupiedHouse owners and renters - Asian residents 82 37.4% Owner occupied138 62.6% Renter occupiedHouse owners and renters - Other race residents 56 33.7% Owner occupied109 66.3% Renter occupiedHouse owners and renters - Two or more races residents 249 57.1% Owner occupied187 42.9% Renter occupiedHouse owners and renters - White alone residents 7,786 76.5% Owner occupied2,386 23.5% Renter occupiedHouse owners and renters - Hispanic or Latino residents 232 45.5% Owner occupied278 54.5% Renter occupied
Language usage in Agawam Town
English speakers - Total 88.9% of residents of Agawam Town speak English at home.
2.1% of residents speak Spanish at home 304 54.2% Speak English very well257 45.8% Speak English less than very well9.4% of residents speak other language at home 1,750 68.6% Speak English very well800 31.4% Speak English less than very well
English speakers - Born in the United States 98.1% of residents of Agawam Town speak English at home.
1.0% of residents speak Spanish at home 55 100.0% Speak English very well1.8% of residents speak other language at home 85 83.3% Speak English very well17 16.7% Speak English less than very well
English speakers - Native, born elsewhere 53.2% of residents of Agawam Town speak English at home.
47.0% of residents speak Spanish at home 147 71.7% Speak English very well58 28.3% Speak English less than very well9.6% of residents speak other language at home 42 100.0% Speak English very well
English speakers - Foreign-born 22.6% of residents of Agawam Town speak English at home.
7.0% of residents speak Spanish at home 14 8.8% Speak English very well146 91.2% Speak English less than very well68.9% of residents speak other language at home 850 53.8% Speak English very well730 46.2% Speak English less than very well
White (Caucasian) - Speak only English Native:
100.0% (20,635)Foreign-born:
15.9% (211)
White (Caucasian) - Speak another language Native:
2.3% (484)Foreign-born:
84.6% (1,121)
Black or African American - Speak only English Native:
95.1% (476)Foreign-born:
79.8% (116)
Black or African American - Speak another language Native:
5.9% (30)Foreign-born:
20.7% (30)
Asian - Speak only English Native:
59.4% (41)Foreign-born:
19.8% (87)
Asian - Speak another language Native:
40.9% (28)Foreign-born:
80.0% (352)
Other race - Speak another language Native:
28.6% (99)Foreign-born:
88.0% (54)
Two or more races - Speak only English Native:
73.8% (764)Foreign-born:
40.7% (111)
Two or more races - Speak another language Native:
22.9% (237)Foreign-born:
60.2% (164)
White alone - Speak only English Native:
95.7% (21,112)Foreign-born:
15.5% (222)
White alone - Speak another language Native:
4.4% (964)Foreign-born:
85.4% (1,224)
Hispanic or Latino - Speak only English Native:
72.5% (870)Foreign-born:
28.4% (69)
Hispanic or Latino - Speak another language Native:
34.0% (408)Foreign-born:
75.0% (181)
Foreign-born residents in Agawam Town
Marital status for residents in Agawam Town Marital status - White (Caucasian) population 15 years and over
Males 33.9% Never married52.1% Now married1.1% Separated3.3% Widowed9.6% DivorcedFemales 28.4% Never married48.4% Now married1.2% Separated9.0% Widowed13.0% DivorcedWomen who gave birth in the past 12 months Now married:
59.3% (70)Unmarried:
40.7% (48)
Women who did not give birth in the past 12 months Now married:
43.1% (1,861)Unmarried:
56.9% (2,457)
Marital status - Black or African American population 15 years and over
Males 59.6% Never married32.5% Now married0.0% Separated0.0% Widowed7.9% DivorcedFemales 25.1% Never married39.0% Now married0.0% Separated13.8% Widowed22.1% DivorcedWomen who gave birth in the past 12 months Now married:
0.0% (0)Unmarried:
100.0% (9)
Women who did not give birth in the past 12 months Now married:
49.5% (53)Unmarried:
50.5% (54)
Marital status - Asian population 15 years and over
Males 45.3% Never married51.1% Now married0.0% Separated3.6% Widowed0.0% DivorcedFemales 21.7% Never married61.7% Now married0.0% Separated0.0% Widowed16.5% DivorcedWomen who did not give birth in the past 12 months Now married:
60.3% (78)Unmarried:
39.7% (51)
Marital status - Other race population 15 years and over
Males 66.9% Never married33.1% Now married0.0% Separated0.0% Widowed0.0% DivorcedFemales 15.3% Never married36.0% Now married40.5% Separated8.1% Widowed0.0% DivorcedWomen who gave birth in the past 12 months Now married:
100.0% (16)Unmarried:
0.0% (0)
Women who did not give birth in the past 12 months Now married:
5.6% (1)Unmarried:
94.4% (23)
Marital status - Two or more races population 15 years and over
Males 35.7% Never married48.8% Now married0.0% Separated0.0% Widowed15.6% DivorcedFemales 27.6% Never married28.6% Now married8.2% Separated7.2% Widowed28.4% DivorcedWomen who gave birth in the past 12 months Now married:
22.8% (21)Unmarried:
77.2% (70)
Women who did not give birth in the past 12 months Now married:
39.5% (146)Unmarried:
60.5% (224)
Marital status - White alone, not Hispanic / Latino population 15 years and over
Males 34.3% Never married51.5% Now married1.1% Separated3.4% Widowed9.8% DivorcedFemales 28.2% Never married48.3% Now married1.1% Separated9.2% Widowed13.1% DivorcedWomen who gave birth in the past 12 months Now married:
59.3% (80)Unmarried:
40.7% (55)
Women who did not give birth in the past 12 months Now married:
43.1% (2,060)Unmarried:
56.9% (2,722)
Marital status - Hispanic or Latino population 15 years and over
Males 28.7% Never married65.4% Now married0.0% Separated0.0% Widowed5.9% DivorcedFemales 32.5% Never married42.6% Now married11.3% Separated5.4% Widowed8.2% DivorcedWomen who gave birth in the past 12 months Now married:
57.1% (12)Unmarried:
42.9% (9)
Women who did not give birth in the past 12 months Now married:
44.6% (143)Unmarried:
55.4% (177)
Ancestries in Agawam Town
2,352 17.5% American1,858 13.9% Italian1,416 10.6% Irish1,041 7.8% French Canadian782 5.8% Polish648 4.8% French641 4.8% English490 3.7% Russian365 2.7% Ukrainian301 2.2% German199 1.5% Portuguese171 1.3% Lebanese137 1.0% Turkish135 1.0% European102 0.8% Jamaican75 0.6% Canadian74 0.6% Nigerian50 0.4% Eastern European47 0.4% Swiss41 0.3% Greek41 0.3% Scottish34 0.3% Brazilian33 0.2% Scotch-Irish28 0.2% Albanian28 0.2% Romanian18 0.1% Slovak17 0.1% Senegalese16 0.1% Finnish14 0.1% British13 0.10% Hungarian13 0.10% Welsh12 0.09% Scandinavian11 0.08% Norwegian10 0.07% Ghanaian9 0.07% Armenian6 0.04% Danish6 0.04% Trinidadian and Tobagonian5 0.04% Kenyan3 0.02% Liberian
Children Nativity (place of birth) in Agawam Town
Children under 6 years - Living with two parents Both parents native 681 100.0% NativeBoth parents foreign-born 200 100.0% NativeOne native, one foreign-born parent 95 100.0% NativeChildren under 6 years - Living with one parent Native parent 418 100.0% NativeChildren 6 to 17 years - Living with two parents Both parents native 2,149 99.3% Native15 0.7% Foreign-bornBoth parents foreign-born 198 79.1% Native52 20.9% Foreign-bornOne native, one foreign-born parent 150 100.0% NativeChildren 6 to 17 years - Living with one parent Native parent 796 100.0% NativeForeign-born parent 44 50.6% Native43 49.4% Foreign-born
Grandparents responsible for own grandchildren in Agawam Town
Grandparents (30 to 59 years) White / Caucasian 19 55.4% Responsible for grandchildren15 44.6% Not responsible for grandchildrenWhite alone, not Hispanic / Latino 31 56.1% Responsible for grandchildren25 43.9% Not responsible for grandchildrenGrandparents (60 years and over) White / Caucasian 88 25.8% Responsible for grandchildren254 74.2% Not responsible for grandchildrenWhite alone, not Hispanic / Latino 83 23.8% Responsible for grandchildren268 76.2% Not responsible for grandchildren