Races in Amesbury Town, Massachusetts (MA) Detailed Stats
Data:
Races - White alone (%)
Races - White alone (% change since 2000)
Races - Black alone (%)
Races - Black alone (% change since 2000)
Races - American Indian alone (%)
Races - American Indian alone (% change since 2000)
Races - Asian alone (%)
Races - Asian alone (% change since 2000)
Races - Hispanic (%)
Races - Hispanic (% change since 2000)
Races - Native Hawaiian and Other Pacific Islander alone (%)
Races - Native Hawaiian and Other Pacific Islander alone (% change since 2000)
Races - Two or more races(%)
Races - Two or more races(% change since 2000)
Races - Other race alone (%)
Races - Other race alone (% change since 2000)
Racial diversity
Place of birth - Born in state of residence (%)
Place of birth - Born in state of residence (%) - White
Place of birth - Born in state of residence (%) - Black or African American
Place of birth - Born in state of residence (%) - Asian
Place of birth - Born in state of residence (%) - Hispanic or Latino
Place of birth - Born in state of residence (%) - American Indian and Alaska Native
Place of birth - Born in state of residence (%) - Multirace
Place of birth - Born in state of residence (%) - Other Race
Place of birth - Born in other state (%)
Place of birth - Born in other state (%) - White
Place of birth - Born in other state (%) - Black or African American
Place of birth - Born in other state (%) - Asian
Place of birth - Born in other state (%) - Hispanic or Latino
Place of birth - Born in other state (%) - American Indian and Alaska Native
Place of birth - Born in other state (%) - Multirace
Place of birth - Born in other state (%) - Other Race
Place of birth - Native, outside of US (%)
Place of birth - Native, outside of US (%) - White
Place of birth - Native, outside of US (%) - Black or African American
Place of birth - Native, outside of US (%) - Asian
Place of birth - Native, outside of US (%) - Hispanic or Latino
Place of birth - Native, outside of US (%) - American Indian and Alaska Native
Place of birth - Native, outside of US (%) - Multirace
Place of birth - Native, outside of US (%) - Other Race
Place of birth - Foreign born (%)
Place of birth - Foreign born (%) - White
Place of birth - Foreign born (%) - Black or African American
Place of birth - Foreign born (%) - Asian
Place of birth - Foreign born (%) - Hispanic or Latino
Place of birth - Foreign born (%) - American Indian and Alaska Native
Place of birth - Foreign born (%) - Multirace
Place of birth - Foreign born (%) - Other Race
Residents speaking English at home (%)
Residents speaking English at home - Born in the United States (%)
Residents speaking English at home - Native, born elsewhere (%)
Residents speaking English at home - Foreign born (%)
Residents speaking Spanish at home (%)
Residents speaking Spanish at home - Born in the United States (%)
Residents speaking Spanish at home - Native, born elsewhere (%)
Residents speaking Spanish at home - Foreign born (%)
Residents speaking other language at home (%)
Residents speaking other language at home - Born in the United States (%)
Residents speaking other language at home - Native, born elsewhere (%)
Residents speaking other language at home - Foreign born (%)
Marital status - Never married (%)
Marital status - Now married (%)
Marital status - Separated (%)
Marital status - Widowed (%)
Marital status - Divorced (%)
Ancestries Reported - Arab (%)
Ancestries Reported - Czech (%)
Ancestries Reported - Danish (%)
Ancestries Reported - Dutch (%)
Ancestries Reported - English (%)
Ancestries Reported - French (%)
Ancestries Reported - French Canadian (%)
Ancestries Reported - German (%)
Ancestries Reported - Greek (%)
Ancestries Reported - Hungarian (%)
Ancestries Reported - Irish (%)
Ancestries Reported - Italian (%)
Ancestries Reported - Lithuanian (%)
Ancestries Reported - Norwegian (%)
Ancestries Reported - Polish (%)
Ancestries Reported - Portuguese (%)
Ancestries Reported - Russian (%)
Ancestries Reported - Scotch-Irish (%)
Ancestries Reported - Scottish (%)
Ancestries Reported - Slovak (%)
Ancestries Reported - Subsaharan African (%)
Ancestries Reported - Swedish (%)
Ancestries Reported - Swiss (%)
Ancestries Reported - Ukrainian (%)
Ancestries Reported - United States (%)
Ancestries Reported - Welsh (%)
Ancestries Reported - West Indian (%)
Ancestries Reported - Other (%)
Geographical mobility - Same house 1 year ago (%)
Geographical mobility - Same house 1 year ago (%) - White
Geographical mobility - Same house 1 year ago (%) - Black or African American
Geographical mobility - Same house 1 year ago (%) - Asian
Geographical mobility - Same house 1 year ago (%) - Hispanic or Latino
Geographical mobility - Same house 1 year ago (%) - American Indian and Alaska Native
Geographical mobility - Same house 1 year ago (%) - Multirace
Geographical mobility - Same house 1 year ago (%) - Other Race
Geographical mobility - Moved within same county (%)
Geographical mobility - Moved within same county (%) - White
Geographical mobility - Moved within same county (%) - Black or African American
Geographical mobility - Moved within same county (%) - Asian
Geographical mobility - Moved within same county (%) - Hispanic or Latino
Geographical mobility - Moved within same county (%) - American Indian and Alaska Native
Geographical mobility - Moved within same county (%) - Multirace
Geographical mobility - Moved within same county (%) - Other Race
Geographical mobility - Moved from different county within same state (%)
Geographical mobility - Moved from different county within same state (%) - White
Geographical mobility - Moved from different county within same state (%) - Black or African American
Geographical mobility - Moved from different county within same state (%) - Asian
Geographical mobility - Moved from different county within same state (%) - Hispanic or Latino
Geographical mobility - Moved from different county within same state (%) - American Indian and Alaska Native
Geographical mobility - Moved from different county within same state (%) - Multirace
Geographical mobility - Moved from different county within same state (%) - Other Race
Geographical mobility - Moved from different state (%)
Geographical mobility - Moved from different state (%) - White
Geographical mobility - Moved from different state (%) - Black or African American
Geographical mobility - Moved from different state (%) - Asian
Geographical mobility - Moved from different state (%) - Hispanic or Latino
Geographical mobility - Moved from different state (%) - American Indian and Alaska Native
Geographical mobility - Moved from different state (%) - Multirace
Geographical mobility - Moved from different state (%) - Other Race
Geographical mobility - Moved from abroad (%)
Geographical mobility - Moved from abroad (%) - White
Geographical mobility - Moved from abroad (%) - Black or African American
Geographical mobility - Moved from abroad (%) - Asian
Geographical mobility - Moved from abroad (%) - Hispanic or Latino
Geographical mobility - Moved from abroad (%) - American Indian and Alaska Native
Geographical mobility - Moved from abroad (%) - Multirace
Geographical mobility - Moved from abroad (%) - Other Race
Place of birth for the foreign-born population - Ireland (%)
Place of birth for the foreign-born population - Denmark (%)
Place of birth for the foreign-born population - Norway (%)
Place of birth for the foreign-born population - Sweden (%)
Place of birth for the foreign-born population - United Kingdom (%)
Place of birth for the foreign-born population - England (%)
Place of birth for the foreign-born population - Scotland (%)
Place of birth for the foreign-born population - Other Northern Europe (%)
Place of birth for the foreign-born population - Austria (%)
Place of birth for the foreign-born population - Belgium (%)
Place of birth for the foreign-born population - France (%)
Place of birth for the foreign-born population - Germany (%)
Place of birth for the foreign-born population - Netherlands (%)
Place of birth for the foreign-born population - Switzerland (%)
Place of birth for the foreign-born population - Other Western Europe (%)
Place of birth for the foreign-born population - Greece (%)
Place of birth for the foreign-born population - Italy (%)
Place of birth for the foreign-born population - Portugal (%)
Place of birth for the foreign-born population - Spain (%)
Place of birth for the foreign-born population - Other Southern Europe (%)
Place of birth for the foreign-born population - Albania (%)
Place of birth for the foreign-born population - Belarus (%)
Place of birth for the foreign-born population - Bosnia and Herzegovina (%)
Place of birth for the foreign-born population - Bulgaria (%)
Place of birth for the foreign-born population - Croatia (%)
Place of birth for the foreign-born population - Czechoslovakia (%)
Place of birth for the foreign-born population - Hungary (%)
Place of birth for the foreign-born population - Latvia (%)
Place of birth for the foreign-born population - Lithuania (%)
Place of birth for the foreign-born population - North Macedonia (Macedonia) (%)
Place of birth for the foreign-born population - Moldova (%)
Place of birth for the foreign-born population - Poland (%)
Place of birth for the foreign-born population - Romania (%)
Place of birth for the foreign-born population - Russia (%)
Place of birth for the foreign-born population - Serbia (%)
Place of birth for the foreign-born population - Ukraine (%)
Place of birth for the foreign-born population - Other Eastern Europe (%)
Place of birth for the foreign-born population - China (%)
Place of birth for the foreign-born population - Hong Kong (%)
Place of birth for the foreign-born population - Taiwan (%)
Place of birth for the foreign-born population - Japan (%)
Place of birth for the foreign-born population - Korea (%)
Place of birth for the foreign-born population - Other Eastern Asia (%)
Place of birth for the foreign-born population - Afghanistan (%)
Place of birth for the foreign-born population - Bangladesh (%)
Place of birth for the foreign-born population - India (%)
Place of birth for the foreign-born population - Iran (%)
Place of birth for the foreign-born population - Kazakhstan (%)
Place of birth for the foreign-born population - Nepal (%)
Place of birth for the foreign-born population - Pakistan (%)
Place of birth for the foreign-born population - Sri Lanka (%)
Place of birth for the foreign-born population - Uzbekistan (%)
Place of birth for the foreign-born population - Other South Central Asia (%)
Place of birth for the foreign-born population - Burma (%)
Place of birth for the foreign-born population - Cambodia (%)
Place of birth for the foreign-born population - Indonesia (%)
Place of birth for the foreign-born population - Laos (%)
Place of birth for the foreign-born population - Malaysia (%)
Place of birth for the foreign-born population - Philippines (%)
Place of birth for the foreign-born population - Singapore (%)
Place of birth for the foreign-born population - Thailand (%)
Place of birth for the foreign-born population - Vietnam (%)
Place of birth for the foreign-born population - Other South Eastern Asia (%)
Place of birth for the foreign-born population - Armenia (%)
Place of birth for the foreign-born population - Iraq (%)
Place of birth for the foreign-born population - Israel (%)
Place of birth for the foreign-born population - Jordan (%)
Place of birth for the foreign-born population - Kuwait (%)
Place of birth for the foreign-born population - Lebanon (%)
Place of birth for the foreign-born population - Saudi Arabia (%)
Place of birth for the foreign-born population - Syria (%)
Place of birth for the foreign-born population - Turkey (%)
Place of birth for the foreign-born population - Yemen (%)
Place of birth for the foreign-born population - Other Western Asia (%)
Place of birth for the foreign-born population - Eritrea (%)
Place of birth for the foreign-born population - Ethiopia (%)
Place of birth for the foreign-born population - Kenya (%)
Place of birth for the foreign-born population - Somalia (%)
Place of birth for the foreign-born population - Uganda (%)
Place of birth for the foreign-born population - Zimbabwe (%)
Place of birth for the foreign-born population - Other Eastern Africa (%)
Place of birth for the foreign-born population - Cameroon (%)
Place of birth for the foreign-born population - Congo (%)
Place of birth for the foreign-born population - Democratic Republic of Congo (Zaire) (%)
Place of birth for the foreign-born population - Other Middle Africa (%)
Place of birth for the foreign-born population - Egypt (%)
Place of birth for the foreign-born population - Morocco (%)
Place of birth for the foreign-born population - Sudan (%)
Place of birth for the foreign-born population - Other Northern Africa (%)
Place of birth for the foreign-born population - South Africa (%)
Place of birth for the foreign-born population - Other Southern Africa (%)
Place of birth for the foreign-born population - Cabo Verde (%)
Place of birth for the foreign-born population - Ghana (%)
Place of birth for the foreign-born population - Liberia (%)
Place of birth for the foreign-born population - Nigeria (%)
Place of birth for the foreign-born population - Senegal (%)
Place of birth for the foreign-born population - Sierra Leone (%)
Place of birth for the foreign-born population - Other Western Africa (%)
Place of birth for the foreign-born population - Australia (%)
Place of birth for the foreign-born population - New Zealand (%)
Place of birth for the foreign-born population - Fiji (%)
Place of birth for the foreign-born population - Micronesia (%)
Place of birth for the foreign-born population - Bahamas (%)
Place of birth for the foreign-born population - Barbados (%)
Place of birth for the foreign-born population - Cuba (%)
Place of birth for the foreign-born population - Dominica (%)
Place of birth for the foreign-born population - Dominican Republic (%)
Place of birth for the foreign-born population - Grenada (%)
Place of birth for the foreign-born population - Haiti (%)
Place of birth for the foreign-born population - Jamaica (%)
Place of birth for the foreign-born population - St. Vincent and the Grenadines (%)
Place of birth for the foreign-born population - Trinidad and Tobago (%)
Place of birth for the foreign-born population - West Indies (%)
Place of birth for the foreign-born population - Other Caribbean (%)
Place of birth for the foreign-born population - Belize (%)
Place of birth for the foreign-born population - Costa Rica (%)
Place of birth for the foreign-born population - El Salvador (%)
Place of birth for the foreign-born population - Guatemala (%)
Place of birth for the foreign-born population - Honduras (%)
Place of birth for the foreign-born population - Mexico (%)
Place of birth for the foreign-born population - Nicaragua (%)
Place of birth for the foreign-born population - Panama (%)
Place of birth for the foreign-born population - Other Central America (%)
Place of birth for the foreign-born population - Argentina (%)
Place of birth for the foreign-born population - Bolivia (%)
Place of birth for the foreign-born population - Brazil (%)
Place of birth for the foreign-born population - Chile (%)
Place of birth for the foreign-born population - Colombia (%)
Place of birth for the foreign-born population - Ecuador (%)
Place of birth for the foreign-born population - Guyana (%)
Place of birth for the foreign-born population - Peru (%)
Place of birth for the foreign-born population - Uruguay (%)
Place of birth for the foreign-born population - Venezuela (%)
Place of birth for the foreign-born population - Other South America (%)
Place of birth for the foreign-born population - Canada (%)
Place of birth for the foreign-born population - Other Northern America (%)
Place of birth for the foreign-born population - Other (%)
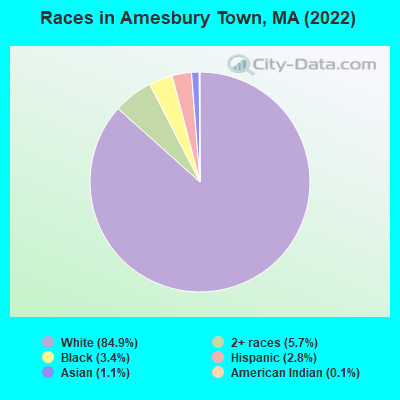
According to 2022 data, the most numerous races in Amesbury Town, MA are White alone (14,684 residents), Hispanic (490 residents), and Asian alone (185 residents). 92.2% of Amesbury Town residents speak English at home.
Race distribution in Amesbury Town 14,684 84.9% White alone 992 5.7% Two or more races 596 3.4% Black alone 490 2.8% Hispanic 185 1.1% Asian alone 22 0.1% American Indian alone
2000 2022
5,198,359 81.9% White alone 428,729 6.8% Hispanic 318,329 5.0% Black alone 236,786 3.7% Asian alone 110,338 1.7% Two or more races 43,586 0.7% Other race alone 11,264 0.2% American Indian alone 1,706 0.03% Native Hawaiian and Other
4,676,627 67.0% White alone 911,038 13.0% Hispanic 501,463 7.2% Asian alone 459,740 6.6% Black alone 341,889 4.9% Two or more races 84,403 1.2% Other race alone 5,838 0.08% American Indian alone 976 0.01% Native Hawaiian and Other
Income and house value in Amesbury Town Median household income in 2022 $91,717 White non-Hispanic householders$86,748 Asian householders$103,219 Two or more races householders
Median age by race in Amesbury Town
48.2 Median age for White residents46.6 49.3 38.4 Median age for Black or African American residents27.0 40.1 -713,541,666.0 Median age for American Indian / Alaska Native residents-679,156,908.0 -364,551,862.7 28.1 Median age for Asian residents22.4 28.1 -514,227,641.8 Median age for Native Hawaiian / Pacific Islander residents-666,666,666.0 -508,717,948.2 37.9 Median age for Other race residents10.8 40.5 42.5 Median age for Two or more races residents38.5 49.5 47.6 Median age for White alone residents45.8 49.1 31.3 Median age for Hispanic or Latino residents19.8 39.1
Owner/renter occupied households by race in Amesbury Town
House owners and renters - White residents 4,861 73.7% Owner occupied1,730 26.3% Renter occupiedHouse owners and renters - Black or African American residents 194 100.0% Renter occupiedHouse owners and renters - American Indian / Alaska Native residents 17 100.0% Owner occupiedHouse owners and renters - Asian residents 7 13.9% Owner occupied41 86.1% Renter occupiedHouse owners and renters - Other race residents 110 100.0% Renter occupiedHouse owners and renters - Two or more races residents 264 54.7% Owner occupied219 45.3% Renter occupiedHouse owners and renters - White alone residents 4,904 72.3% Owner occupied1,882 27.7% Renter occupiedHouse owners and renters - Hispanic or Latino residents 60 37.9% Owner occupied99 62.1% Renter occupied
Language usage in Amesbury Town
English speakers - Total 92.2% of residents of Amesbury Town speak English at home.
2.0% of residents speak Spanish at home 166 49.7% Speak English very well168 50.3% Speak English less than very well4.3% of residents speak other language at home 564 80.1% Speak English very well140 19.9% Speak English less than very well
English speakers - Born in the United States 98.1% of residents of Amesbury Town speak English at home.
1.3% of residents speak Spanish at home 51 100.0% Speak English very well0.8% of residents speak other language at home 32 100.0% Speak English very well
English speakers - Native, born elsewhere 65.5% of residents of Amesbury Town speak English at home.
43.5% of residents speak Spanish at home 47 42.3% Speak English very well64 57.7% Speak English less than very well
English speakers - Foreign-born 52.4% of residents of Amesbury Town speak English at home.
7.5% of residents speak Spanish at home 37 36.6% Speak English very well64 63.4% Speak English less than very well35.5% of residents speak other language at home 342 71.2% Speak English very well138 28.8% Speak English less than very well
White (Caucasian) - Speak only English Native:
99.7% (13,295)Foreign-born:
74.1% (384)
White (Caucasian) - Speak another language Native:
1.3% (175)Foreign-born:
31.1% (161)
Black or African American - Speak only English Native:
100.0% (141)Foreign-born:
32.4% (101)
Asian - Speak only English Native:
39.8% (8)Foreign-born:
62.7% (99)
Asian - Speak another language Native:
56.7% (11)Foreign-born:
26.1% (41)
Other race - Speak only English Native:
21.7% (42)Foreign-born:
23.6% (9)
Other race - Speak another language Native:
77.7% (149)Foreign-born:
77.2% (30)
Two or more races - Speak only English Native:
88.0% (893)Foreign-born:
14.2% (11)
Two or more races - Speak another language Native:
6.9% (70)Foreign-born:
87.5% (65)
White alone - Speak only English Native:
98.2% (13,396)Foreign-born:
71.0% (421)
White alone - Speak another language Native:
1.7% (236)Foreign-born:
27.3% (162)
Hispanic or Latino - Speak only English Native:
38.1% (106)Foreign-born:
18.5% (24)
Hispanic or Latino - Speak another language Native:
62.3% (174)Foreign-born:
82.4% (105)
Foreign-born residents in Amesbury Town
Marital status for residents in Amesbury Town Marital status - White (Caucasian) population 15 years and over
Males 32.5% Never married50.4% Now married1.8% Separated3.0% Widowed12.3% DivorcedFemales 29.5% Never married42.2% Now married2.3% Separated10.1% Widowed15.9% DivorcedWomen who gave birth in the past 12 months Now married:
67.8% (89)Unmarried:
32.2% (42)
Women who did not give birth in the past 12 months Now married:
37.3% (1,095)Unmarried:
62.7% (1,843)
Marital status - Black or African American population 15 years and over
Males 20.8% Never married79.2% Now married0.0% Separated0.0% Widowed0.0% DivorcedFemales 40.8% Never married59.2% Now married0.0% Separated0.0% Widowed0.0% DivorcedWomen who did not give birth in the past 12 months Now married:
59.9% (91)Unmarried:
40.1% (61)
Marital status - Asian population 15 years and over
Males 80.9% Never married19.1% Now married0.0% Separated0.0% Widowed0.0% DivorcedFemales 54.8% Never married40.9% Now married0.0% Separated4.3% Widowed0.0% DivorcedWomen who gave birth in the past 12 months Now married:
100.0% (6)Unmarried:
0.0% (0)
Women who did not give birth in the past 12 months Now married:
35.1% (36)Unmarried:
64.9% (66)
Marital status - Other race population 15 years and over
Males 28.6% Never married71.4% Now married0.0% Separated0.0% Widowed0.0% DivorcedFemales 11.1% Never married17.6% Now married71.3% Separated0.0% Widowed0.0% DivorcedWomen who gave birth in the past 12 months Now married:
100.0% (15)Unmarried:
0.0% (0)
Women who did not give birth in the past 12 months Now married:
100.0% (98)Unmarried:
0.0% (0)
Marital status - Two or more races population 15 years and over
Males 53.1% Never married32.5% Now married0.0% Separated5.5% Widowed9.0% DivorcedFemales 75.7% Never married17.7% Now married0.0% Separated0.0% Widowed6.6% DivorcedWomen who did not give birth in the past 12 months Now married:
5.8% (17)Unmarried:
94.2% (280)
Marital status - White alone, not Hispanic / Latino population 15 years and over
Males 32.6% Never married50.3% Now married1.8% Separated3.0% Widowed12.3% DivorcedFemales 29.7% Never married42.1% Now married2.3% Separated10.2% Widowed15.8% DivorcedWomen who gave birth in the past 12 months Now married:
67.8% (93)Unmarried:
32.2% (44)
Women who did not give birth in the past 12 months Now married:
37.0% (1,141)Unmarried:
63.0% (1,941)
Marital status - Hispanic or Latino population 15 years and over
Males 41.5% Never married47.5% Now married0.0% Separated0.0% Widowed11.0% DivorcedFemales 16.6% Never married30.8% Now married45.6% Separated0.0% Widowed7.1% DivorcedWomen who gave birth in the past 12 months Now married:
100.0% (13)Unmarried:
0.0% (0)
Women who did not give birth in the past 12 months Now married:
89.7% (101)Unmarried:
10.3% (12)
Ancestries in Amesbury Town
1,312 20.0% Irish828 12.6% English412 6.3% French Canadian351 5.4% European323 4.9% Italian321 4.9% Polish262 4.0% American197 3.0% German193 2.9% African180 2.7% French171 2.6% Haitian162 2.5% Greek109 1.7% Moroccan103 1.6% Scottish92 1.4% Canadian83 1.3% Scandinavian55 0.8% Swedish47 0.7% Dutch40 0.6% Norwegian39 0.6% Portuguese23 0.4% Ukrainian22 0.3% Russian20 0.3% Hungarian20 0.3% Scotch-Irish17 0.3% British17 0.3% West Indian13 0.2% Bulgarian12 0.2% Lebanese12 0.2% Lithuanian11 0.2% Armenian11 0.2% Czech10 0.2% Slovak10 0.2% Croatian7 0.1% Welsh6 0.09% Eastern European1 0.02% Celtic
Children Nativity (place of birth) in Amesbury Town
Children under 6 years - Living with two parents Both parents native 374 100.0% NativeBoth parents foreign-born 162 100.0% NativeOne native, one foreign-born parent 59 100.0% NativeChildren under 6 years - Living with one parent Native parent 251 100.0% NativeChildren 6 to 17 years - Living with two parents Both parents native 801 100.0% NativeBoth parents foreign-born 91 81.6% Native20 18.4% Foreign-bornOne native, one foreign-born parent 149 86.9% Native22 13.1% Foreign-bornChildren 6 to 17 years - Living with one parent Native parent 860 100.0% NativeForeign-born parent 264 48.5% Native280 51.5% Foreign-born
Grandparents responsible for own grandchildren in Amesbury Town
Grandparents (30 to 59 years) White / Caucasian 6 43.8% Responsible for grandchildren8 56.2% Not responsible for grandchildrenWhite alone, not Hispanic / Latino 4 31.1% Responsible for grandchildren10 68.9% Not responsible for grandchildrenGrandparents (60 years and over) White / Caucasian 27 29.5% Responsible for grandchildren64 70.5% Not responsible for grandchildrenWhite alone, not Hispanic / Latino 31 31.5% Responsible for grandchildren67 68.5% Not responsible for grandchildren