Races in Anderson, South Carolina (SC) Detailed Stats
Data:
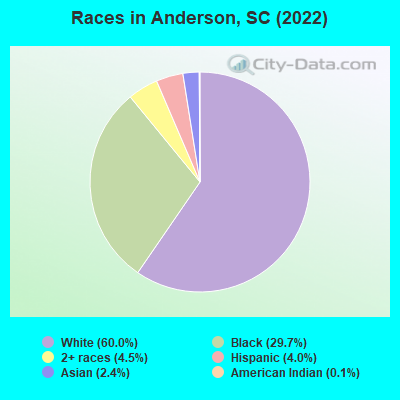
Races - White alone (%)
Races - White alone (% change since 2000)
Races - Black alone (%)
Races - Black alone (% change since 2000)
Races - American Indian alone (%)
Races - American Indian alone (% change since 2000)
Races - Asian alone (%)
Races - Asian alone (% change since 2000)
Races - Hispanic (%)
Races - Hispanic (% change since 2000)
Races - Native Hawaiian and Other Pacific Islander alone (%)
Races - Native Hawaiian and Other Pacific Islander alone (% change since 2000)
Races - Two or more races(%)
Races - Two or more races(% change since 2000)
Races - Other race alone (%)
Races - Other race alone (% change since 2000)
Racial diversity
Place of birth - Born in state of residence (%)
Place of birth - Born in state of residence (%) - White
Place of birth - Born in state of residence (%) - Black or African American
Place of birth - Born in state of residence (%) - Asian
Place of birth - Born in state of residence (%) - Hispanic or Latino
Place of birth - Born in state of residence (%) - American Indian and Alaska Native
Place of birth - Born in state of residence (%) - Multirace
Place of birth - Born in state of residence (%) - Other Race
Place of birth - Born in other state (%)
Place of birth - Born in other state (%) - White
Place of birth - Born in other state (%) - Black or African American
Place of birth - Born in other state (%) - Asian
Place of birth - Born in other state (%) - Hispanic or Latino
Place of birth - Born in other state (%) - American Indian and Alaska Native
Place of birth - Born in other state (%) - Multirace
Place of birth - Born in other state (%) - Other Race
Place of birth - Native, outside of US (%)
Place of birth - Native, outside of US (%) - White
Place of birth - Native, outside of US (%) - Black or African American
Place of birth - Native, outside of US (%) - Asian
Place of birth - Native, outside of US (%) - Hispanic or Latino
Place of birth - Native, outside of US (%) - American Indian and Alaska Native
Place of birth - Native, outside of US (%) - Multirace
Place of birth - Native, outside of US (%) - Other Race
Place of birth - Foreign born (%)
Place of birth - Foreign born (%) - White
Place of birth - Foreign born (%) - Black or African American
Place of birth - Foreign born (%) - Asian
Place of birth - Foreign born (%) - Hispanic or Latino
Place of birth - Foreign born (%) - American Indian and Alaska Native
Place of birth - Foreign born (%) - Multirace
Place of birth - Foreign born (%) - Other Race
Residents speaking English at home (%)
Residents speaking English at home - Born in the United States (%)
Residents speaking English at home - Native, born elsewhere (%)
Residents speaking English at home - Foreign born (%)
Residents speaking Spanish at home (%)
Residents speaking Spanish at home - Born in the United States (%)
Residents speaking Spanish at home - Native, born elsewhere (%)
Residents speaking Spanish at home - Foreign born (%)
Residents speaking other language at home (%)
Residents speaking other language at home - Born in the United States (%)
Residents speaking other language at home - Native, born elsewhere (%)
Residents speaking other language at home - Foreign born (%)
Marital status - Never married (%)
Marital status - Now married (%)
Marital status - Separated (%)
Marital status - Widowed (%)
Marital status - Divorced (%)
Ancestries Reported - Arab (%)
Ancestries Reported - Czech (%)
Ancestries Reported - Danish (%)
Ancestries Reported - Dutch (%)
Ancestries Reported - English (%)
Ancestries Reported - French (%)
Ancestries Reported - French Canadian (%)
Ancestries Reported - German (%)
Ancestries Reported - Greek (%)
Ancestries Reported - Hungarian (%)
Ancestries Reported - Irish (%)
Ancestries Reported - Italian (%)
Ancestries Reported - Lithuanian (%)
Ancestries Reported - Norwegian (%)
Ancestries Reported - Polish (%)
Ancestries Reported - Portuguese (%)
Ancestries Reported - Russian (%)
Ancestries Reported - Scotch-Irish (%)
Ancestries Reported - Scottish (%)
Ancestries Reported - Slovak (%)
Ancestries Reported - Subsaharan African (%)
Ancestries Reported - Swedish (%)
Ancestries Reported - Swiss (%)
Ancestries Reported - Ukrainian (%)
Ancestries Reported - United States (%)
Ancestries Reported - Welsh (%)
Ancestries Reported - West Indian (%)
Ancestries Reported - Other (%)
Geographical mobility - Same house 1 year ago (%)
Geographical mobility - Same house 1 year ago (%) - White
Geographical mobility - Same house 1 year ago (%) - Black or African American
Geographical mobility - Same house 1 year ago (%) - Asian
Geographical mobility - Same house 1 year ago (%) - Hispanic or Latino
Geographical mobility - Same house 1 year ago (%) - American Indian and Alaska Native
Geographical mobility - Same house 1 year ago (%) - Multirace
Geographical mobility - Same house 1 year ago (%) - Other Race
Geographical mobility - Moved within same county (%)
Geographical mobility - Moved within same county (%) - White
Geographical mobility - Moved within same county (%) - Black or African American
Geographical mobility - Moved within same county (%) - Asian
Geographical mobility - Moved within same county (%) - Hispanic or Latino
Geographical mobility - Moved within same county (%) - American Indian and Alaska Native
Geographical mobility - Moved within same county (%) - Multirace
Geographical mobility - Moved within same county (%) - Other Race
Geographical mobility - Moved from different county within same state (%)
Geographical mobility - Moved from different county within same state (%) - White
Geographical mobility - Moved from different county within same state (%) - Black or African American
Geographical mobility - Moved from different county within same state (%) - Asian
Geographical mobility - Moved from different county within same state (%) - Hispanic or Latino
Geographical mobility - Moved from different county within same state (%) - American Indian and Alaska Native
Geographical mobility - Moved from different county within same state (%) - Multirace
Geographical mobility - Moved from different county within same state (%) - Other Race
Geographical mobility - Moved from different state (%)
Geographical mobility - Moved from different state (%) - White
Geographical mobility - Moved from different state (%) - Black or African American
Geographical mobility - Moved from different state (%) - Asian
Geographical mobility - Moved from different state (%) - Hispanic or Latino
Geographical mobility - Moved from different state (%) - American Indian and Alaska Native
Geographical mobility - Moved from different state (%) - Multirace
Geographical mobility - Moved from different state (%) - Other Race
Geographical mobility - Moved from abroad (%)
Geographical mobility - Moved from abroad (%) - White
Geographical mobility - Moved from abroad (%) - Black or African American
Geographical mobility - Moved from abroad (%) - Asian
Geographical mobility - Moved from abroad (%) - Hispanic or Latino
Geographical mobility - Moved from abroad (%) - American Indian and Alaska Native
Geographical mobility - Moved from abroad (%) - Multirace
Geographical mobility - Moved from abroad (%) - Other Race
Place of birth for the foreign-born population - Ireland (%)
Place of birth for the foreign-born population - Denmark (%)
Place of birth for the foreign-born population - Norway (%)
Place of birth for the foreign-born population - Sweden (%)
Place of birth for the foreign-born population - United Kingdom (%)
Place of birth for the foreign-born population - England (%)
Place of birth for the foreign-born population - Scotland (%)
Place of birth for the foreign-born population - Other Northern Europe (%)
Place of birth for the foreign-born population - Austria (%)
Place of birth for the foreign-born population - Belgium (%)
Place of birth for the foreign-born population - France (%)
Place of birth for the foreign-born population - Germany (%)
Place of birth for the foreign-born population - Netherlands (%)
Place of birth for the foreign-born population - Switzerland (%)
Place of birth for the foreign-born population - Other Western Europe (%)
Place of birth for the foreign-born population - Greece (%)
Place of birth for the foreign-born population - Italy (%)
Place of birth for the foreign-born population - Portugal (%)
Place of birth for the foreign-born population - Spain (%)
Place of birth for the foreign-born population - Other Southern Europe (%)
Place of birth for the foreign-born population - Albania (%)
Place of birth for the foreign-born population - Belarus (%)
Place of birth for the foreign-born population - Bosnia and Herzegovina (%)
Place of birth for the foreign-born population - Bulgaria (%)
Place of birth for the foreign-born population - Croatia (%)
Place of birth for the foreign-born population - Czechoslovakia (%)
Place of birth for the foreign-born population - Hungary (%)
Place of birth for the foreign-born population - Latvia (%)
Place of birth for the foreign-born population - Lithuania (%)
Place of birth for the foreign-born population - North Macedonia (Macedonia) (%)
Place of birth for the foreign-born population - Moldova (%)
Place of birth for the foreign-born population - Poland (%)
Place of birth for the foreign-born population - Romania (%)
Place of birth for the foreign-born population - Russia (%)
Place of birth for the foreign-born population - Serbia (%)
Place of birth for the foreign-born population - Ukraine (%)
Place of birth for the foreign-born population - Other Eastern Europe (%)
Place of birth for the foreign-born population - China (%)
Place of birth for the foreign-born population - Hong Kong (%)
Place of birth for the foreign-born population - Taiwan (%)
Place of birth for the foreign-born population - Japan (%)
Place of birth for the foreign-born population - Korea (%)
Place of birth for the foreign-born population - Other Eastern Asia (%)
Place of birth for the foreign-born population - Afghanistan (%)
Place of birth for the foreign-born population - Bangladesh (%)
Place of birth for the foreign-born population - India (%)
Place of birth for the foreign-born population - Iran (%)
Place of birth for the foreign-born population - Kazakhstan (%)
Place of birth for the foreign-born population - Nepal (%)
Place of birth for the foreign-born population - Pakistan (%)
Place of birth for the foreign-born population - Sri Lanka (%)
Place of birth for the foreign-born population - Uzbekistan (%)
Place of birth for the foreign-born population - Other South Central Asia (%)
Place of birth for the foreign-born population - Burma (%)
Place of birth for the foreign-born population - Cambodia (%)
Place of birth for the foreign-born population - Indonesia (%)
Place of birth for the foreign-born population - Laos (%)
Place of birth for the foreign-born population - Malaysia (%)
Place of birth for the foreign-born population - Philippines (%)
Place of birth for the foreign-born population - Singapore (%)
Place of birth for the foreign-born population - Thailand (%)
Place of birth for the foreign-born population - Vietnam (%)
Place of birth for the foreign-born population - Other South Eastern Asia (%)
Place of birth for the foreign-born population - Armenia (%)
Place of birth for the foreign-born population - Iraq (%)
Place of birth for the foreign-born population - Israel (%)
Place of birth for the foreign-born population - Jordan (%)
Place of birth for the foreign-born population - Kuwait (%)
Place of birth for the foreign-born population - Lebanon (%)
Place of birth for the foreign-born population - Saudi Arabia (%)
Place of birth for the foreign-born population - Syria (%)
Place of birth for the foreign-born population - Turkey (%)
Place of birth for the foreign-born population - Yemen (%)
Place of birth for the foreign-born population - Other Western Asia (%)
Place of birth for the foreign-born population - Eritrea (%)
Place of birth for the foreign-born population - Ethiopia (%)
Place of birth for the foreign-born population - Kenya (%)
Place of birth for the foreign-born population - Somalia (%)
Place of birth for the foreign-born population - Uganda (%)
Place of birth for the foreign-born population - Zimbabwe (%)
Place of birth for the foreign-born population - Other Eastern Africa (%)
Place of birth for the foreign-born population - Cameroon (%)
Place of birth for the foreign-born population - Congo (%)
Place of birth for the foreign-born population - Democratic Republic of Congo (Zaire) (%)
Place of birth for the foreign-born population - Other Middle Africa (%)
Place of birth for the foreign-born population - Egypt (%)
Place of birth for the foreign-born population - Morocco (%)
Place of birth for the foreign-born population - Sudan (%)
Place of birth for the foreign-born population - Other Northern Africa (%)
Place of birth for the foreign-born population - South Africa (%)
Place of birth for the foreign-born population - Other Southern Africa (%)
Place of birth for the foreign-born population - Cabo Verde (%)
Place of birth for the foreign-born population - Ghana (%)
Place of birth for the foreign-born population - Liberia (%)
Place of birth for the foreign-born population - Nigeria (%)
Place of birth for the foreign-born population - Senegal (%)
Place of birth for the foreign-born population - Sierra Leone (%)
Place of birth for the foreign-born population - Other Western Africa (%)
Place of birth for the foreign-born population - Australia (%)
Place of birth for the foreign-born population - New Zealand (%)
Place of birth for the foreign-born population - Fiji (%)
Place of birth for the foreign-born population - Micronesia (%)
Place of birth for the foreign-born population - Bahamas (%)
Place of birth for the foreign-born population - Barbados (%)
Place of birth for the foreign-born population - Cuba (%)
Place of birth for the foreign-born population - Dominica (%)
Place of birth for the foreign-born population - Dominican Republic (%)
Place of birth for the foreign-born population - Grenada (%)
Place of birth for the foreign-born population - Haiti (%)
Place of birth for the foreign-born population - Jamaica (%)
Place of birth for the foreign-born population - St. Vincent and the Grenadines (%)
Place of birth for the foreign-born population - Trinidad and Tobago (%)
Place of birth for the foreign-born population - West Indies (%)
Place of birth for the foreign-born population - Other Caribbean (%)
Place of birth for the foreign-born population - Belize (%)
Place of birth for the foreign-born population - Costa Rica (%)
Place of birth for the foreign-born population - El Salvador (%)
Place of birth for the foreign-born population - Guatemala (%)
Place of birth for the foreign-born population - Honduras (%)
Place of birth for the foreign-born population - Mexico (%)
Place of birth for the foreign-born population - Nicaragua (%)
Place of birth for the foreign-born population - Panama (%)
Place of birth for the foreign-born population - Other Central America (%)
Place of birth for the foreign-born population - Argentina (%)
Place of birth for the foreign-born population - Bolivia (%)
Place of birth for the foreign-born population - Brazil (%)
Place of birth for the foreign-born population - Chile (%)
Place of birth for the foreign-born population - Colombia (%)
Place of birth for the foreign-born population - Ecuador (%)
Place of birth for the foreign-born population - Guyana (%)
Place of birth for the foreign-born population - Peru (%)
Place of birth for the foreign-born population - Uruguay (%)
Place of birth for the foreign-born population - Venezuela (%)
Place of birth for the foreign-born population - Other South America (%)
Place of birth for the foreign-born population - Canada (%)
Place of birth for the foreign-born population - Other Northern America (%)
Place of birth for the foreign-born population - Other (%)
Latest news about races in Anderson, SC collected exclusively by city-data.com from local newspapers, TV, and radio stations
According to 2022 data, the most numerous races in Anderson, SC are White alone (18,047 residents), Black alone (8,941 residents), and Hispanic (1,205 residents). 93.1% of Anderson residents speak English at home. 5.0% of Anderson, SC residents are foreign-born (2.2% born in Asia, 1.9% born in Latin America, 0.6% born in Europe), which is about the same as the foreign-born rate of 5.0% across the entire state of South Carolina.
Race distribution in Anderson
2000 2022
2,652,291 66.1% White alone 1,178,486 29.4% Black alone 95,076 2.4% Hispanic 35,568 0.9% Asian alone 33,290 0.8% Two or more races 12,765 0.3% American Indian alone 3,266 0.08% Other race alone 1,270 0.03% Native Hawaiian and Other
3,301,739 62.5% White alone 1,313,290 24.9% Black alone 343,783 6.5% Hispanic 190,508 3.6% Two or more races 89,888 1.7% Asian alone 29,390 0.6% Other race alone 12,112 0.2% American Indian alone 1,924 0.04% Native Hawaiian and Other
Income and house value in Anderson Median household income in 2022 $50,797 White non-Hispanic householders$28,736 Black householders$82,750 Asian householders$52,480 Two or more races householdersMedian 2022 house value $236,207 White Non-Hispanic householders$126,770 Black or African American householders$168,165 Some other race householders$183,170 Two or more races householders$209,559 Hispanic or Latino householders
Median age by race in Anderson
36.5 Median age for White residents35.4 37.1 31.6 Median age for Black or African American residents32.1 30.7 -890,951,275.2 Median age for American Indian / Alaska Native residents-583,333,332.8 -917,269,075.4 19.5 Median age for Asian residents17.4 18.0 65.2 Median age for Native Hawaiian / Pacific Islander residents51.5 -666,666,666.0 24.1 Median age for Other race residents48.6 17.2 26.7 Median age for Two or more races residents13.7 38.1 37.6 Median age for White alone residents36.8 38.5 26.3 Median age for Hispanic or Latino residents27.8 23.6
Owner/renter occupied households by race in Anderson
House owners and renters - White residents 5,185 64.6% Owner occupied2,847 35.4% Renter occupiedHouse owners and renters - Black or African American residents 1,137 32.6% Owner occupied2,356 67.4% Renter occupiedHouse owners and renters - American Indian / Alaska Native residents 45 100.0% Renter occupiedHouse owners and renters - Asian residents 75 55.6% Owner occupied60 44.4% Renter occupiedHouse owners and renters - Native Hawaiian / Pacific Islander residents 10 100.0% Owner occupiedHouse owners and renters - Other race residents 60 59.8% Owner occupied40 40.2% Renter occupiedHouse owners and renters - Two or more races residents 96 20.7% Owner occupied367 79.3% Renter occupiedHouse owners and renters - White alone residents 5,087 65.0% Owner occupied2,736 35.0% Renter occupiedHouse owners and renters - Hispanic or Latino residents 201 51.6% Owner occupied188 48.4% Renter occupied
Language usage in Anderson
English speakers - Total 93.1% of residents of Anderson speak English at home.
2.4% of residents speak Spanish at home 443 64.4% Speak English very well245 35.6% Speak English less than very well5.3% of residents speak other language at home 818 55.1% Speak English very well666 44.9% Speak English less than very well
English speakers - Born in the United States 93.0% of residents of Anderson speak English at home.
1.6% of residents speak Spanish at home 163 91.6% Speak English very well15 8.4% Speak English less than very well4.4% of residents speak other language at home 440 91.5% Speak English very well41 8.5% Speak English less than very well
English speakers - Native, born elsewhere 39.8% of residents of Anderson speak English at home.
45.7% of residents speak Spanish at home 59 69.4% Speak English very well26 30.6% Speak English less than very well51.1% of residents speak other language at home 95 100.0% Speak English very well
English speakers - Foreign-born 31.9% of residents of Anderson speak English at home.
19.1% of residents speak Spanish at home 144 48.3% Speak English very well154 51.7% Speak English less than very well52.7% of residents speak other language at home 273 33.2% Speak English very well549 66.8% Speak English less than very well
White (Caucasian) - Speak only English Native:
96.1% (16,601)Foreign-born:
22.2% (132)
White (Caucasian) - Speak another language Native:
4.7% (818)Foreign-born:
83.4% (496)
Black or African American - Speak only English Native:
99.0% (7,309)Foreign-born:
32.9% (50)
Black or African American - Speak another language Native:
1.0% (71)Foreign-born:
74.5% (113)
Asian - Speak only English Native:
87.6% (57)Foreign-born:
45.8% (291)
Asian - Speak another language Native:
22.1% (14)Foreign-born:
50.5% (321)
Other race - Speak another language Native:
78.5% (204)Foreign-born:
98.6% (67)
Two or more races - Speak only English Native:
93.9% (1,335)Foreign-born:
20.1% (44)
Two or more races - Speak another language Native:
6.1% (86)Foreign-born:
60.1% (132)
White alone - Speak only English Native:
96.5% (16,313)Foreign-born:
27.3% (95)
White alone - Speak another language Native:
5.0% (850)Foreign-born:
85.4% (296)
Hispanic or Latino - Speak only English Native:
55.3% (404)Foreign-born:
9.1% (34)
Hispanic or Latino - Speak another language Native:
34.2% (249)Foreign-born:
90.7% (336)
Foreign-born residents in Anderson 1,518 residents are foreign born (2.2% Asia , 1.9% Latin America , 0.6% Europe ).
This city:
5.0%South Carolina:
5.3%
Marital status for residents in Anderson Marital status - White (Caucasian) population 15 years and over
Males 32.0% Never married49.4% Now married2.6% Separated5.1% Widowed10.8% DivorcedFemales 33.2% Never married39.0% Now married1.2% Separated13.6% Widowed12.9% DivorcedWomen who gave birth in the past 12 months Now married:
78.0% (125)Unmarried:
22.0% (35)
Women who did not give birth in the past 12 months Now married:
33.7% (1,619)Unmarried:
66.3% (3,188)
Marital status - Black or African American population 15 years and over
Males 63.8% Never married21.2% Now married3.1% Separated3.8% Widowed8.1% DivorcedFemales 52.6% Never married17.0% Now married6.6% Separated14.0% Widowed9.9% DivorcedWomen who gave birth in the past 12 months Now married:
0.0% (0)Unmarried:
100.0% (234)
Women who did not give birth in the past 12 months Now married:
21.6% (370)Unmarried:
78.4% (1,339)
Marital status - Asian population 15 years and over
Males 53.4% Never married39.8% Now married0.0% Separated3.6% Widowed3.2% DivorcedFemales 34.8% Never married55.2% Now married0.0% Separated5.0% Widowed5.0% DivorcedWomen who did not give birth in the past 12 months Now married:
51.8% (95)Unmarried:
48.2% (89)
Marital status - Other race population 15 years and over
Males 74.0% Never married26.0% Now married0.0% Separated0.0% Widowed0.0% DivorcedFemales 62.9% Never married28.9% Now married0.0% Separated0.0% Widowed8.2% DivorcedWomen who did not give birth in the past 12 months Now married:
0.0% (0)Unmarried:
100.0% (83)
Marital status - Two or more races population 15 years and over
Males 67.6% Never married27.0% Now married1.7% Separated0.0% Widowed3.7% DivorcedFemales 45.1% Never married13.5% Now married11.3% Separated18.2% Widowed11.9% DivorcedWomen who gave birth in the past 12 months Now married:
0.0% (0)Unmarried:
100.0% (40)
Women who did not give birth in the past 12 months Now married:
8.0% (17)Unmarried:
92.0% (200)
Marital status - White alone, not Hispanic / Latino population 15 years and over
Males 32.0% Never married48.7% Now married2.7% Separated5.3% Widowed11.2% DivorcedFemales 32.5% Never married39.3% Now married1.3% Separated14.0% Widowed12.9% DivorcedWomen who gave birth in the past 12 months Now married:
78.0% (124)Unmarried:
22.0% (35)
Women who did not give birth in the past 12 months Now married:
34.4% (1,572)Unmarried:
65.6% (2,999)
Marital status - Hispanic or Latino population 15 years and over
Males 46.4% Never married51.1% Now married0.2% Separated0.0% Widowed2.2% DivorcedFemales 54.4% Never married25.9% Now married0.0% Separated10.7% Widowed9.1% DivorcedWomen who did not give birth in the past 12 months Now married:
11.4% (30)Unmarried:
88.6% (233)
Ancestries in Anderson
2,235 14.2% American2,086 13.3% English1,083 6.9% Irish646 4.1% Ukrainian591 3.8% German381 2.4% European267 1.7% African244 1.6% Scotch-Irish184 1.2% Scottish120 0.8% Italian107 0.7% Lebanese88 0.6% French66 0.4% Swedish66 0.4% Dutch59 0.4% British58 0.4% Welsh57 0.4% Hungarian45 0.3% Slovak37 0.2% Polish35 0.2% Haitian32 0.2% Macedonian29 0.2% Scandinavian26 0.2% Austrian24 0.2% French Canadian22 0.1% Norwegian22 0.1% Romanian19 0.1% Eastern European16 0.1% Czech16 0.1% Northern European13 0.08% Russian13 0.08% Serbian13 0.08% Jamaican12 0.08% Syrian11 0.07% Slavic11 0.07% Australian10 0.06% Canadian5 0.03% Lithuanian3 0.02% Portuguese2 0.01% Belizean
Geographical mobility in Anderson Same house 1 year ago 14,997 81.0% White (Caucasian)6,951 80.6% Black or African American73 100.0% American Indian / Alaska Native716 97.4% Asian10 60.6% Native Hawaiian / Pacific Islander71 23.0% Other race1,547 90.3% Two or more races14,808 82.9% White alone, not Hispanic / Latino513 42.8% Hispanic or LatinoMoved within same county 1,015 5.5% White / Caucasian1,886 21.9% Black or African American259 84.5% Other race96 5.6% Two or more races903 5.1% White alone, not Hispanic / Latino559 46.6% Hispanic or LatinoMoved within same state 767 4.1% White / Caucasian109 1.3% Black or African American14 1.9% Asian34 2.0% Two or more races737 4.1% White alone, not Hispanic / Latino61 5.1% Hispanic or LatinoMoved from different state 1,721 9.3% White / Caucasian58 0.7% Black or African American5 0.7% Asian18 1.0% Two or more races1,401 7.8% White alone, not Hispanic / Latino37 3.1% Hispanic or LatinoMoved from abroad 8 0.0% White39 0.5% Black or African American5 28.2% Native Hawaiian / Pacific Islander4 0.0% White alone, not Hispanic / Latino
Children Nativity (place of birth) in Anderson
Children under 6 years - Living with two parents Both parents native 797 100.0% NativeBoth parents foreign-born 21 100.0% NativeOne native, one foreign-born parent 46 100.0% NativeChildren under 6 years - Living with one parent Native parent 1,214 100.0% NativeForeign-born parent 54 100.0% NativeChildren 6 to 17 years - Living with two parents Both parents native 1,971 100.0% NativeBoth parents foreign-born 58 34.1% Native112 65.9% Foreign-bornOne native, one foreign-born parent 139 100.0% NativeChildren 6 to 17 years - Living with one parent Native parent 1,641 100.0% NativeForeign-born parent 287 49.6% Native291 50.4% Foreign-born
Grandparents responsible for own grandchildren in Anderson
Grandparents (30 to 59 years) Black or African American 114 61.5% Responsible for grandchildren71 38.5% Not responsible for grandchildrenGrandparents (60 years and over) Black or African American 13 36.4% Responsible for grandchildren23 63.6% Not responsible for grandchildren