Races in Apopka, Florida (FL) Detailed Stats
Data:
Races - White alone (%)
Races - White alone (% change since 2000)
Races - Black alone (%)
Races - Black alone (% change since 2000)
Races - American Indian alone (%)
Races - American Indian alone (% change since 2000)
Races - Asian alone (%)
Races - Asian alone (% change since 2000)
Races - Hispanic (%)
Races - Hispanic (% change since 2000)
Races - Native Hawaiian and Other Pacific Islander alone (%)
Races - Native Hawaiian and Other Pacific Islander alone (% change since 2000)
Races - Two or more races(%)
Races - Two or more races(% change since 2000)
Races - Other race alone (%)
Races - Other race alone (% change since 2000)
Racial diversity
Place of birth - Born in state of residence (%)
Place of birth - Born in state of residence (%) - White
Place of birth - Born in state of residence (%) - Black or African American
Place of birth - Born in state of residence (%) - Asian
Place of birth - Born in state of residence (%) - Hispanic or Latino
Place of birth - Born in state of residence (%) - American Indian and Alaska Native
Place of birth - Born in state of residence (%) - Multirace
Place of birth - Born in state of residence (%) - Other Race
Place of birth - Born in other state (%)
Place of birth - Born in other state (%) - White
Place of birth - Born in other state (%) - Black or African American
Place of birth - Born in other state (%) - Asian
Place of birth - Born in other state (%) - Hispanic or Latino
Place of birth - Born in other state (%) - American Indian and Alaska Native
Place of birth - Born in other state (%) - Multirace
Place of birth - Born in other state (%) - Other Race
Place of birth - Native, outside of US (%)
Place of birth - Native, outside of US (%) - White
Place of birth - Native, outside of US (%) - Black or African American
Place of birth - Native, outside of US (%) - Asian
Place of birth - Native, outside of US (%) - Hispanic or Latino
Place of birth - Native, outside of US (%) - American Indian and Alaska Native
Place of birth - Native, outside of US (%) - Multirace
Place of birth - Native, outside of US (%) - Other Race
Place of birth - Foreign born (%)
Place of birth - Foreign born (%) - White
Place of birth - Foreign born (%) - Black or African American
Place of birth - Foreign born (%) - Asian
Place of birth - Foreign born (%) - Hispanic or Latino
Place of birth - Foreign born (%) - American Indian and Alaska Native
Place of birth - Foreign born (%) - Multirace
Place of birth - Foreign born (%) - Other Race
Residents speaking English at home (%)
Residents speaking English at home - Born in the United States (%)
Residents speaking English at home - Native, born elsewhere (%)
Residents speaking English at home - Foreign born (%)
Residents speaking Spanish at home (%)
Residents speaking Spanish at home - Born in the United States (%)
Residents speaking Spanish at home - Native, born elsewhere (%)
Residents speaking Spanish at home - Foreign born (%)
Residents speaking other language at home (%)
Residents speaking other language at home - Born in the United States (%)
Residents speaking other language at home - Native, born elsewhere (%)
Residents speaking other language at home - Foreign born (%)
Marital status - Never married (%)
Marital status - Now married (%)
Marital status - Separated (%)
Marital status - Widowed (%)
Marital status - Divorced (%)
Ancestries Reported - Arab (%)
Ancestries Reported - Czech (%)
Ancestries Reported - Danish (%)
Ancestries Reported - Dutch (%)
Ancestries Reported - English (%)
Ancestries Reported - French (%)
Ancestries Reported - French Canadian (%)
Ancestries Reported - German (%)
Ancestries Reported - Greek (%)
Ancestries Reported - Hungarian (%)
Ancestries Reported - Irish (%)
Ancestries Reported - Italian (%)
Ancestries Reported - Lithuanian (%)
Ancestries Reported - Norwegian (%)
Ancestries Reported - Polish (%)
Ancestries Reported - Portuguese (%)
Ancestries Reported - Russian (%)
Ancestries Reported - Scotch-Irish (%)
Ancestries Reported - Scottish (%)
Ancestries Reported - Slovak (%)
Ancestries Reported - Subsaharan African (%)
Ancestries Reported - Swedish (%)
Ancestries Reported - Swiss (%)
Ancestries Reported - Ukrainian (%)
Ancestries Reported - United States (%)
Ancestries Reported - Welsh (%)
Ancestries Reported - West Indian (%)
Ancestries Reported - Other (%)
Geographical mobility - Same house 1 year ago (%)
Geographical mobility - Same house 1 year ago (%) - White
Geographical mobility - Same house 1 year ago (%) - Black or African American
Geographical mobility - Same house 1 year ago (%) - Asian
Geographical mobility - Same house 1 year ago (%) - Hispanic or Latino
Geographical mobility - Same house 1 year ago (%) - American Indian and Alaska Native
Geographical mobility - Same house 1 year ago (%) - Multirace
Geographical mobility - Same house 1 year ago (%) - Other Race
Geographical mobility - Moved within same county (%)
Geographical mobility - Moved within same county (%) - White
Geographical mobility - Moved within same county (%) - Black or African American
Geographical mobility - Moved within same county (%) - Asian
Geographical mobility - Moved within same county (%) - Hispanic or Latino
Geographical mobility - Moved within same county (%) - American Indian and Alaska Native
Geographical mobility - Moved within same county (%) - Multirace
Geographical mobility - Moved within same county (%) - Other Race
Geographical mobility - Moved from different county within same state (%)
Geographical mobility - Moved from different county within same state (%) - White
Geographical mobility - Moved from different county within same state (%) - Black or African American
Geographical mobility - Moved from different county within same state (%) - Asian
Geographical mobility - Moved from different county within same state (%) - Hispanic or Latino
Geographical mobility - Moved from different county within same state (%) - American Indian and Alaska Native
Geographical mobility - Moved from different county within same state (%) - Multirace
Geographical mobility - Moved from different county within same state (%) - Other Race
Geographical mobility - Moved from different state (%)
Geographical mobility - Moved from different state (%) - White
Geographical mobility - Moved from different state (%) - Black or African American
Geographical mobility - Moved from different state (%) - Asian
Geographical mobility - Moved from different state (%) - Hispanic or Latino
Geographical mobility - Moved from different state (%) - American Indian and Alaska Native
Geographical mobility - Moved from different state (%) - Multirace
Geographical mobility - Moved from different state (%) - Other Race
Geographical mobility - Moved from abroad (%)
Geographical mobility - Moved from abroad (%) - White
Geographical mobility - Moved from abroad (%) - Black or African American
Geographical mobility - Moved from abroad (%) - Asian
Geographical mobility - Moved from abroad (%) - Hispanic or Latino
Geographical mobility - Moved from abroad (%) - American Indian and Alaska Native
Geographical mobility - Moved from abroad (%) - Multirace
Geographical mobility - Moved from abroad (%) - Other Race
Place of birth for the foreign-born population - Ireland (%)
Place of birth for the foreign-born population - Denmark (%)
Place of birth for the foreign-born population - Norway (%)
Place of birth for the foreign-born population - Sweden (%)
Place of birth for the foreign-born population - United Kingdom (%)
Place of birth for the foreign-born population - England (%)
Place of birth for the foreign-born population - Scotland (%)
Place of birth for the foreign-born population - Other Northern Europe (%)
Place of birth for the foreign-born population - Austria (%)
Place of birth for the foreign-born population - Belgium (%)
Place of birth for the foreign-born population - France (%)
Place of birth for the foreign-born population - Germany (%)
Place of birth for the foreign-born population - Netherlands (%)
Place of birth for the foreign-born population - Switzerland (%)
Place of birth for the foreign-born population - Other Western Europe (%)
Place of birth for the foreign-born population - Greece (%)
Place of birth for the foreign-born population - Italy (%)
Place of birth for the foreign-born population - Portugal (%)
Place of birth for the foreign-born population - Spain (%)
Place of birth for the foreign-born population - Other Southern Europe (%)
Place of birth for the foreign-born population - Albania (%)
Place of birth for the foreign-born population - Belarus (%)
Place of birth for the foreign-born population - Bosnia and Herzegovina (%)
Place of birth for the foreign-born population - Bulgaria (%)
Place of birth for the foreign-born population - Croatia (%)
Place of birth for the foreign-born population - Czechoslovakia (%)
Place of birth for the foreign-born population - Hungary (%)
Place of birth for the foreign-born population - Latvia (%)
Place of birth for the foreign-born population - Lithuania (%)
Place of birth for the foreign-born population - North Macedonia (Macedonia) (%)
Place of birth for the foreign-born population - Moldova (%)
Place of birth for the foreign-born population - Poland (%)
Place of birth for the foreign-born population - Romania (%)
Place of birth for the foreign-born population - Russia (%)
Place of birth for the foreign-born population - Serbia (%)
Place of birth for the foreign-born population - Ukraine (%)
Place of birth for the foreign-born population - Other Eastern Europe (%)
Place of birth for the foreign-born population - China (%)
Place of birth for the foreign-born population - Hong Kong (%)
Place of birth for the foreign-born population - Taiwan (%)
Place of birth for the foreign-born population - Japan (%)
Place of birth for the foreign-born population - Korea (%)
Place of birth for the foreign-born population - Other Eastern Asia (%)
Place of birth for the foreign-born population - Afghanistan (%)
Place of birth for the foreign-born population - Bangladesh (%)
Place of birth for the foreign-born population - India (%)
Place of birth for the foreign-born population - Iran (%)
Place of birth for the foreign-born population - Kazakhstan (%)
Place of birth for the foreign-born population - Nepal (%)
Place of birth for the foreign-born population - Pakistan (%)
Place of birth for the foreign-born population - Sri Lanka (%)
Place of birth for the foreign-born population - Uzbekistan (%)
Place of birth for the foreign-born population - Other South Central Asia (%)
Place of birth for the foreign-born population - Burma (%)
Place of birth for the foreign-born population - Cambodia (%)
Place of birth for the foreign-born population - Indonesia (%)
Place of birth for the foreign-born population - Laos (%)
Place of birth for the foreign-born population - Malaysia (%)
Place of birth for the foreign-born population - Philippines (%)
Place of birth for the foreign-born population - Singapore (%)
Place of birth for the foreign-born population - Thailand (%)
Place of birth for the foreign-born population - Vietnam (%)
Place of birth for the foreign-born population - Other South Eastern Asia (%)
Place of birth for the foreign-born population - Armenia (%)
Place of birth for the foreign-born population - Iraq (%)
Place of birth for the foreign-born population - Israel (%)
Place of birth for the foreign-born population - Jordan (%)
Place of birth for the foreign-born population - Kuwait (%)
Place of birth for the foreign-born population - Lebanon (%)
Place of birth for the foreign-born population - Saudi Arabia (%)
Place of birth for the foreign-born population - Syria (%)
Place of birth for the foreign-born population - Turkey (%)
Place of birth for the foreign-born population - Yemen (%)
Place of birth for the foreign-born population - Other Western Asia (%)
Place of birth for the foreign-born population - Eritrea (%)
Place of birth for the foreign-born population - Ethiopia (%)
Place of birth for the foreign-born population - Kenya (%)
Place of birth for the foreign-born population - Somalia (%)
Place of birth for the foreign-born population - Uganda (%)
Place of birth for the foreign-born population - Zimbabwe (%)
Place of birth for the foreign-born population - Other Eastern Africa (%)
Place of birth for the foreign-born population - Cameroon (%)
Place of birth for the foreign-born population - Congo (%)
Place of birth for the foreign-born population - Democratic Republic of Congo (Zaire) (%)
Place of birth for the foreign-born population - Other Middle Africa (%)
Place of birth for the foreign-born population - Egypt (%)
Place of birth for the foreign-born population - Morocco (%)
Place of birth for the foreign-born population - Sudan (%)
Place of birth for the foreign-born population - Other Northern Africa (%)
Place of birth for the foreign-born population - South Africa (%)
Place of birth for the foreign-born population - Other Southern Africa (%)
Place of birth for the foreign-born population - Cabo Verde (%)
Place of birth for the foreign-born population - Ghana (%)
Place of birth for the foreign-born population - Liberia (%)
Place of birth for the foreign-born population - Nigeria (%)
Place of birth for the foreign-born population - Senegal (%)
Place of birth for the foreign-born population - Sierra Leone (%)
Place of birth for the foreign-born population - Other Western Africa (%)
Place of birth for the foreign-born population - Australia (%)
Place of birth for the foreign-born population - New Zealand (%)
Place of birth for the foreign-born population - Fiji (%)
Place of birth for the foreign-born population - Micronesia (%)
Place of birth for the foreign-born population - Bahamas (%)
Place of birth for the foreign-born population - Barbados (%)
Place of birth for the foreign-born population - Cuba (%)
Place of birth for the foreign-born population - Dominica (%)
Place of birth for the foreign-born population - Dominican Republic (%)
Place of birth for the foreign-born population - Grenada (%)
Place of birth for the foreign-born population - Haiti (%)
Place of birth for the foreign-born population - Jamaica (%)
Place of birth for the foreign-born population - St. Vincent and the Grenadines (%)
Place of birth for the foreign-born population - Trinidad and Tobago (%)
Place of birth for the foreign-born population - West Indies (%)
Place of birth for the foreign-born population - Other Caribbean (%)
Place of birth for the foreign-born population - Belize (%)
Place of birth for the foreign-born population - Costa Rica (%)
Place of birth for the foreign-born population - El Salvador (%)
Place of birth for the foreign-born population - Guatemala (%)
Place of birth for the foreign-born population - Honduras (%)
Place of birth for the foreign-born population - Mexico (%)
Place of birth for the foreign-born population - Nicaragua (%)
Place of birth for the foreign-born population - Panama (%)
Place of birth for the foreign-born population - Other Central America (%)
Place of birth for the foreign-born population - Argentina (%)
Place of birth for the foreign-born population - Bolivia (%)
Place of birth for the foreign-born population - Brazil (%)
Place of birth for the foreign-born population - Chile (%)
Place of birth for the foreign-born population - Colombia (%)
Place of birth for the foreign-born population - Ecuador (%)
Place of birth for the foreign-born population - Guyana (%)
Place of birth for the foreign-born population - Peru (%)
Place of birth for the foreign-born population - Uruguay (%)
Place of birth for the foreign-born population - Venezuela (%)
Place of birth for the foreign-born population - Other South America (%)
Place of birth for the foreign-born population - Canada (%)
Place of birth for the foreign-born population - Other Northern America (%)
Place of birth for the foreign-born population - Other (%)
Latest news about races in Apopka, FL collected exclusively by city-data.com from local newspapers, TV, and radio stations
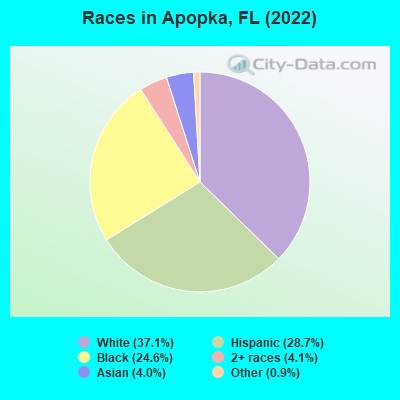
According to 2022 data, the most numerous races in Apopka, FL are White alone (20,796 residents), Hispanic (16,108 residents), and Black alone (13,791 residents). 70.5% of Apopka residents speak English at home. 20.1% of Apopka, FL residents are foreign-born (15.2% born in Latin America, 2.5% born in Asia), which is 4.6% less than the foreign-born rate of 21.0% across the entire state of Florida.
Race distribution in Apopka
2000 2022
10,458,509 65.4% White alone 2,682,715 16.8% Hispanic 2,264,268 14.2% Black alone 261,693 1.6% Asian alone 236,954 1.5% Two or more races 42,358 0.3% American Indian alone 28,994 0.2% Other race alone 6,887 0.04% Native Hawaiian and Other
11,309,403 50.8% White alone 6,025,039 27.1% Hispanic 3,241,015 14.6% Black alone 861,630 3.9% Two or more races 623,692 2.8% Asian alone 152,054 0.7% Other race alone 22,504 0.1% American Indian alone 9,486 0.04% Native Hawaiian and Other
Income and house value in Apopka Median household income in 2022 $104,058 White non-Hispanic householders$86,621 Black householders$67,698 Some other race householders$76,201 Two or more races householders$74,415 Hispanic or Latino race householdersMedian 2022 house value $407,443 White Non-Hispanic householders$372,652 Black or African American householders$351,778 American Indian or Alaska Native householders $379,997 Asian householders$367,240 Some other race householders$340,954 Two or more races householders$350,231 Hispanic or Latino householders
Median age by race in Apopka
43.1 Median age for White residents43.0 43.5 37.6 Median age for Black or African American residents36.3 41.2 12.6 Median age for American Indian / Alaska Native residents-735,632,183.2 -529,680,364.8 46.5 Median age for Asian residents51.5 47.4 -679,790,025.6 Median age for Native Hawaiian / Pacific Islander residents-1,327,635,326.3 -611,111,110.5 31.7 Median age for Other race residents25.6 36.8 32.3 Median age for Two or more races residents27.1 38.1 46.3 Median age for White alone residents44.6 47.2 31.7 Median age for Hispanic or Latino residents29.1 34.8
Owner/renter occupied households by race in Apopka
House owners and renters - White residents 7,222 80.2% Owner occupied1,781 19.8% Renter occupiedHouse owners and renters - Black or African American residents 3,878 77.8% Owner occupied1,109 22.2% Renter occupiedHouse owners and renters - American Indian / Alaska Native residents 10 38.8% Owner occupied16 61.2% Renter occupiedHouse owners and renters - Asian residents 525 85.9% Owner occupied86 14.1% Renter occupiedHouse owners and renters - Other race residents 919 59.2% Owner occupied633 40.8% Renter occupiedHouse owners and renters - Two or more races residents 3,246 78.9% Owner occupied867 21.1% Renter occupiedHouse owners and renters - White alone residents 6,914 82.9% Owner occupied1,422 17.1% Renter occupiedHouse owners and renters - Hispanic or Latino residents 3,631 67.3% Owner occupied1,768 32.7% Renter occupied
Language usage in Apopka
English speakers - Total 70.5% of residents of Apopka speak English at home.
21.4% of residents speak Spanish at home 7,486 66.2% Speak English very well3,827 33.8% Speak English less than very well7.9% of residents speak other language at home 2,426 57.7% Speak English very well1,776 42.3% Speak English less than very well
English speakers - Born in the United States 85.7% of residents of Apopka speak English at home.
12.2% of residents speak Spanish at home 2,086 88.1% Speak English very well283 11.9% Speak English less than very well2.1% of residents speak other language at home 412 100.0% Speak English very well
English speakers - Native, born elsewhere 36.0% of residents of Apopka speak English at home.
63.7% of residents speak Spanish at home 1,472 78.2% Speak English very well410 21.8% Speak English less than very well2.5% of residents speak other language at home 62 82.7% Speak English very well13 17.3% Speak English less than very well
English speakers - Foreign-born 28.4% of residents of Apopka speak English at home.
44.6% of residents speak Spanish at home 1,880 37.0% Speak English very well3,201 63.0% Speak English less than very well27.1% of residents speak other language at home 1,316 42.7% Speak English very well1,767 57.3% Speak English less than very well
White (Caucasian) - Speak only English Native:
96.1% (19,432)Foreign-born:
28.5% (372)
White (Caucasian) - Speak another language Native:
7.0% (1,407)Foreign-born:
73.3% (955)
Black or African American - Speak only English Native:
91.5% (9,580)Foreign-born:
62.3% (1,816)
Black or African American - Speak another language Native:
8.1% (848)Foreign-born:
39.9% (1,162)
American Indian / Alaska Native - Speak only English Native:
82.4% (26)Foreign-born:
100.0% (44)
Asian - Speak only English Native:
63.6% (306)Foreign-born:
31.2% (552)
Asian - Speak another language Native:
36.6% (176)Foreign-born:
69.5% (1,228)
Other race - Speak only English Native:
46.1% (1,129)Foreign-born:
2.5% (44)
Other race - Speak another language Native:
55.9% (1,370)Foreign-born:
99.6% (1,777)
Two or more races - Speak only English Native:
45.9% (3,334)Foreign-born:
12.5% (530)
Two or more races - Speak another language Native:
54.2% (3,938)Foreign-born:
87.4% (3,701)
White alone - Speak only English Native:
97.9% (18,629)Foreign-born:
44.7% (352)
White alone - Speak another language Native:
2.3% (436)Foreign-born:
49.2% (388)
Hispanic or Latino - Speak only English Native:
39.0% (3,696)Foreign-born:
5.3% (277)
Hispanic or Latino - Speak another language Native:
61.5% (5,827)Foreign-born:
94.7% (4,968)
Foreign-born residents in Apopka 11,249 residents are foreign born (15.2% Latin America , 2.5% Asia ).
This city:
20.1%Florida:
21.1%
Marital status for residents in Apopka Marital status - White (Caucasian) population 15 years and over
Males 30.1% Never married59.3% Now married0.0% Separated1.1% Widowed9.4% DivorcedFemales 23.4% Never married55.9% Now married2.7% Separated7.8% Widowed10.2% DivorcedWomen who gave birth in the past 12 months Now married:
85.1% (166)Unmarried:
14.9% (29)
Women who did not give birth in the past 12 months Now married:
54.6% (2,607)Unmarried:
45.4% (2,164)
Marital status - Black or African American population 15 years and over
Males 44.6% Never married45.9% Now married0.0% Separated1.0% Widowed8.4% DivorcedFemales 38.6% Never married36.8% Now married2.8% Separated7.7% Widowed14.1% DivorcedWomen who gave birth in the past 12 months Now married:
59.6% (31)Unmarried:
40.4% (21)
Women who did not give birth in the past 12 months Now married:
33.3% (1,231)Unmarried:
66.7% (2,466)
Marital status - American Indian / Alaska Native population 15 years and over
Males 0.0% Never married0.0% Now married100.0% Separated0.0% Widowed0.0% DivorcedFemales 0.0% Never married100.0% Now married0.0% Separated0.0% Widowed0.0% DivorcedWomen who did not give birth in the past 12 months Now married:
100.0% (11)Unmarried:
0.0% (0)
Marital status - Asian population 15 years and over
Males 30.3% Never married69.7% Now married0.0% Separated0.0% Widowed0.0% DivorcedFemales 10.2% Never married70.7% Now married0.0% Separated9.4% Widowed9.8% DivorcedWomen who gave birth in the past 12 months Now married:
100.0% (7)Unmarried:
0.0% (0)
Women who did not give birth in the past 12 months Now married:
68.4% (386)Unmarried:
31.6% (178)
Marital status - Other race population 15 years and over
Males 30.0% Never married64.7% Now married5.3% Separated0.0% Widowed0.0% DivorcedFemales 21.0% Never married49.4% Now married1.8% Separated20.5% Widowed7.4% DivorcedWomen who gave birth in the past 12 months Now married:
100.0% (153)Unmarried:
0.0% (0)
Women who did not give birth in the past 12 months Now married:
60.0% (795)Unmarried:
40.0% (530)
Marital status - Two or more races population 15 years and over
Males 41.6% Never married54.9% Now married0.0% Separated0.0% Widowed3.5% DivorcedFemales 35.9% Never married42.0% Now married3.3% Separated3.5% Widowed15.3% DivorcedWomen who gave birth in the past 12 months Now married:
85.0% (268)Unmarried:
15.0% (47)
Women who did not give birth in the past 12 months Now married:
48.4% (1,266)Unmarried:
51.6% (1,349)
Marital status - White alone, not Hispanic / Latino population 15 years and over
Males 26.7% Never married61.2% Now married0.0% Separated1.4% Widowed10.7% DivorcedFemales 21.6% Never married57.6% Now married2.1% Separated8.7% Widowed10.1% DivorcedWomen who gave birth in the past 12 months Now married:
87.5% (189)Unmarried:
12.5% (27)
Women who did not give birth in the past 12 months Now married:
56.2% (2,317)Unmarried:
43.8% (1,807)
Marital status - Hispanic or Latino population 15 years and over
Males 42.5% Never married54.2% Now married0.9% Separated0.0% Widowed2.4% DivorcedFemales 31.1% Never married45.8% Now married3.3% Separated8.1% Widowed11.7% DivorcedWomen who gave birth in the past 12 months Now married:
87.5% (261)Unmarried:
12.5% (37)
Women who did not give birth in the past 12 months Now married:
51.4% (2,048)Unmarried:
48.6% (1,934)
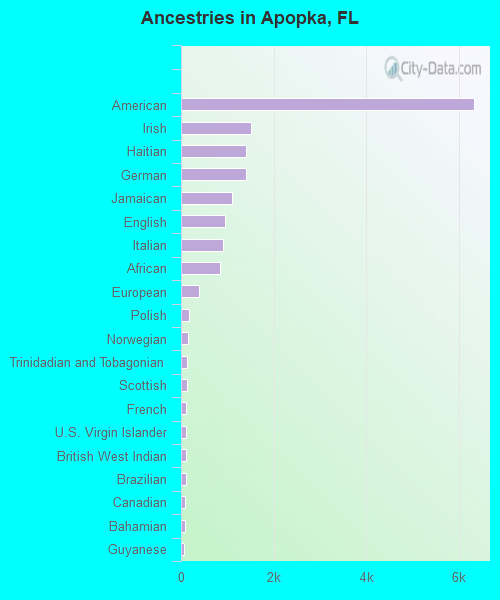
Ancestries in Apopka
6,340 18.2% American1,519 4.4% Irish1,408 4.0% Haitian1,401 4.0% German1,100 3.2% Jamaican945 2.7% English918 2.6% Italian835 2.4% African385 1.1% European174 0.5% Polish147 0.4% Norwegian128 0.4% Trinidadian and Tobagonian121 0.3% Scottish116 0.3% French105 0.3% U.S. Virgin Islander102 0.3% British West Indian98 0.3% Brazilian82 0.2% Canadian79 0.2% Bahamian68 0.2% Guyanese51 0.1% French Canadian49 0.1% West Indian47 0.1% Ethiopian43 0.1% Czech42 0.1% Barbadian37 0.1% Romanian37 0.1% Scotch-Irish34 0.10% Austrian33 0.09% Russian33 0.09% British33 0.09% Lebanese27 0.08% Ukrainian22 0.06% Dutch21 0.06% Swedish21 0.06% Macedonian14 0.04% Albanian12 0.03% Armenian11 0.03% Hungarian9 0.03% Bulgarian5 0.01% Welsh4 0.01% Danish
Geographical mobility in Apopka Same house 1 year ago 20,231 90.7% White (Caucasian)12,756 93.2% Black or African American93 100.0% American Indian / Alaska Native2,220 98.2% Asian17 100.0% Native Hawaiian / Pacific Islander3,885 85.0% Other race11,566 95.8% Two or more races18,911 91.3% White alone, not Hispanic / Latino14,339 91.4% Hispanic or LatinoMoved within same county 683 3.1% White / Caucasian564 4.1% Black or African American375 8.2% Other race274 2.3% Two or more races564 2.7% White alone, not Hispanic / Latino606 3.9% Hispanic or LatinoMoved within same state 967 4.3% White / Caucasian263 1.9% Black or African American29 1.3% Asian218 4.8% Other race234 1.9% Two or more races807 3.9% White alone, not Hispanic / Latino525 3.3% Hispanic or LatinoMoved from different state 509 2.3% White / Caucasian211 1.5% Black or African American80 3.5% Asian97 2.1% Other race61 0.5% Two or more races520 2.5% White alone, not Hispanic / Latino145 0.9% Hispanic or LatinoMoved from abroad 18 0.1% White110 0.8% Black or African American22 0.5% Other race82 0.7% Two or more races13 0.1% White alone, not Hispanic / Latino84 0.5% Hispanic or Latino
Children Nativity (place of birth) in Apopka
Children under 6 years - Living with two parents Both parents native 1,594 100.0% NativeBoth parents foreign-born 245 100.0% NativeOne native, one foreign-born parent 966 100.0% NativeChildren under 6 years - Living with one parent Native parent 808 99.9% Native1 0.1% Foreign-bornForeign-born parent 283 89.8% Native32 10.2% Foreign-bornChildren 6 to 17 years - Living with two parents Both parents native 3,986 98.9% Native43 1.1% Foreign-bornBoth parents foreign-born 1,043 85.0% Native184 15.0% Foreign-bornOne native, one foreign-born parent 1,060 95.7% Native48 4.3% Foreign-bornChildren 6 to 17 years - Living with one parent Native parent 1,332 100.0% NativeForeign-born parent 1,116 53.5% Native971 46.5% Foreign-born
Grandparents responsible for own grandchildren in Apopka
Grandparents (30 to 59 years) White / Caucasian 10 10.2% Responsible for grandchildren85 89.8% Not responsible for grandchildrenBlack or African American 67 71.3% Responsible for grandchildren27 28.7% Not responsible for grandchildrenOther race 19 100.0% Responsible for grandchildrenTwo or more races 372 100.0% Not responsible for grandchildrenWhite alone, not Hispanic / Latino 11 19.8% Responsible for grandchildren46 80.2% Not responsible for grandchildrenHispanic or Latino 10 3.4% Responsible for grandchildren288 96.6% Not responsible for grandchildrenGrandparents (60 years and over) White / Caucasian 37 15.5% Responsible for grandchildren201 84.5% Not responsible for grandchildrenBlack or African American 41 17.2% Responsible for grandchildren199 82.8% Not responsible for grandchildrenTwo or more races 28 100.0% Not responsible for grandchildrenWhite alone, not Hispanic / Latino 46 23.7% Responsible for grandchildren150 76.3% Not responsible for grandchildrenHispanic or Latino 22 12.7% Responsible for grandchildren148 87.3% Not responsible for grandchildren