Races in Baldwin, Georgia (GA) Detailed Stats
Data:
Races - White alone (%)
Races - White alone (% change since 2000)
Races - Black alone (%)
Races - Black alone (% change since 2000)
Races - American Indian alone (%)
Races - American Indian alone (% change since 2000)
Races - Asian alone (%)
Races - Asian alone (% change since 2000)
Races - Hispanic (%)
Races - Hispanic (% change since 2000)
Races - Native Hawaiian and Other Pacific Islander alone (%)
Races - Native Hawaiian and Other Pacific Islander alone (% change since 2000)
Races - Two or more races(%)
Races - Two or more races(% change since 2000)
Races - Other race alone (%)
Races - Other race alone (% change since 2000)
Racial diversity
Place of birth - Born in state of residence (%)
Place of birth - Born in state of residence (%) - White
Place of birth - Born in state of residence (%) - Black or African American
Place of birth - Born in state of residence (%) - Asian
Place of birth - Born in state of residence (%) - Hispanic or Latino
Place of birth - Born in state of residence (%) - American Indian and Alaska Native
Place of birth - Born in state of residence (%) - Multirace
Place of birth - Born in state of residence (%) - Other Race
Place of birth - Born in other state (%)
Place of birth - Born in other state (%) - White
Place of birth - Born in other state (%) - Black or African American
Place of birth - Born in other state (%) - Asian
Place of birth - Born in other state (%) - Hispanic or Latino
Place of birth - Born in other state (%) - American Indian and Alaska Native
Place of birth - Born in other state (%) - Multirace
Place of birth - Born in other state (%) - Other Race
Place of birth - Native, outside of US (%)
Place of birth - Native, outside of US (%) - White
Place of birth - Native, outside of US (%) - Black or African American
Place of birth - Native, outside of US (%) - Asian
Place of birth - Native, outside of US (%) - Hispanic or Latino
Place of birth - Native, outside of US (%) - American Indian and Alaska Native
Place of birth - Native, outside of US (%) - Multirace
Place of birth - Native, outside of US (%) - Other Race
Place of birth - Foreign born (%)
Place of birth - Foreign born (%) - White
Place of birth - Foreign born (%) - Black or African American
Place of birth - Foreign born (%) - Asian
Place of birth - Foreign born (%) - Hispanic or Latino
Place of birth - Foreign born (%) - American Indian and Alaska Native
Place of birth - Foreign born (%) - Multirace
Place of birth - Foreign born (%) - Other Race
Residents speaking English at home (%)
Residents speaking English at home - Born in the United States (%)
Residents speaking English at home - Native, born elsewhere (%)
Residents speaking English at home - Foreign born (%)
Residents speaking Spanish at home (%)
Residents speaking Spanish at home - Born in the United States (%)
Residents speaking Spanish at home - Native, born elsewhere (%)
Residents speaking Spanish at home - Foreign born (%)
Residents speaking other language at home (%)
Residents speaking other language at home - Born in the United States (%)
Residents speaking other language at home - Native, born elsewhere (%)
Residents speaking other language at home - Foreign born (%)
Marital status - Never married (%)
Marital status - Now married (%)
Marital status - Separated (%)
Marital status - Widowed (%)
Marital status - Divorced (%)
Ancestries Reported - Arab (%)
Ancestries Reported - Czech (%)
Ancestries Reported - Danish (%)
Ancestries Reported - Dutch (%)
Ancestries Reported - English (%)
Ancestries Reported - French (%)
Ancestries Reported - French Canadian (%)
Ancestries Reported - German (%)
Ancestries Reported - Greek (%)
Ancestries Reported - Hungarian (%)
Ancestries Reported - Irish (%)
Ancestries Reported - Italian (%)
Ancestries Reported - Lithuanian (%)
Ancestries Reported - Norwegian (%)
Ancestries Reported - Polish (%)
Ancestries Reported - Portuguese (%)
Ancestries Reported - Russian (%)
Ancestries Reported - Scotch-Irish (%)
Ancestries Reported - Scottish (%)
Ancestries Reported - Slovak (%)
Ancestries Reported - Subsaharan African (%)
Ancestries Reported - Swedish (%)
Ancestries Reported - Swiss (%)
Ancestries Reported - Ukrainian (%)
Ancestries Reported - United States (%)
Ancestries Reported - Welsh (%)
Ancestries Reported - West Indian (%)
Ancestries Reported - Other (%)
Geographical mobility - Same house 1 year ago (%)
Geographical mobility - Same house 1 year ago (%) - White
Geographical mobility - Same house 1 year ago (%) - Black or African American
Geographical mobility - Same house 1 year ago (%) - Asian
Geographical mobility - Same house 1 year ago (%) - Hispanic or Latino
Geographical mobility - Same house 1 year ago (%) - American Indian and Alaska Native
Geographical mobility - Same house 1 year ago (%) - Multirace
Geographical mobility - Same house 1 year ago (%) - Other Race
Geographical mobility - Moved within same county (%)
Geographical mobility - Moved within same county (%) - White
Geographical mobility - Moved within same county (%) - Black or African American
Geographical mobility - Moved within same county (%) - Asian
Geographical mobility - Moved within same county (%) - Hispanic or Latino
Geographical mobility - Moved within same county (%) - American Indian and Alaska Native
Geographical mobility - Moved within same county (%) - Multirace
Geographical mobility - Moved within same county (%) - Other Race
Geographical mobility - Moved from different county within same state (%)
Geographical mobility - Moved from different county within same state (%) - White
Geographical mobility - Moved from different county within same state (%) - Black or African American
Geographical mobility - Moved from different county within same state (%) - Asian
Geographical mobility - Moved from different county within same state (%) - Hispanic or Latino
Geographical mobility - Moved from different county within same state (%) - American Indian and Alaska Native
Geographical mobility - Moved from different county within same state (%) - Multirace
Geographical mobility - Moved from different county within same state (%) - Other Race
Geographical mobility - Moved from different state (%)
Geographical mobility - Moved from different state (%) - White
Geographical mobility - Moved from different state (%) - Black or African American
Geographical mobility - Moved from different state (%) - Asian
Geographical mobility - Moved from different state (%) - Hispanic or Latino
Geographical mobility - Moved from different state (%) - American Indian and Alaska Native
Geographical mobility - Moved from different state (%) - Multirace
Geographical mobility - Moved from different state (%) - Other Race
Geographical mobility - Moved from abroad (%)
Geographical mobility - Moved from abroad (%) - White
Geographical mobility - Moved from abroad (%) - Black or African American
Geographical mobility - Moved from abroad (%) - Asian
Geographical mobility - Moved from abroad (%) - Hispanic or Latino
Geographical mobility - Moved from abroad (%) - American Indian and Alaska Native
Geographical mobility - Moved from abroad (%) - Multirace
Geographical mobility - Moved from abroad (%) - Other Race
Place of birth for the foreign-born population - Ireland (%)
Place of birth for the foreign-born population - Denmark (%)
Place of birth for the foreign-born population - Norway (%)
Place of birth for the foreign-born population - Sweden (%)
Place of birth for the foreign-born population - United Kingdom (%)
Place of birth for the foreign-born population - England (%)
Place of birth for the foreign-born population - Scotland (%)
Place of birth for the foreign-born population - Other Northern Europe (%)
Place of birth for the foreign-born population - Austria (%)
Place of birth for the foreign-born population - Belgium (%)
Place of birth for the foreign-born population - France (%)
Place of birth for the foreign-born population - Germany (%)
Place of birth for the foreign-born population - Netherlands (%)
Place of birth for the foreign-born population - Switzerland (%)
Place of birth for the foreign-born population - Other Western Europe (%)
Place of birth for the foreign-born population - Greece (%)
Place of birth for the foreign-born population - Italy (%)
Place of birth for the foreign-born population - Portugal (%)
Place of birth for the foreign-born population - Spain (%)
Place of birth for the foreign-born population - Other Southern Europe (%)
Place of birth for the foreign-born population - Albania (%)
Place of birth for the foreign-born population - Belarus (%)
Place of birth for the foreign-born population - Bosnia and Herzegovina (%)
Place of birth for the foreign-born population - Bulgaria (%)
Place of birth for the foreign-born population - Croatia (%)
Place of birth for the foreign-born population - Czechoslovakia (%)
Place of birth for the foreign-born population - Hungary (%)
Place of birth for the foreign-born population - Latvia (%)
Place of birth for the foreign-born population - Lithuania (%)
Place of birth for the foreign-born population - North Macedonia (Macedonia) (%)
Place of birth for the foreign-born population - Moldova (%)
Place of birth for the foreign-born population - Poland (%)
Place of birth for the foreign-born population - Romania (%)
Place of birth for the foreign-born population - Russia (%)
Place of birth for the foreign-born population - Serbia (%)
Place of birth for the foreign-born population - Ukraine (%)
Place of birth for the foreign-born population - Other Eastern Europe (%)
Place of birth for the foreign-born population - China (%)
Place of birth for the foreign-born population - Hong Kong (%)
Place of birth for the foreign-born population - Taiwan (%)
Place of birth for the foreign-born population - Japan (%)
Place of birth for the foreign-born population - Korea (%)
Place of birth for the foreign-born population - Other Eastern Asia (%)
Place of birth for the foreign-born population - Afghanistan (%)
Place of birth for the foreign-born population - Bangladesh (%)
Place of birth for the foreign-born population - India (%)
Place of birth for the foreign-born population - Iran (%)
Place of birth for the foreign-born population - Kazakhstan (%)
Place of birth for the foreign-born population - Nepal (%)
Place of birth for the foreign-born population - Pakistan (%)
Place of birth for the foreign-born population - Sri Lanka (%)
Place of birth for the foreign-born population - Uzbekistan (%)
Place of birth for the foreign-born population - Other South Central Asia (%)
Place of birth for the foreign-born population - Burma (%)
Place of birth for the foreign-born population - Cambodia (%)
Place of birth for the foreign-born population - Indonesia (%)
Place of birth for the foreign-born population - Laos (%)
Place of birth for the foreign-born population - Malaysia (%)
Place of birth for the foreign-born population - Philippines (%)
Place of birth for the foreign-born population - Singapore (%)
Place of birth for the foreign-born population - Thailand (%)
Place of birth for the foreign-born population - Vietnam (%)
Place of birth for the foreign-born population - Other South Eastern Asia (%)
Place of birth for the foreign-born population - Armenia (%)
Place of birth for the foreign-born population - Iraq (%)
Place of birth for the foreign-born population - Israel (%)
Place of birth for the foreign-born population - Jordan (%)
Place of birth for the foreign-born population - Kuwait (%)
Place of birth for the foreign-born population - Lebanon (%)
Place of birth for the foreign-born population - Saudi Arabia (%)
Place of birth for the foreign-born population - Syria (%)
Place of birth for the foreign-born population - Turkey (%)
Place of birth for the foreign-born population - Yemen (%)
Place of birth for the foreign-born population - Other Western Asia (%)
Place of birth for the foreign-born population - Eritrea (%)
Place of birth for the foreign-born population - Ethiopia (%)
Place of birth for the foreign-born population - Kenya (%)
Place of birth for the foreign-born population - Somalia (%)
Place of birth for the foreign-born population - Uganda (%)
Place of birth for the foreign-born population - Zimbabwe (%)
Place of birth for the foreign-born population - Other Eastern Africa (%)
Place of birth for the foreign-born population - Cameroon (%)
Place of birth for the foreign-born population - Congo (%)
Place of birth for the foreign-born population - Democratic Republic of Congo (Zaire) (%)
Place of birth for the foreign-born population - Other Middle Africa (%)
Place of birth for the foreign-born population - Egypt (%)
Place of birth for the foreign-born population - Morocco (%)
Place of birth for the foreign-born population - Sudan (%)
Place of birth for the foreign-born population - Other Northern Africa (%)
Place of birth for the foreign-born population - South Africa (%)
Place of birth for the foreign-born population - Other Southern Africa (%)
Place of birth for the foreign-born population - Cabo Verde (%)
Place of birth for the foreign-born population - Ghana (%)
Place of birth for the foreign-born population - Liberia (%)
Place of birth for the foreign-born population - Nigeria (%)
Place of birth for the foreign-born population - Senegal (%)
Place of birth for the foreign-born population - Sierra Leone (%)
Place of birth for the foreign-born population - Other Western Africa (%)
Place of birth for the foreign-born population - Australia (%)
Place of birth for the foreign-born population - New Zealand (%)
Place of birth for the foreign-born population - Fiji (%)
Place of birth for the foreign-born population - Micronesia (%)
Place of birth for the foreign-born population - Bahamas (%)
Place of birth for the foreign-born population - Barbados (%)
Place of birth for the foreign-born population - Cuba (%)
Place of birth for the foreign-born population - Dominica (%)
Place of birth for the foreign-born population - Dominican Republic (%)
Place of birth for the foreign-born population - Grenada (%)
Place of birth for the foreign-born population - Haiti (%)
Place of birth for the foreign-born population - Jamaica (%)
Place of birth for the foreign-born population - St. Vincent and the Grenadines (%)
Place of birth for the foreign-born population - Trinidad and Tobago (%)
Place of birth for the foreign-born population - West Indies (%)
Place of birth for the foreign-born population - Other Caribbean (%)
Place of birth for the foreign-born population - Belize (%)
Place of birth for the foreign-born population - Costa Rica (%)
Place of birth for the foreign-born population - El Salvador (%)
Place of birth for the foreign-born population - Guatemala (%)
Place of birth for the foreign-born population - Honduras (%)
Place of birth for the foreign-born population - Mexico (%)
Place of birth for the foreign-born population - Nicaragua (%)
Place of birth for the foreign-born population - Panama (%)
Place of birth for the foreign-born population - Other Central America (%)
Place of birth for the foreign-born population - Argentina (%)
Place of birth for the foreign-born population - Bolivia (%)
Place of birth for the foreign-born population - Brazil (%)
Place of birth for the foreign-born population - Chile (%)
Place of birth for the foreign-born population - Colombia (%)
Place of birth for the foreign-born population - Ecuador (%)
Place of birth for the foreign-born population - Guyana (%)
Place of birth for the foreign-born population - Peru (%)
Place of birth for the foreign-born population - Uruguay (%)
Place of birth for the foreign-born population - Venezuela (%)
Place of birth for the foreign-born population - Other South America (%)
Place of birth for the foreign-born population - Canada (%)
Place of birth for the foreign-born population - Other Northern America (%)
Place of birth for the foreign-born population - Other (%)
Latest news about races in Baldwin, GA collected exclusively by city-data.com from local newspapers, TV, and radio stations
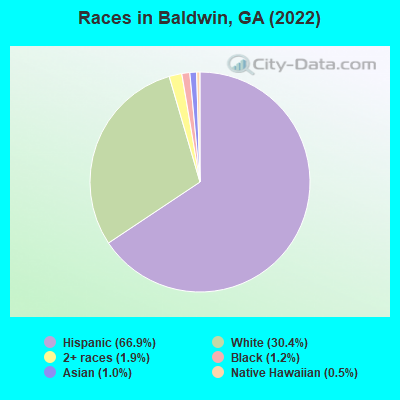
According to 2022 data, the most numerous races in Baldwin, GA are White alone (1,182 residents), Black alone (47 residents), and Hispanic (2,597 residents). 37.9% of Baldwin residents speak English at home. 31.7% of Baldwin, GA residents are foreign-born (29.3% born in Latin America), which is 68.4% greater than the foreign-born rate of 10.0% across the entire state of Georgia.
Race distribution in Baldwin
2000 2022
5,128,661 62.6% White alone 2,331,465 28.5% Black alone 435,227 5.3% Hispanic 171,513 2.1% Asian alone 87,364 1.1% Two or more races 17,670 0.2% American Indian alone 11,275 0.1% Other race alone 3,278 0.04% Native Hawaiian and Other
5,415,657 49.6% White alone 3,349,240 30.7% Black alone 1,132,604 10.4% Hispanic 479,156 4.4% Asian alone 462,923 4.2% Two or more races 54,416 0.5% Other race alone 11,923 0.1% American Indian alone 6,957 0.06% Native Hawaiian and Other
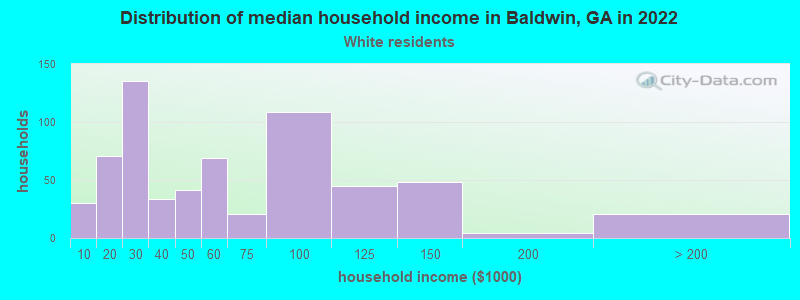
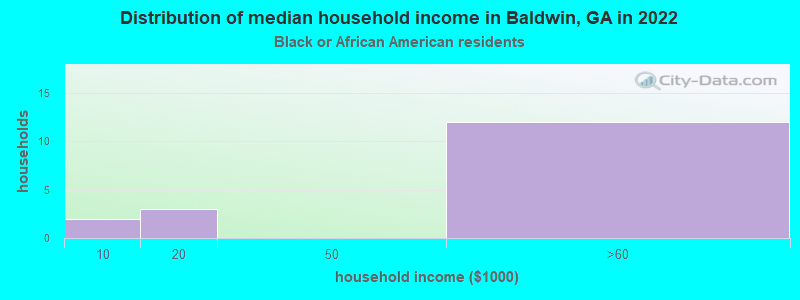
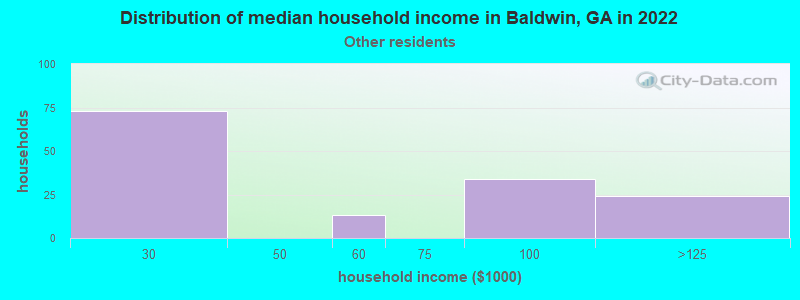
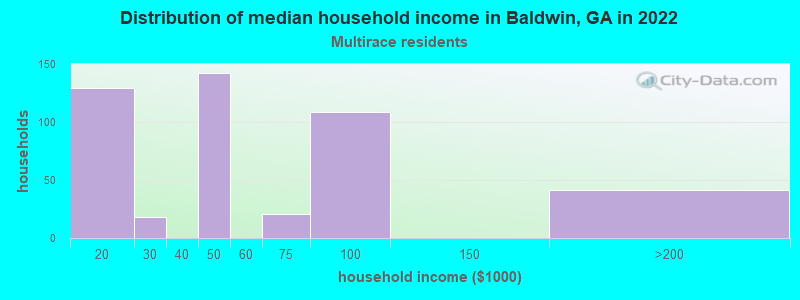
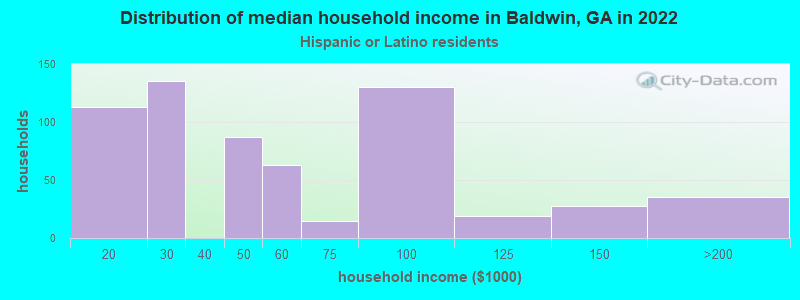
Income and house value in Baldwin Median household income in 2022 $48,356 White non-Hispanic householders$52,875 Black householders$46,738 Two or more races householders$50,381 Hispanic or Latino race householdersMedian 2022 house value $214,963 White Non-Hispanic householders $290,464 Asian householders$228,428 Some other race householders$230,832 Hispanic or Latino householders
Median age by race in Baldwin
38.2 Median age for White residents38.3 37.7 75.8 Median age for Black or African American residents63.7 -683,287,164.6 7.7 Median age for American Indian / Alaska Native residents7.3 -597,938,143.7 55.3 Median age for Asian residents-692,810,456.8 -684,636,117.9 -657,243,815.6 Median age for Native Hawaiian / Pacific Islander residents-693,227,090.9 -776,776,776.0 17.9 Median age for Other race residents11.4 24.2 28.1 Median age for Two or more races residents18.5 35.6 45.8 Median age for White alone residents45.3 46.8 23.6 Median age for Hispanic or Latino residents12.5 30.3
Owner/renter occupied households by race in Baldwin
House owners and renters - White residents 368 58.1% Owner occupied266 41.9% Renter occupiedHouse owners and renters - Black or African American residents 14 73.9% Owner occupied5 26.1% Renter occupiedHouse owners and renters - American Indian / Alaska Native residents 37 100.0% Owner occupiedHouse owners and renters - Asian residents 16 69.8% Owner occupied7 30.2% Renter occupiedHouse owners and renters - Other race residents 90 58.5% Owner occupied64 41.5% Renter occupiedHouse owners and renters - Two or more races residents 173 36.8% Owner occupied297 63.2% Renter occupiedHouse owners and renters - White alone residents 325 64.1% Owner occupied182 35.9% Renter occupiedHouse owners and renters - Hispanic or Latino residents 258 41.8% Owner occupied360 58.2% Renter occupied
Language usage in Baldwin
English speakers - Total 37.9% of residents of Baldwin speak English at home.
60.0% of residents speak Spanish at home 1,067 52.3% Speak English very well973 47.7% Speak English less than very well2.1% of residents speak other language at home 37 52.1% Speak English very well34 47.9% Speak English less than very well
English speakers - Born in the United States 73.5% of residents of Baldwin speak English at home.
25.3% of residents speak Spanish at home 98 92.5% Speak English very well8 7.5% Speak English less than very well
English speakers - Native, born elsewhere 50.0% of residents of Baldwin speak English at home.
56.2% of residents speak Spanish at home 9 100.0% Speak English less than very well
English speakers - Foreign-born 2.4% of residents of Baldwin speak English at home.
91.2% of residents speak Spanish at home 263 23.4% Speak English very well861 76.6% Speak English less than very well4.7% of residents speak other language at home 24 41.4% Speak English very well34 58.6% Speak English less than very well
White (Caucasian) - Speak only English Native:
86.4% (1,069)Foreign-born:
2.0% (3)
White (Caucasian) - Speak another language Native:
10.3% (127)Foreign-born:
87.7% (141)
American Indian / Alaska Native - Speak another language Native:
63.7% (102)Foreign-born:
100.0% (77)
Asian - Speak another language Native:
100.0% (13)Foreign-born:
100.0% (26)
Other race - Speak another language Native:
100.0% (299)Foreign-born:
99.0% (409)
Two or more races - Speak only English Native:
11.5% (74)Foreign-born:
4.9% (39)
Two or more races - Speak another language Native:
86.8% (558)Foreign-born:
94.7% (738)
White alone - Speak only English Native:
99.7% (1,061)Foreign-born:
22.3% (4)
White alone - Speak another language Native:
0.4% (4)Foreign-born:
77.5% (13)
Hispanic or Latino - Speak only English Native:
8.2% (85)Foreign-born:
2.3% (27)
Hispanic or Latino - Speak another language Native:
89.5% (932)Foreign-born:
97.6% (1,138)
Foreign-born residents in Baldwin 1,231 residents are foreign born (29.3% Latin America ).
This city:
31.7%Georgia:
10.4%
Marital status for residents in Baldwin Marital status - White (Caucasian) population 15 years and over
Males 25.1% Never married47.5% Now married0.0% Separated13.2% Widowed14.2% DivorcedFemales 22.9% Never married44.0% Now married1.0% Separated16.9% Widowed15.2% DivorcedWomen who gave birth in the past 12 months Now married:
100.0% (8)Unmarried:
0.0% (0)
Women who did not give birth in the past 12 months Now married:
50.1% (187)Unmarried:
49.9% (186)
Marital status - Black or African American population 15 years and over
Males 5.3% Never married68.4% Now married0.0% Separated0.0% Widowed26.3% DivorcedFemales 0.0% Never married100.0% Now married0.0% Separated0.0% Widowed0.0% DivorcedMarital status - American Indian / Alaska Native population 15 years and over
Males 0.0% Never married100.0% Now married0.0% Separated0.0% Widowed0.0% DivorcedFemales 0.0% Never married100.0% Now married0.0% Separated0.0% Widowed0.0% DivorcedWomen who did not give birth in the past 12 months Now married:
100.0% (68)Unmarried:
0.0% (0)
Marital status - Asian population 15 years and over
Males 0.0% Never married36.8% Now married0.0% Separated0.0% Widowed63.2% DivorcedFemales 0.0% Never married22.2% Now married0.0% Separated77.8% Widowed0.0% DivorcedMarital status - Other race population 15 years and over
Males 32.7% Never married58.3% Now married0.0% Separated0.0% Widowed8.9% DivorcedFemales 44.6% Never married42.2% Now married13.2% Separated0.0% Widowed0.0% DivorcedWomen who gave birth in the past 12 months Now married:
100.0% (10)Unmarried:
0.0% (0)
Women who did not give birth in the past 12 months Now married:
50.2% (150)Unmarried:
49.8% (149)
Marital status - Two or more races population 15 years and over
Males 24.3% Never married74.7% Now married0.0% Separated0.0% Widowed1.0% DivorcedFemales 48.7% Never married24.6% Now married0.0% Separated7.0% Widowed19.8% DivorcedWomen who did not give birth in the past 12 months Now married:
26.9% (123)Unmarried:
73.1% (335)
Marital status - White alone, not Hispanic / Latino population 15 years and over
Males 23.9% Never married51.4% Now married0.0% Separated6.2% Widowed18.4% DivorcedFemales 12.5% Never married51.8% Now married1.3% Separated14.4% Widowed19.9% DivorcedWomen who gave birth in the past 12 months Now married:
100.0% (8)Unmarried:
0.0% (0)
Women who did not give birth in the past 12 months Now married:
75.7% (181)Unmarried:
24.3% (58)
Marital status - Hispanic or Latino population 15 years and over
Males 27.4% Never married62.1% Now married0.0% Separated8.0% Widowed2.5% DivorcedFemales 47.2% Never married31.3% Now married3.9% Separated8.1% Widowed9.4% DivorcedWomen who gave birth in the past 12 months Now married:
100.0% (9)Unmarried:
0.0% (0)
Women who did not give birth in the past 12 months Now married:
33.6% (261)Unmarried:
66.4% (515)
Ancestries in Baldwin
198 7.7% English194 7.5% American157 6.1% Irish37 1.4% French Canadian17 0.7% Scotch-Irish10 0.4% European10 0.4% German7 0.3% Eastern European6 0.2% Hungarian4 0.2% Scottish3 0.1% British3 0.1% Romanian3 0.1% Ghanaian
Children Nativity (place of birth) in Baldwin
Children under 6 years - Living with two parents Both parents native 57 100.0% NativeOne native, one foreign-born parent 241 100.0% NativeChildren under 6 years - Living with one parent Native parent 76 100.0% NativeForeign-born parent 108 100.0% NativeChildren 6 to 17 years - Living with two parents Both parents native 138 100.0% NativeBoth parents foreign-born 172 95.2% Native9 4.8% Foreign-bornOne native, one foreign-born parent 87 100.0% NativeChildren 6 to 17 years - Living with one parent Native parent 12 100.0% NativeForeign-born parent 403 50.3% Native398 49.7% Foreign-born
Grandparents responsible for own grandchildren in Baldwin
Grandparents (30 to 59 years) Other race 36 100.0% Not responsible for grandchildrenTwo or more races 84 100.0% Not responsible for grandchildrenHispanic or Latino 84 100.0% Not responsible for grandchildren
Grandparents (60 years and over)