Races in Bartow, Florida (FL) Detailed Stats
Data:
Races - White alone (%)
Races - White alone (% change since 2000)
Races - Black alone (%)
Races - Black alone (% change since 2000)
Races - American Indian alone (%)
Races - American Indian alone (% change since 2000)
Races - Asian alone (%)
Races - Asian alone (% change since 2000)
Races - Hispanic (%)
Races - Hispanic (% change since 2000)
Races - Native Hawaiian and Other Pacific Islander alone (%)
Races - Native Hawaiian and Other Pacific Islander alone (% change since 2000)
Races - Two or more races(%)
Races - Two or more races(% change since 2000)
Races - Other race alone (%)
Races - Other race alone (% change since 2000)
Racial diversity
Place of birth - Born in state of residence (%)
Place of birth - Born in state of residence (%) - White
Place of birth - Born in state of residence (%) - Black or African American
Place of birth - Born in state of residence (%) - Asian
Place of birth - Born in state of residence (%) - Hispanic or Latino
Place of birth - Born in state of residence (%) - American Indian and Alaska Native
Place of birth - Born in state of residence (%) - Multirace
Place of birth - Born in state of residence (%) - Other Race
Place of birth - Born in other state (%)
Place of birth - Born in other state (%) - White
Place of birth - Born in other state (%) - Black or African American
Place of birth - Born in other state (%) - Asian
Place of birth - Born in other state (%) - Hispanic or Latino
Place of birth - Born in other state (%) - American Indian and Alaska Native
Place of birth - Born in other state (%) - Multirace
Place of birth - Born in other state (%) - Other Race
Place of birth - Native, outside of US (%)
Place of birth - Native, outside of US (%) - White
Place of birth - Native, outside of US (%) - Black or African American
Place of birth - Native, outside of US (%) - Asian
Place of birth - Native, outside of US (%) - Hispanic or Latino
Place of birth - Native, outside of US (%) - American Indian and Alaska Native
Place of birth - Native, outside of US (%) - Multirace
Place of birth - Native, outside of US (%) - Other Race
Place of birth - Foreign born (%)
Place of birth - Foreign born (%) - White
Place of birth - Foreign born (%) - Black or African American
Place of birth - Foreign born (%) - Asian
Place of birth - Foreign born (%) - Hispanic or Latino
Place of birth - Foreign born (%) - American Indian and Alaska Native
Place of birth - Foreign born (%) - Multirace
Place of birth - Foreign born (%) - Other Race
Residents speaking English at home (%)
Residents speaking English at home - Born in the United States (%)
Residents speaking English at home - Native, born elsewhere (%)
Residents speaking English at home - Foreign born (%)
Residents speaking Spanish at home (%)
Residents speaking Spanish at home - Born in the United States (%)
Residents speaking Spanish at home - Native, born elsewhere (%)
Residents speaking Spanish at home - Foreign born (%)
Residents speaking other language at home (%)
Residents speaking other language at home - Born in the United States (%)
Residents speaking other language at home - Native, born elsewhere (%)
Residents speaking other language at home - Foreign born (%)
Marital status - Never married (%)
Marital status - Now married (%)
Marital status - Separated (%)
Marital status - Widowed (%)
Marital status - Divorced (%)
Ancestries Reported - Arab (%)
Ancestries Reported - Czech (%)
Ancestries Reported - Danish (%)
Ancestries Reported - Dutch (%)
Ancestries Reported - English (%)
Ancestries Reported - French (%)
Ancestries Reported - French Canadian (%)
Ancestries Reported - German (%)
Ancestries Reported - Greek (%)
Ancestries Reported - Hungarian (%)
Ancestries Reported - Irish (%)
Ancestries Reported - Italian (%)
Ancestries Reported - Lithuanian (%)
Ancestries Reported - Norwegian (%)
Ancestries Reported - Polish (%)
Ancestries Reported - Portuguese (%)
Ancestries Reported - Russian (%)
Ancestries Reported - Scotch-Irish (%)
Ancestries Reported - Scottish (%)
Ancestries Reported - Slovak (%)
Ancestries Reported - Subsaharan African (%)
Ancestries Reported - Swedish (%)
Ancestries Reported - Swiss (%)
Ancestries Reported - Ukrainian (%)
Ancestries Reported - United States (%)
Ancestries Reported - Welsh (%)
Ancestries Reported - West Indian (%)
Ancestries Reported - Other (%)
Geographical mobility - Same house 1 year ago (%)
Geographical mobility - Same house 1 year ago (%) - White
Geographical mobility - Same house 1 year ago (%) - Black or African American
Geographical mobility - Same house 1 year ago (%) - Asian
Geographical mobility - Same house 1 year ago (%) - Hispanic or Latino
Geographical mobility - Same house 1 year ago (%) - American Indian and Alaska Native
Geographical mobility - Same house 1 year ago (%) - Multirace
Geographical mobility - Same house 1 year ago (%) - Other Race
Geographical mobility - Moved within same county (%)
Geographical mobility - Moved within same county (%) - White
Geographical mobility - Moved within same county (%) - Black or African American
Geographical mobility - Moved within same county (%) - Asian
Geographical mobility - Moved within same county (%) - Hispanic or Latino
Geographical mobility - Moved within same county (%) - American Indian and Alaska Native
Geographical mobility - Moved within same county (%) - Multirace
Geographical mobility - Moved within same county (%) - Other Race
Geographical mobility - Moved from different county within same state (%)
Geographical mobility - Moved from different county within same state (%) - White
Geographical mobility - Moved from different county within same state (%) - Black or African American
Geographical mobility - Moved from different county within same state (%) - Asian
Geographical mobility - Moved from different county within same state (%) - Hispanic or Latino
Geographical mobility - Moved from different county within same state (%) - American Indian and Alaska Native
Geographical mobility - Moved from different county within same state (%) - Multirace
Geographical mobility - Moved from different county within same state (%) - Other Race
Geographical mobility - Moved from different state (%)
Geographical mobility - Moved from different state (%) - White
Geographical mobility - Moved from different state (%) - Black or African American
Geographical mobility - Moved from different state (%) - Asian
Geographical mobility - Moved from different state (%) - Hispanic or Latino
Geographical mobility - Moved from different state (%) - American Indian and Alaska Native
Geographical mobility - Moved from different state (%) - Multirace
Geographical mobility - Moved from different state (%) - Other Race
Geographical mobility - Moved from abroad (%)
Geographical mobility - Moved from abroad (%) - White
Geographical mobility - Moved from abroad (%) - Black or African American
Geographical mobility - Moved from abroad (%) - Asian
Geographical mobility - Moved from abroad (%) - Hispanic or Latino
Geographical mobility - Moved from abroad (%) - American Indian and Alaska Native
Geographical mobility - Moved from abroad (%) - Multirace
Geographical mobility - Moved from abroad (%) - Other Race
Place of birth for the foreign-born population - Ireland (%)
Place of birth for the foreign-born population - Denmark (%)
Place of birth for the foreign-born population - Norway (%)
Place of birth for the foreign-born population - Sweden (%)
Place of birth for the foreign-born population - United Kingdom (%)
Place of birth for the foreign-born population - England (%)
Place of birth for the foreign-born population - Scotland (%)
Place of birth for the foreign-born population - Other Northern Europe (%)
Place of birth for the foreign-born population - Austria (%)
Place of birth for the foreign-born population - Belgium (%)
Place of birth for the foreign-born population - France (%)
Place of birth for the foreign-born population - Germany (%)
Place of birth for the foreign-born population - Netherlands (%)
Place of birth for the foreign-born population - Switzerland (%)
Place of birth for the foreign-born population - Other Western Europe (%)
Place of birth for the foreign-born population - Greece (%)
Place of birth for the foreign-born population - Italy (%)
Place of birth for the foreign-born population - Portugal (%)
Place of birth for the foreign-born population - Spain (%)
Place of birth for the foreign-born population - Other Southern Europe (%)
Place of birth for the foreign-born population - Albania (%)
Place of birth for the foreign-born population - Belarus (%)
Place of birth for the foreign-born population - Bosnia and Herzegovina (%)
Place of birth for the foreign-born population - Bulgaria (%)
Place of birth for the foreign-born population - Croatia (%)
Place of birth for the foreign-born population - Czechoslovakia (%)
Place of birth for the foreign-born population - Hungary (%)
Place of birth for the foreign-born population - Latvia (%)
Place of birth for the foreign-born population - Lithuania (%)
Place of birth for the foreign-born population - North Macedonia (Macedonia) (%)
Place of birth for the foreign-born population - Moldova (%)
Place of birth for the foreign-born population - Poland (%)
Place of birth for the foreign-born population - Romania (%)
Place of birth for the foreign-born population - Russia (%)
Place of birth for the foreign-born population - Serbia (%)
Place of birth for the foreign-born population - Ukraine (%)
Place of birth for the foreign-born population - Other Eastern Europe (%)
Place of birth for the foreign-born population - China (%)
Place of birth for the foreign-born population - Hong Kong (%)
Place of birth for the foreign-born population - Taiwan (%)
Place of birth for the foreign-born population - Japan (%)
Place of birth for the foreign-born population - Korea (%)
Place of birth for the foreign-born population - Other Eastern Asia (%)
Place of birth for the foreign-born population - Afghanistan (%)
Place of birth for the foreign-born population - Bangladesh (%)
Place of birth for the foreign-born population - India (%)
Place of birth for the foreign-born population - Iran (%)
Place of birth for the foreign-born population - Kazakhstan (%)
Place of birth for the foreign-born population - Nepal (%)
Place of birth for the foreign-born population - Pakistan (%)
Place of birth for the foreign-born population - Sri Lanka (%)
Place of birth for the foreign-born population - Uzbekistan (%)
Place of birth for the foreign-born population - Other South Central Asia (%)
Place of birth for the foreign-born population - Burma (%)
Place of birth for the foreign-born population - Cambodia (%)
Place of birth for the foreign-born population - Indonesia (%)
Place of birth for the foreign-born population - Laos (%)
Place of birth for the foreign-born population - Malaysia (%)
Place of birth for the foreign-born population - Philippines (%)
Place of birth for the foreign-born population - Singapore (%)
Place of birth for the foreign-born population - Thailand (%)
Place of birth for the foreign-born population - Vietnam (%)
Place of birth for the foreign-born population - Other South Eastern Asia (%)
Place of birth for the foreign-born population - Armenia (%)
Place of birth for the foreign-born population - Iraq (%)
Place of birth for the foreign-born population - Israel (%)
Place of birth for the foreign-born population - Jordan (%)
Place of birth for the foreign-born population - Kuwait (%)
Place of birth for the foreign-born population - Lebanon (%)
Place of birth for the foreign-born population - Saudi Arabia (%)
Place of birth for the foreign-born population - Syria (%)
Place of birth for the foreign-born population - Turkey (%)
Place of birth for the foreign-born population - Yemen (%)
Place of birth for the foreign-born population - Other Western Asia (%)
Place of birth for the foreign-born population - Eritrea (%)
Place of birth for the foreign-born population - Ethiopia (%)
Place of birth for the foreign-born population - Kenya (%)
Place of birth for the foreign-born population - Somalia (%)
Place of birth for the foreign-born population - Uganda (%)
Place of birth for the foreign-born population - Zimbabwe (%)
Place of birth for the foreign-born population - Other Eastern Africa (%)
Place of birth for the foreign-born population - Cameroon (%)
Place of birth for the foreign-born population - Congo (%)
Place of birth for the foreign-born population - Democratic Republic of Congo (Zaire) (%)
Place of birth for the foreign-born population - Other Middle Africa (%)
Place of birth for the foreign-born population - Egypt (%)
Place of birth for the foreign-born population - Morocco (%)
Place of birth for the foreign-born population - Sudan (%)
Place of birth for the foreign-born population - Other Northern Africa (%)
Place of birth for the foreign-born population - South Africa (%)
Place of birth for the foreign-born population - Other Southern Africa (%)
Place of birth for the foreign-born population - Cabo Verde (%)
Place of birth for the foreign-born population - Ghana (%)
Place of birth for the foreign-born population - Liberia (%)
Place of birth for the foreign-born population - Nigeria (%)
Place of birth for the foreign-born population - Senegal (%)
Place of birth for the foreign-born population - Sierra Leone (%)
Place of birth for the foreign-born population - Other Western Africa (%)
Place of birth for the foreign-born population - Australia (%)
Place of birth for the foreign-born population - New Zealand (%)
Place of birth for the foreign-born population - Fiji (%)
Place of birth for the foreign-born population - Micronesia (%)
Place of birth for the foreign-born population - Bahamas (%)
Place of birth for the foreign-born population - Barbados (%)
Place of birth for the foreign-born population - Cuba (%)
Place of birth for the foreign-born population - Dominica (%)
Place of birth for the foreign-born population - Dominican Republic (%)
Place of birth for the foreign-born population - Grenada (%)
Place of birth for the foreign-born population - Haiti (%)
Place of birth for the foreign-born population - Jamaica (%)
Place of birth for the foreign-born population - St. Vincent and the Grenadines (%)
Place of birth for the foreign-born population - Trinidad and Tobago (%)
Place of birth for the foreign-born population - West Indies (%)
Place of birth for the foreign-born population - Other Caribbean (%)
Place of birth for the foreign-born population - Belize (%)
Place of birth for the foreign-born population - Costa Rica (%)
Place of birth for the foreign-born population - El Salvador (%)
Place of birth for the foreign-born population - Guatemala (%)
Place of birth for the foreign-born population - Honduras (%)
Place of birth for the foreign-born population - Mexico (%)
Place of birth for the foreign-born population - Nicaragua (%)
Place of birth for the foreign-born population - Panama (%)
Place of birth for the foreign-born population - Other Central America (%)
Place of birth for the foreign-born population - Argentina (%)
Place of birth for the foreign-born population - Bolivia (%)
Place of birth for the foreign-born population - Brazil (%)
Place of birth for the foreign-born population - Chile (%)
Place of birth for the foreign-born population - Colombia (%)
Place of birth for the foreign-born population - Ecuador (%)
Place of birth for the foreign-born population - Guyana (%)
Place of birth for the foreign-born population - Peru (%)
Place of birth for the foreign-born population - Uruguay (%)
Place of birth for the foreign-born population - Venezuela (%)
Place of birth for the foreign-born population - Other South America (%)
Place of birth for the foreign-born population - Canada (%)
Place of birth for the foreign-born population - Other Northern America (%)
Place of birth for the foreign-born population - Other (%)
Latest news about races in Bartow, FL collected exclusively by city-data.com from local newspapers, TV, and radio stations
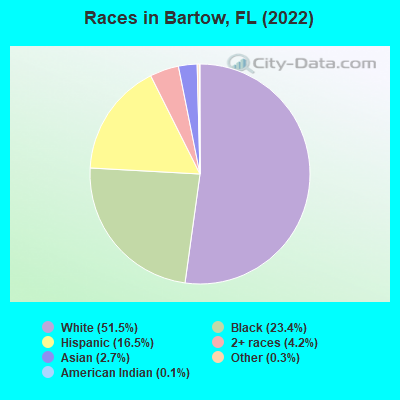
According to 2022 data, the most numerous races in Bartow, FL are White alone (10,700 residents), Hispanic (3,438 residents), and Black alone (4,866 residents). 83.3% of Bartow residents speak English at home. 5.3% of Bartow, FL residents are foreign-born (2.8% born in Latin America, 2.5% born in Asia), which is 295.9% less than the foreign-born rate of 21.0% across the entire state of Florida.
Race distribution in Bartow
2000 2022
10,458,509 65.4% White alone 2,682,715 16.8% Hispanic 2,264,268 14.2% Black alone 261,693 1.6% Asian alone 236,954 1.5% Two or more races 42,358 0.3% American Indian alone 28,994 0.2% Other race alone 6,887 0.04% Native Hawaiian and Other
11,309,403 50.8% White alone 6,025,039 27.1% Hispanic 3,241,015 14.6% Black alone 861,630 3.9% Two or more races 623,692 2.8% Asian alone 152,054 0.7% Other race alone 22,504 0.1% American Indian alone 9,486 0.04% Native Hawaiian and Other
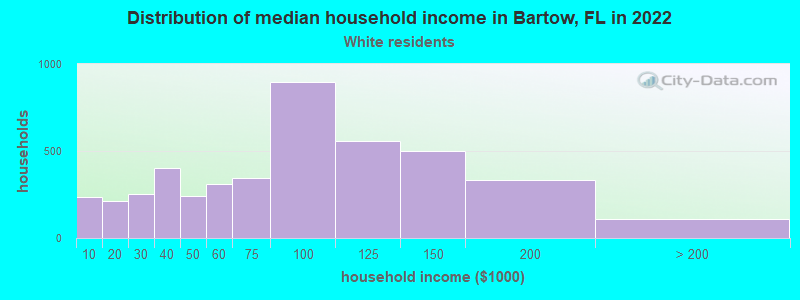
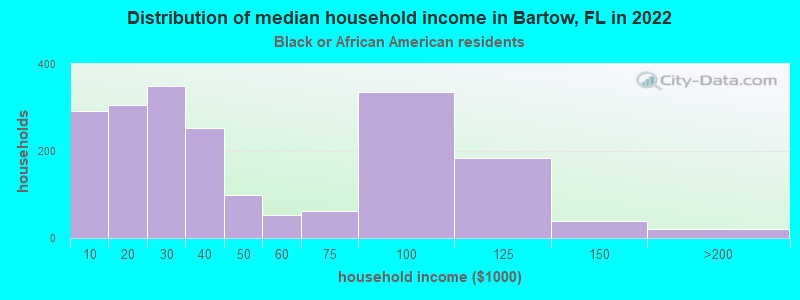
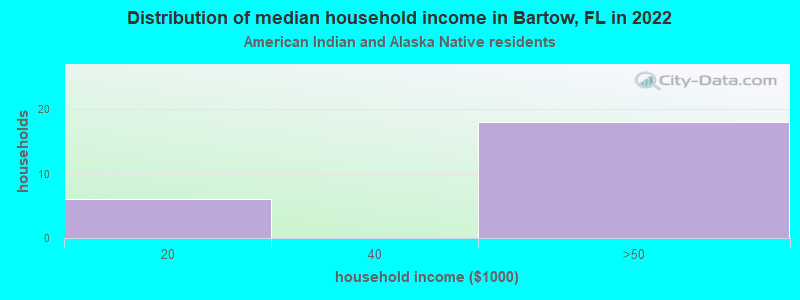
Income and house value in Bartow Median household income in 2022 $82,193 White non-Hispanic householders$29,953 Black householders$37,876 American Indian and Alaska Native householders$45,908 Some other race householders$48,972 Two or more races householders$45,441 Hispanic or Latino race householdersMedian 2022 house value $265,667 White Non-Hispanic householders$213,405 Black or African American householders$265,304 American Indian or Alaska Native householders $235,907 Asian householders$199,613 Native Hawaiian and other Pacific Islander householders$170,578 Some other race householders$125,575 Two or more races householders$240,625 Hispanic or Latino householders
Median age by race in Bartow
42.7 Median age for White residents42.8 42.7 33.1 Median age for Black or African American residents27.6 37.7 43.0 Median age for American Indian / Alaska Native residents42.5 43.4 51.0 Median age for Asian residents48.2 48.5 -679,849,340.2 Median age for Native Hawaiian / Pacific Islander residents-858,307,848.3 -443,298,968.6 23.5 Median age for Other race residents19.3 33.4 29.7 Median age for Two or more races residents31.2 30.9 42.0 Median age for White alone residents42.4 40.9 30.1 Median age for Hispanic or Latino residents26.1 31.7
Owner/renter occupied households by race in Bartow
House owners and renters - White residents 3,167 74.3% Owner occupied1,097 25.7% Renter occupiedHouse owners and renters - Black or African American residents 824 43.3% Owner occupied1,080 56.7% Renter occupiedHouse owners and renters - American Indian / Alaska Native residents 26 74.5% Owner occupied9 25.5% Renter occupiedHouse owners and renters - Asian residents 176 100.0% Owner occupiedHouse owners and renters - Other race residents 185 38.9% Owner occupied291 61.1% Renter occupiedHouse owners and renters - Two or more races residents 394 63.1% Owner occupied230 36.9% Renter occupiedHouse owners and renters - White alone residents 3,175 73.9% Owner occupied1,124 26.1% Renter occupiedHouse owners and renters - Hispanic or Latino residents 526 51.7% Owner occupied492 48.3% Renter occupied
Language usage in Bartow
English speakers - Total 83.3% of residents of Bartow speak English at home.
11.8% of residents speak Spanish at home 1,221 53.0% Speak English very well1,082 47.0% Speak English less than very well3.2% of residents speak other language at home 464 74.2% Speak English very well161 25.8% Speak English less than very well
English speakers - Born in the United States 95.6% of residents of Bartow speak English at home.
4.3% of residents speak Spanish at home 165 65.0% Speak English very well89 35.0% Speak English less than very well0.5% of residents speak other language at home 30 100.0% Speak English very well
English speakers - Native, born elsewhere 30.8% of residents of Bartow speak English at home.
69.0% of residents speak Spanish at home 296 44.0% Speak English very well376 56.0% Speak English less than very well
English speakers - Foreign-born 30.4% of residents of Bartow speak English at home.
39.9% of residents speak Spanish at home 31 6.1% Speak English very well478 93.9% Speak English less than very well31.1% of residents speak other language at home 289 72.8% Speak English very well108 27.2% Speak English less than very well
White (Caucasian) - Speak only English Native:
99.5% (10,234)Foreign-born:
23.3% (19)
White (Caucasian) - Speak another language Native:
3.0% (314)Foreign-born:
62.5% (51)
Black or African American - Speak only English Native:
97.7% (4,173)Foreign-born:
76.7% (59)
Black or African American - Speak another language Native:
2.4% (104)Foreign-born:
16.2% (12)
American Indian / Alaska Native - Speak another language Native:
70.6% (48)Foreign-born:
100.0% (33)
Asian - Speak only English Native:
30.4% (28)Foreign-born:
33.4% (149)
Asian - Speak another language Native:
72.1% (66)Foreign-born:
64.6% (287)
Other race - Speak another language Native:
77.5% (1,006)Foreign-born:
100.0% (214)
Two or more races - Speak only English Native:
66.3% (1,137)Foreign-born:
42.3% (211)
Two or more races - Speak another language Native:
32.8% (562)Foreign-born:
66.3% (332)
White alone - Speak only English Native:
99.1% (10,139)Foreign-born:
26.8% (21)
White alone - Speak another language Native:
0.9% (94)Foreign-born:
60.9% (47)
Hispanic or Latino - Speak another language Native:
64.8% (1,736)Foreign-born:
99.3% (453)
Foreign-born residents in Bartow 1,102 residents are foreign born (2.8% Latin America , 2.5% Asia ).
This city:
5.3%Florida:
21.1%
Marital status for residents in Bartow Marital status - White (Caucasian) population 15 years and over
Males 28.8% Never married50.2% Now married0.6% Separated4.4% Widowed15.9% DivorcedFemales 27.9% Never married43.6% Now married1.5% Separated10.7% Widowed16.3% DivorcedWomen who gave birth in the past 12 months Now married:
60.4% (70)Unmarried:
39.6% (46)
Women who did not give birth in the past 12 months Now married:
45.2% (1,157)Unmarried:
54.8% (1,401)
Marital status - Black or African American population 15 years and over
Males 59.9% Never married27.8% Now married0.0% Separated0.2% Widowed12.1% DivorcedFemales 48.7% Never married23.2% Now married6.8% Separated7.7% Widowed13.6% DivorcedWomen who gave birth in the past 12 months Now married:
61.2% (33)Unmarried:
38.8% (21)
Women who did not give birth in the past 12 months Now married:
21.5% (301)Unmarried:
78.5% (1,097)
Marital status - American Indian / Alaska Native population 15 years and over
Males 52.6% Never married47.4% Now married0.0% Separated0.0% Widowed0.0% DivorcedFemales 45.5% Never married0.0% Now married0.0% Separated0.0% Widowed54.5% DivorcedWomen who did not give birth in the past 12 months Now married:
0.0% (0)Unmarried:
100.0% (44)
Marital status - Asian population 15 years and over
Males 46.5% Never married28.5% Now married0.0% Separated13.3% Widowed11.7% DivorcedFemales 8.5% Never married55.9% Now married13.0% Separated15.3% Widowed7.3% DivorcedWomen who gave birth in the past 12 months Now married:
100.0% (28)Unmarried:
0.0% (0)
Women who did not give birth in the past 12 months Now married:
48.1% (27)Unmarried:
51.9% (29)
Marital status - Other race population 15 years and over
Males 45.2% Never married32.2% Now married8.9% Separated0.0% Widowed13.7% DivorcedFemales 67.0% Never married18.2% Now married0.0% Separated0.0% Widowed14.8% DivorcedWomen who gave birth in the past 12 months Now married:
0.0% (0)Unmarried:
100.0% (65)
Women who did not give birth in the past 12 months Now married:
15.6% (49)Unmarried:
84.4% (266)
Marital status - Two or more races population 15 years and over
Males 43.9% Never married45.1% Now married5.3% Separated1.4% Widowed4.3% DivorcedFemales 27.1% Never married42.7% Now married0.0% Separated5.5% Widowed24.7% DivorcedWomen who gave birth in the past 12 months Now married:
100.0% (74)Unmarried:
0.0% (0)
Women who did not give birth in the past 12 months Now married:
28.6% (178)Unmarried:
71.4% (445)
Marital status - White alone, not Hispanic / Latino population 15 years and over
Males 26.1% Never married51.5% Now married0.7% Separated4.8% Widowed17.0% DivorcedFemales 26.8% Never married44.0% Now married1.1% Separated10.7% Widowed17.5% DivorcedWomen who gave birth in the past 12 months Now married:
76.4% (81)Unmarried:
23.6% (25)
Women who did not give birth in the past 12 months Now married:
45.0% (1,229)Unmarried:
55.0% (1,504)
Marital status - Hispanic or Latino population 15 years and over
Males 47.5% Never married39.9% Now married5.4% Separated0.2% Widowed7.0% DivorcedFemales 41.6% Never married38.2% Now married2.6% Separated6.4% Widowed11.2% DivorcedWomen who gave birth in the past 12 months Now married:
40.9% (54)Unmarried:
59.1% (77)
Women who did not give birth in the past 12 months Now married:
35.3% (222)Unmarried:
64.7% (406)
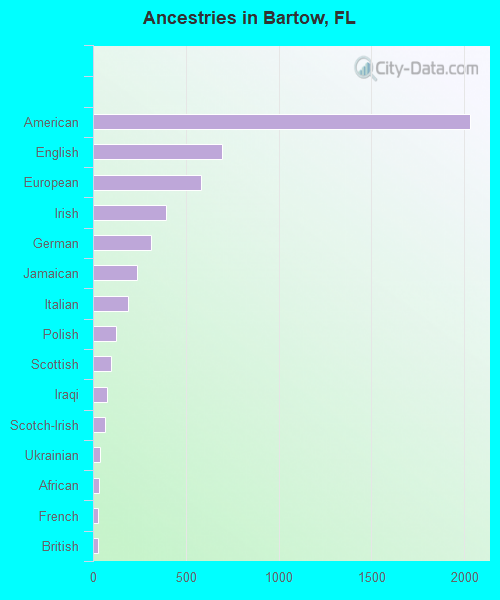
Ancestries in Bartow
2,032 18.4% American693 6.3% English584 5.3% European392 3.5% Irish315 2.8% German235 2.1% Jamaican188 1.7% Italian122 1.1% Polish95 0.9% Scottish77 0.7% Iraqi67 0.6% Scotch-Irish38 0.3% Ukrainian32 0.3% African27 0.2% French26 0.2% British18 0.2% Slavic18 0.2% Welsh13 0.1% Sierra Leonean13 0.1% Swedish12 0.1% Slovak11 0.10% Haitian10 0.09% Danish9 0.08% French Canadian9 0.08% Scandinavian9 0.08% Turkish8 0.07% Norwegian7 0.06% Dutch6 0.05% Pennsylvania German5 0.05% Canadian1 0.01% Bahamian
Geographical mobility in Bartow Same house 1 year ago 9,295 88.3% White (Caucasian)3,579 74.7% Black or African American89 85.0% American Indian / Alaska Native552 100.0% Asian1,338 83.2% Other race2,030 84.1% Two or more races9,295 87.6% White alone, not Hispanic / Latino2,972 88.2% Hispanic or LatinoMoved within same county 688 6.5% White / Caucasian447 9.3% Black or African American81 5.1% Other race173 7.1% Two or more races706 6.7% White alone, not Hispanic / Latino145 4.3% Hispanic or LatinoMoved within same state 342 3.2% White / Caucasian170 3.6% Black or African American45 2.8% Other race65 2.7% Two or more races370 3.5% White alone, not Hispanic / Latino45 1.3% Hispanic or LatinoMoved from different state 197 1.9% White / Caucasian592 12.4% Black or African American14 13.8% American Indian / Alaska Native146 9.1% Other race73 3.0% Two or more races205 1.9% White alone, not Hispanic / Latino241 7.2% Hispanic or LatinoMoved from abroad 21 0.4% Black or African American24 1.0% Two or more races26 0.8% Hispanic or Latino
Children Nativity (place of birth) in Bartow
Children under 6 years - Living with two parents Both parents native 804 100.0% NativeBoth parents foreign-born 50 100.0% NativeOne native, one foreign-born parent 21 100.0% NativeChildren under 6 years - Living with one parent Native parent 506 100.0% NativeChildren 6 to 17 years - Living with two parents Both parents native 1,190 99.9% Native1 0.1% Foreign-bornBoth parents foreign-born 37 52.1% Native34 47.9% Foreign-bornOne native, one foreign-born parent 47 100.0% NativeChildren 6 to 17 years - Living with one parent Native parent 1,409 100.0% NativeForeign-born parent 61 48.9% Native64 51.1% Foreign-born
Grandparents responsible for own grandchildren in Bartow
Grandparents (30 to 59 years) White / Caucasian 16 27.5% Responsible for grandchildren43 72.5% Not responsible for grandchildrenTwo or more races 20 100.0% Not responsible for grandchildrenWhite alone, not Hispanic / Latino 19 27.8% Responsible for grandchildren50 72.2% Not responsible for grandchildrenHispanic or Latino 39 100.0% Not responsible for grandchildrenGrandparents (60 years and over) White / Caucasian 79 37.3% Responsible for grandchildren133 62.7% Not responsible for grandchildrenWhite alone, not Hispanic / Latino 93 40.1% Responsible for grandchildren138 59.9% Not responsible for grandchildrenHispanic or Latino 64 100.0% Not responsible for grandchildren