Races in Bay Point, California (CA) Detailed Stats
Data:
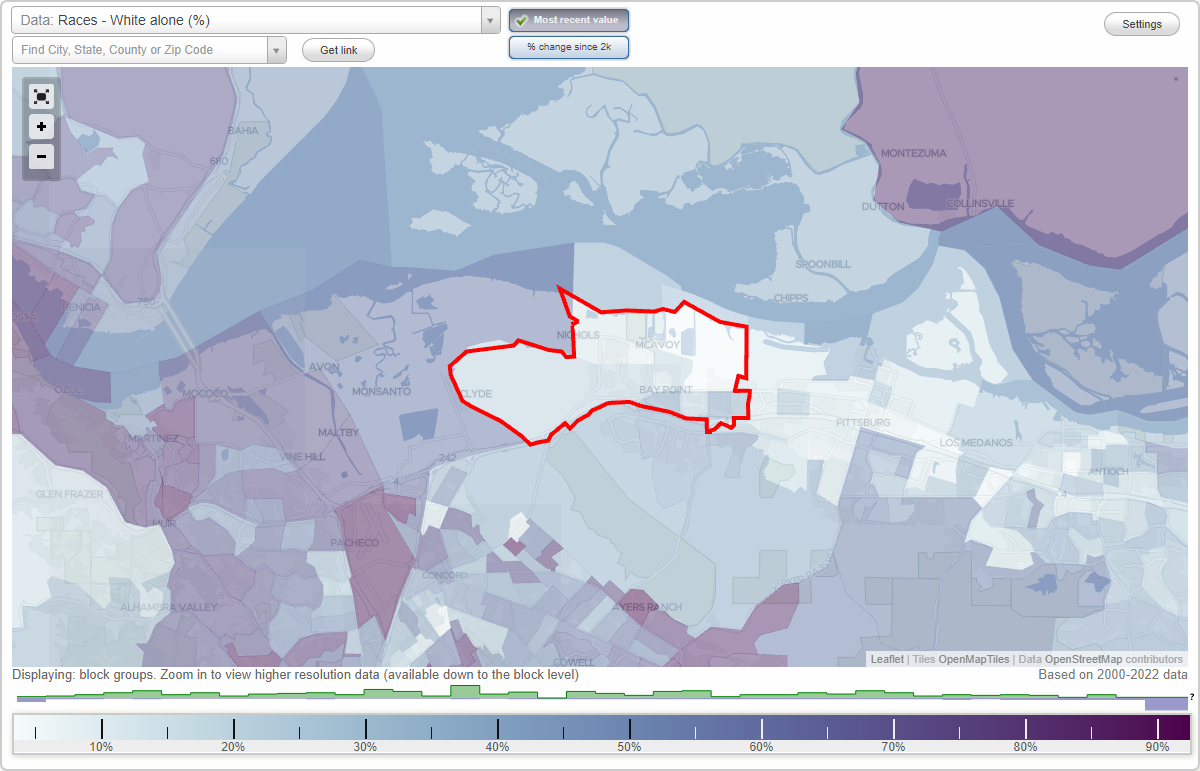
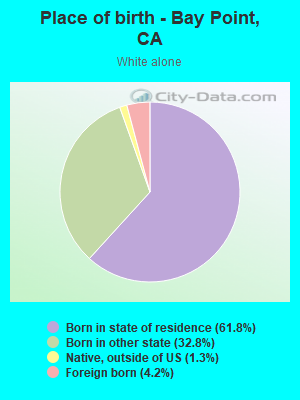
Races - White alone (%)
Races - White alone (% change since 2000)
Races - Black alone (%)
Races - Black alone (% change since 2000)
Races - American Indian alone (%)
Races - American Indian alone (% change since 2000)
Races - Asian alone (%)
Races - Asian alone (% change since 2000)
Races - Hispanic (%)
Races - Hispanic (% change since 2000)
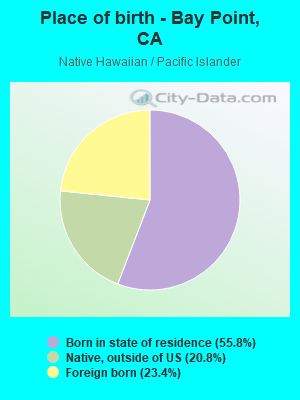
Races - Native Hawaiian and Other Pacific Islander alone (%)
Races - Native Hawaiian and Other Pacific Islander alone (% change since 2000)
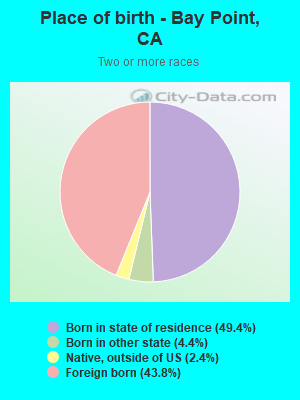
Races - Two or more races(%)
Races - Two or more races(% change since 2000)
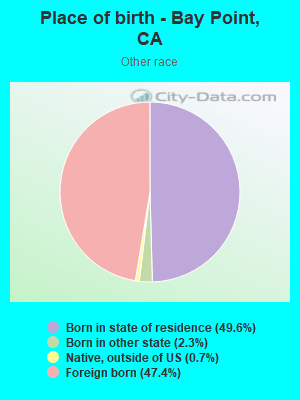
Races - Other race alone (%)
Races - Other race alone (% change since 2000)
Racial diversity
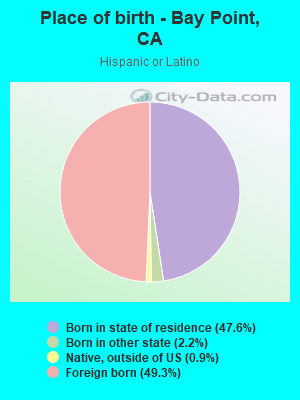
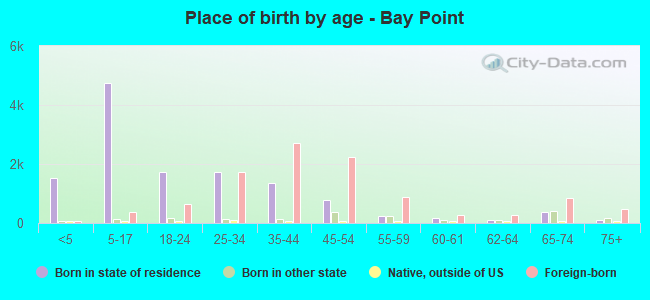
Place of birth - Born in state of residence (%)
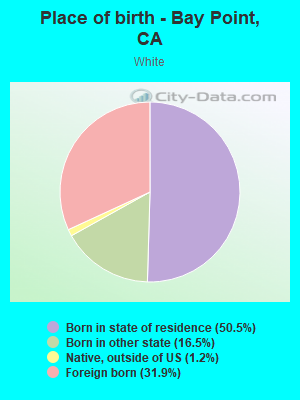
Place of birth - Born in state of residence (%) - White
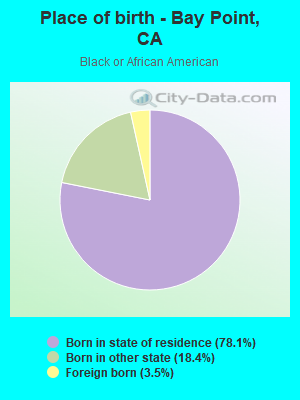
Place of birth - Born in state of residence (%) - Black or African American
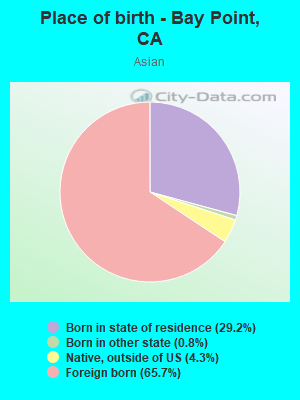
Place of birth - Born in state of residence (%) - Asian
Place of birth - Born in state of residence (%) - Hispanic or Latino
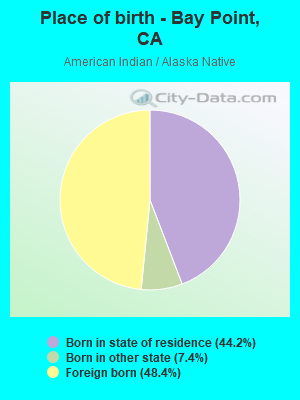
Place of birth - Born in state of residence (%) - American Indian and Alaska Native
Place of birth - Born in state of residence (%) - Multirace
Place of birth - Born in state of residence (%) - Other Race
Place of birth - Born in other state (%)
Place of birth - Born in other state (%) - White
Place of birth - Born in other state (%) - Black or African American
Place of birth - Born in other state (%) - Asian
Place of birth - Born in other state (%) - Hispanic or Latino
Place of birth - Born in other state (%) - American Indian and Alaska Native
Place of birth - Born in other state (%) - Multirace
Place of birth - Born in other state (%) - Other Race
Place of birth - Native, outside of US (%)
Place of birth - Native, outside of US (%) - White
Place of birth - Native, outside of US (%) - Black or African American
Place of birth - Native, outside of US (%) - Asian
Place of birth - Native, outside of US (%) - Hispanic or Latino
Place of birth - Native, outside of US (%) - American Indian and Alaska Native
Place of birth - Native, outside of US (%) - Multirace
Place of birth - Native, outside of US (%) - Other Race
Place of birth - Foreign born (%)
Place of birth - Foreign born (%) - White
Place of birth - Foreign born (%) - Black or African American
Place of birth - Foreign born (%) - Asian
Place of birth - Foreign born (%) - Hispanic or Latino
Place of birth - Foreign born (%) - American Indian and Alaska Native
Place of birth - Foreign born (%) - Multirace
Place of birth - Foreign born (%) - Other Race
Residents speaking English at home (%)
Residents speaking English at home - Born in the United States (%)
Residents speaking English at home - Native, born elsewhere (%)
Residents speaking English at home - Foreign born (%)
Residents speaking Spanish at home (%)
Residents speaking Spanish at home - Born in the United States (%)
Residents speaking Spanish at home - Native, born elsewhere (%)
Residents speaking Spanish at home - Foreign born (%)
Residents speaking other language at home (%)
Residents speaking other language at home - Born in the United States (%)
Residents speaking other language at home - Native, born elsewhere (%)
Residents speaking other language at home - Foreign born (%)
Marital status - Never married (%)
Marital status - Now married (%)
Marital status - Separated (%)
Marital status - Widowed (%)
Marital status - Divorced (%)
Ancestries Reported - Arab (%)
Ancestries Reported - Czech (%)
Ancestries Reported - Danish (%)
Ancestries Reported - Dutch (%)
Ancestries Reported - English (%)
Ancestries Reported - French (%)
Ancestries Reported - French Canadian (%)
Ancestries Reported - German (%)
Ancestries Reported - Greek (%)
Ancestries Reported - Hungarian (%)
Ancestries Reported - Irish (%)
Ancestries Reported - Italian (%)
Ancestries Reported - Lithuanian (%)
Ancestries Reported - Norwegian (%)
Ancestries Reported - Polish (%)
Ancestries Reported - Portuguese (%)
Ancestries Reported - Russian (%)
Ancestries Reported - Scotch-Irish (%)
Ancestries Reported - Scottish (%)
Ancestries Reported - Slovak (%)
Ancestries Reported - Subsaharan African (%)
Ancestries Reported - Swedish (%)
Ancestries Reported - Swiss (%)
Ancestries Reported - Ukrainian (%)
Ancestries Reported - United States (%)
Ancestries Reported - Welsh (%)
Ancestries Reported - West Indian (%)
Ancestries Reported - Other (%)
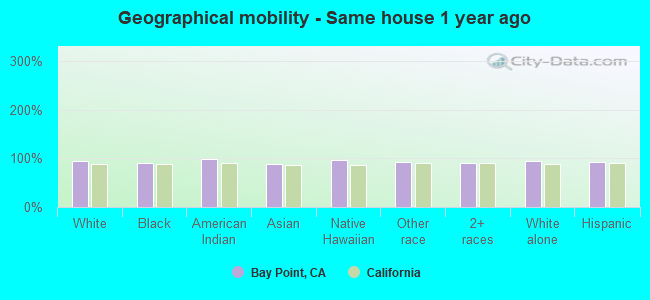
Geographical mobility - Same house 1 year ago (%)
Geographical mobility - Same house 1 year ago (%) - White
Geographical mobility - Same house 1 year ago (%) - Black or African American
Geographical mobility - Same house 1 year ago (%) - Asian
Geographical mobility - Same house 1 year ago (%) - Hispanic or Latino
Geographical mobility - Same house 1 year ago (%) - American Indian and Alaska Native
Geographical mobility - Same house 1 year ago (%) - Multirace
Geographical mobility - Same house 1 year ago (%) - Other Race
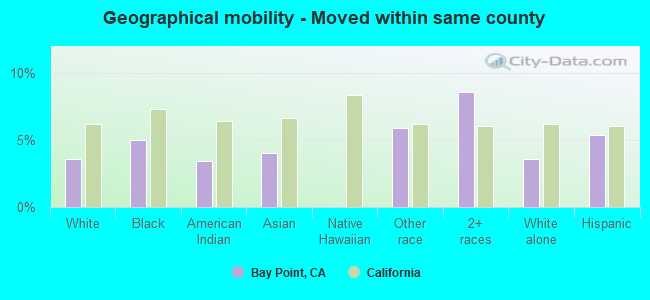
Geographical mobility - Moved within same county (%)
Geographical mobility - Moved within same county (%) - White
Geographical mobility - Moved within same county (%) - Black or African American
Geographical mobility - Moved within same county (%) - Asian
Geographical mobility - Moved within same county (%) - Hispanic or Latino
Geographical mobility - Moved within same county (%) - American Indian and Alaska Native
Geographical mobility - Moved within same county (%) - Multirace
Geographical mobility - Moved within same county (%) - Other Race
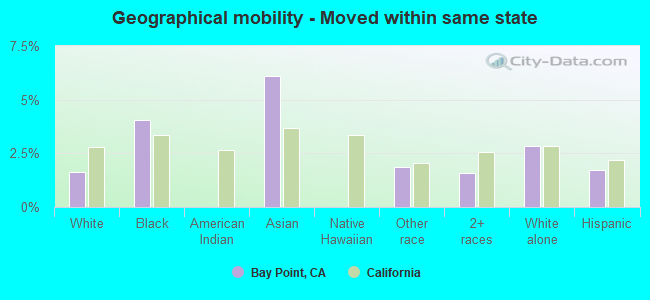
Geographical mobility - Moved from different county within same state (%)
Geographical mobility - Moved from different county within same state (%) - White
Geographical mobility - Moved from different county within same state (%) - Black or African American
Geographical mobility - Moved from different county within same state (%) - Asian
Geographical mobility - Moved from different county within same state (%) - Hispanic or Latino
Geographical mobility - Moved from different county within same state (%) - American Indian and Alaska Native
Geographical mobility - Moved from different county within same state (%) - Multirace
Geographical mobility - Moved from different county within same state (%) - Other Race
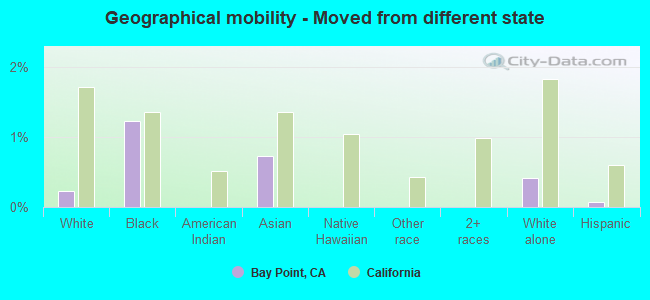
Geographical mobility - Moved from different state (%)
Geographical mobility - Moved from different state (%) - White
Geographical mobility - Moved from different state (%) - Black or African American
Geographical mobility - Moved from different state (%) - Asian
Geographical mobility - Moved from different state (%) - Hispanic or Latino
Geographical mobility - Moved from different state (%) - American Indian and Alaska Native
Geographical mobility - Moved from different state (%) - Multirace
Geographical mobility - Moved from different state (%) - Other Race
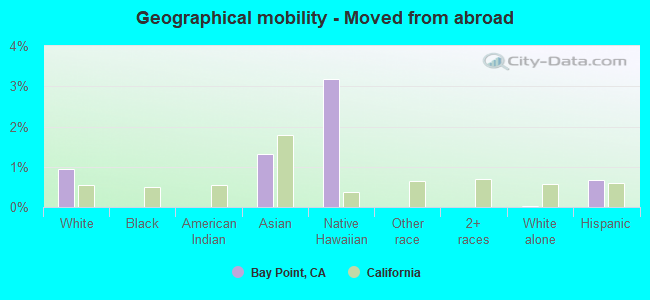
Geographical mobility - Moved from abroad (%)
Geographical mobility - Moved from abroad (%) - White
Geographical mobility - Moved from abroad (%) - Black or African American
Geographical mobility - Moved from abroad (%) - Asian
Geographical mobility - Moved from abroad (%) - Hispanic or Latino
Geographical mobility - Moved from abroad (%) - American Indian and Alaska Native
Geographical mobility - Moved from abroad (%) - Multirace
Geographical mobility - Moved from abroad (%) - Other Race
Place of birth for the foreign-born population - Ireland (%)
Place of birth for the foreign-born population - Denmark (%)
Place of birth for the foreign-born population - Norway (%)
Place of birth for the foreign-born population - Sweden (%)
Place of birth for the foreign-born population - United Kingdom (%)
Place of birth for the foreign-born population - England (%)
Place of birth for the foreign-born population - Scotland (%)
Place of birth for the foreign-born population - Other Northern Europe (%)
Place of birth for the foreign-born population - Austria (%)
Place of birth for the foreign-born population - Belgium (%)
Place of birth for the foreign-born population - France (%)
Place of birth for the foreign-born population - Germany (%)
Place of birth for the foreign-born population - Netherlands (%)
Place of birth for the foreign-born population - Switzerland (%)
Place of birth for the foreign-born population - Other Western Europe (%)
Place of birth for the foreign-born population - Greece (%)
Place of birth for the foreign-born population - Italy (%)
Place of birth for the foreign-born population - Portugal (%)
Place of birth for the foreign-born population - Spain (%)
Place of birth for the foreign-born population - Other Southern Europe (%)
Place of birth for the foreign-born population - Albania (%)
Place of birth for the foreign-born population - Belarus (%)
Place of birth for the foreign-born population - Bosnia and Herzegovina (%)
Place of birth for the foreign-born population - Bulgaria (%)
Place of birth for the foreign-born population - Croatia (%)
Place of birth for the foreign-born population - Czechoslovakia (%)
Place of birth for the foreign-born population - Hungary (%)
Place of birth for the foreign-born population - Latvia (%)
Place of birth for the foreign-born population - Lithuania (%)
Place of birth for the foreign-born population - North Macedonia (Macedonia) (%)
Place of birth for the foreign-born population - Moldova (%)
Place of birth for the foreign-born population - Poland (%)
Place of birth for the foreign-born population - Romania (%)
Place of birth for the foreign-born population - Russia (%)
Place of birth for the foreign-born population - Serbia (%)
Place of birth for the foreign-born population - Ukraine (%)
Place of birth for the foreign-born population - Other Eastern Europe (%)
Place of birth for the foreign-born population - China (%)
Place of birth for the foreign-born population - Hong Kong (%)
Place of birth for the foreign-born population - Taiwan (%)
Place of birth for the foreign-born population - Japan (%)
Place of birth for the foreign-born population - Korea (%)
Place of birth for the foreign-born population - Other Eastern Asia (%)
Place of birth for the foreign-born population - Afghanistan (%)
Place of birth for the foreign-born population - Bangladesh (%)
Place of birth for the foreign-born population - India (%)
Place of birth for the foreign-born population - Iran (%)
Place of birth for the foreign-born population - Kazakhstan (%)
Place of birth for the foreign-born population - Nepal (%)
Place of birth for the foreign-born population - Pakistan (%)
Place of birth for the foreign-born population - Sri Lanka (%)
Place of birth for the foreign-born population - Uzbekistan (%)
Place of birth for the foreign-born population - Other South Central Asia (%)
Place of birth for the foreign-born population - Burma (%)
Place of birth for the foreign-born population - Cambodia (%)
Place of birth for the foreign-born population - Indonesia (%)
Place of birth for the foreign-born population - Laos (%)
Place of birth for the foreign-born population - Malaysia (%)
Place of birth for the foreign-born population - Philippines (%)
Place of birth for the foreign-born population - Singapore (%)
Place of birth for the foreign-born population - Thailand (%)
Place of birth for the foreign-born population - Vietnam (%)
Place of birth for the foreign-born population - Other South Eastern Asia (%)
Place of birth for the foreign-born population - Armenia (%)
Place of birth for the foreign-born population - Iraq (%)
Place of birth for the foreign-born population - Israel (%)
Place of birth for the foreign-born population - Jordan (%)
Place of birth for the foreign-born population - Kuwait (%)
Place of birth for the foreign-born population - Lebanon (%)
Place of birth for the foreign-born population - Saudi Arabia (%)
Place of birth for the foreign-born population - Syria (%)
Place of birth for the foreign-born population - Turkey (%)
Place of birth for the foreign-born population - Yemen (%)
Place of birth for the foreign-born population - Other Western Asia (%)
Place of birth for the foreign-born population - Eritrea (%)
Place of birth for the foreign-born population - Ethiopia (%)
Place of birth for the foreign-born population - Kenya (%)
Place of birth for the foreign-born population - Somalia (%)
Place of birth for the foreign-born population - Uganda (%)
Place of birth for the foreign-born population - Zimbabwe (%)
Place of birth for the foreign-born population - Other Eastern Africa (%)
Place of birth for the foreign-born population - Cameroon (%)
Place of birth for the foreign-born population - Congo (%)
Place of birth for the foreign-born population - Democratic Republic of Congo (Zaire) (%)
Place of birth for the foreign-born population - Other Middle Africa (%)
Place of birth for the foreign-born population - Egypt (%)
Place of birth for the foreign-born population - Morocco (%)
Place of birth for the foreign-born population - Sudan (%)
Place of birth for the foreign-born population - Other Northern Africa (%)
Place of birth for the foreign-born population - South Africa (%)
Place of birth for the foreign-born population - Other Southern Africa (%)
Place of birth for the foreign-born population - Cabo Verde (%)
Place of birth for the foreign-born population - Ghana (%)
Place of birth for the foreign-born population - Liberia (%)
Place of birth for the foreign-born population - Nigeria (%)
Place of birth for the foreign-born population - Senegal (%)
Place of birth for the foreign-born population - Sierra Leone (%)
Place of birth for the foreign-born population - Other Western Africa (%)
Place of birth for the foreign-born population - Australia (%)
Place of birth for the foreign-born population - New Zealand (%)
Place of birth for the foreign-born population - Fiji (%)
Place of birth for the foreign-born population - Micronesia (%)
Place of birth for the foreign-born population - Bahamas (%)
Place of birth for the foreign-born population - Barbados (%)
Place of birth for the foreign-born population - Cuba (%)
Place of birth for the foreign-born population - Dominica (%)
Place of birth for the foreign-born population - Dominican Republic (%)
Place of birth for the foreign-born population - Grenada (%)
Place of birth for the foreign-born population - Haiti (%)
Place of birth for the foreign-born population - Jamaica (%)
Place of birth for the foreign-born population - St. Vincent and the Grenadines (%)
Place of birth for the foreign-born population - Trinidad and Tobago (%)
Place of birth for the foreign-born population - West Indies (%)
Place of birth for the foreign-born population - Other Caribbean (%)
Place of birth for the foreign-born population - Belize (%)
Place of birth for the foreign-born population - Costa Rica (%)
Place of birth for the foreign-born population - El Salvador (%)
Place of birth for the foreign-born population - Guatemala (%)
Place of birth for the foreign-born population - Honduras (%)
Place of birth for the foreign-born population - Mexico (%)
Place of birth for the foreign-born population - Nicaragua (%)
Place of birth for the foreign-born population - Panama (%)
Place of birth for the foreign-born population - Other Central America (%)
Place of birth for the foreign-born population - Argentina (%)
Place of birth for the foreign-born population - Bolivia (%)
Place of birth for the foreign-born population - Brazil (%)
Place of birth for the foreign-born population - Chile (%)
Place of birth for the foreign-born population - Colombia (%)
Place of birth for the foreign-born population - Ecuador (%)
Place of birth for the foreign-born population - Guyana (%)
Place of birth for the foreign-born population - Peru (%)
Place of birth for the foreign-born population - Uruguay (%)
Place of birth for the foreign-born population - Venezuela (%)
Place of birth for the foreign-born population - Other South America (%)
Place of birth for the foreign-born population - Canada (%)
Place of birth for the foreign-born population - Other Northern America (%)
Place of birth for the foreign-born population - Other (%)
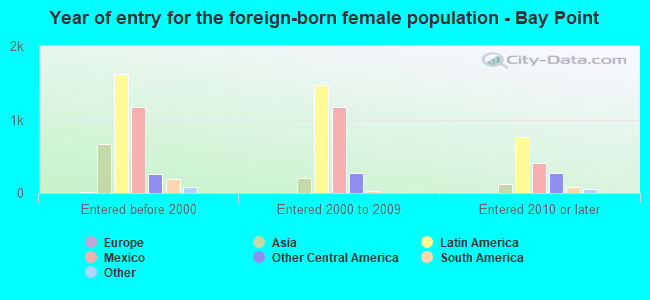
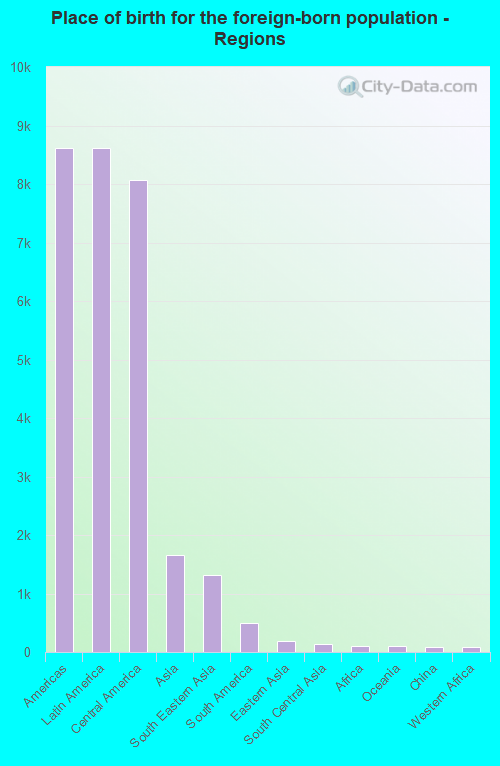
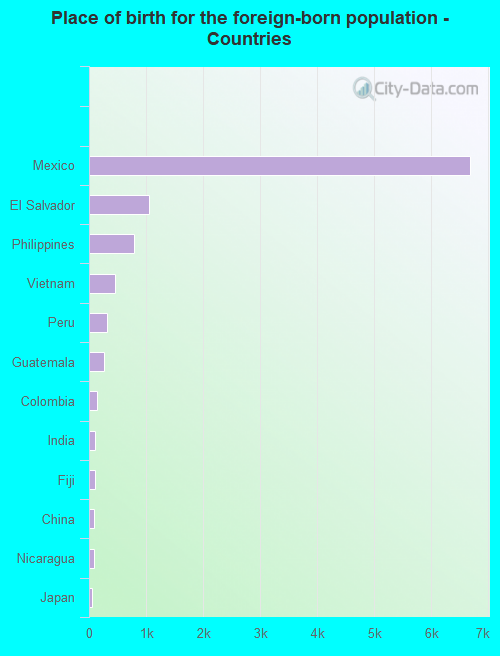
According to 2022 data, the most numerous races in Bay Point, CA are Hispanic (17,364 residents), White alone (2,917 residents), and Asian alone (2,727 residents). 33.9% of Bay Point residents speak English at home. 40.3% of Bay Point, CA residents are foreign-born (32.9% born in Latin America, 6.3% born in Asia), which is 35.5% greater than the foreign-born rate of 26.0% across the entire state of California.
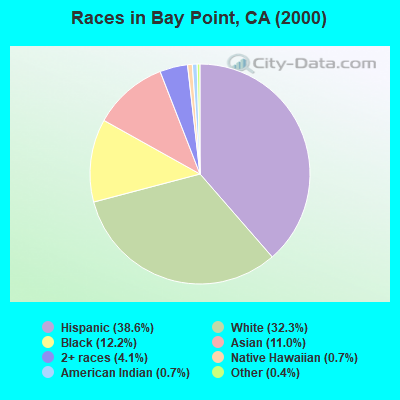
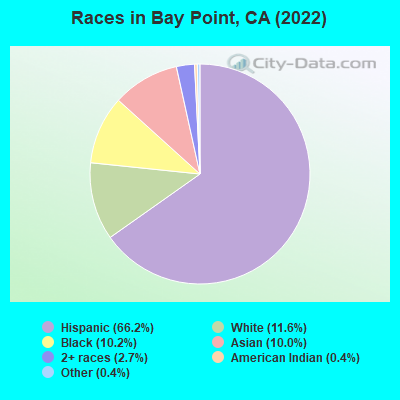
Race distribution in Bay Point
2000 2022
15,816,790 46.7% White alone 10,966,556 32.4% Hispanic 3,648,860 10.8% Asian alone 2,181,926 6.4% Black alone 903,115 2.7% Two or more races 178,984 0.5% American Indian alone 103,736 0.3% Native Hawaiian and Other 71,681 0.2% Other race alone
15,732,184 40.3% Hispanic 13,160,426 33.7% White alone 5,957,867 15.3% Asian alone 2,025,218 5.2% Black alone 1,663,222 4.3% Two or more races 251,618 0.6% Other race alone 135,777 0.3% Native Hawaiian and Other 103,030 0.3% American Indian alone
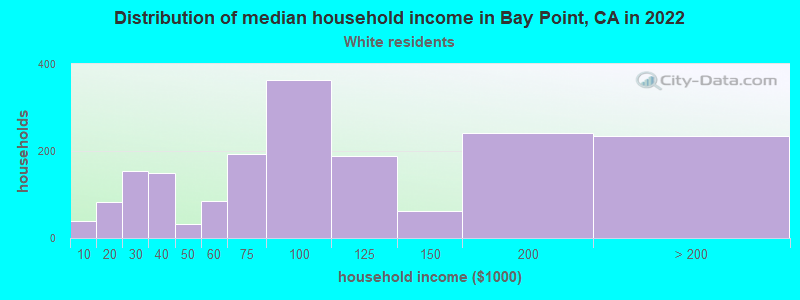
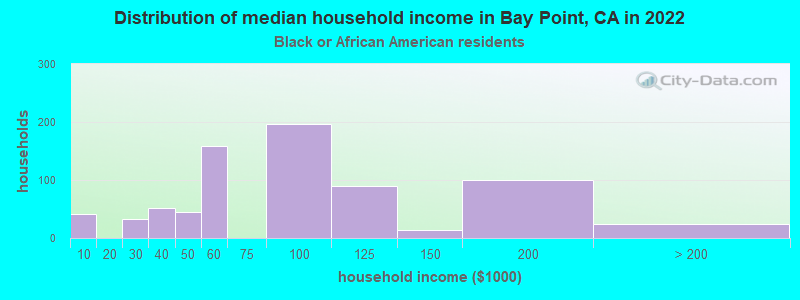
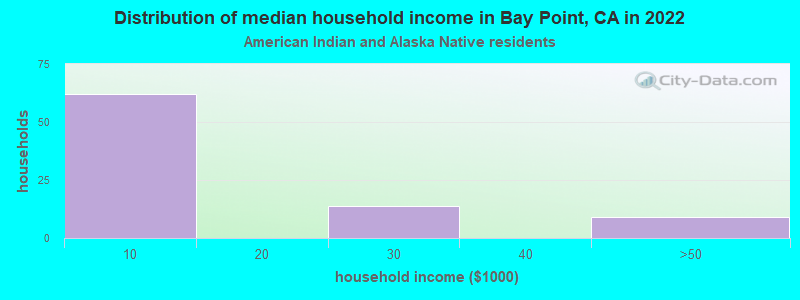
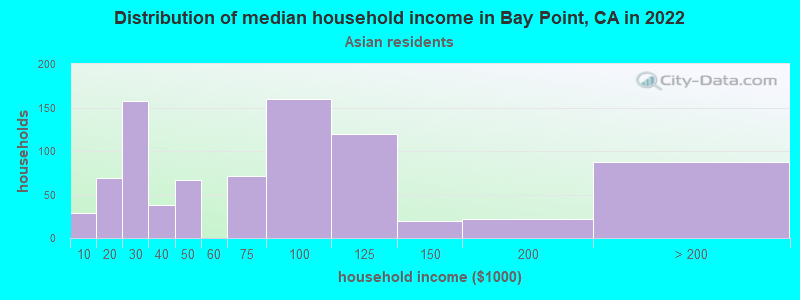
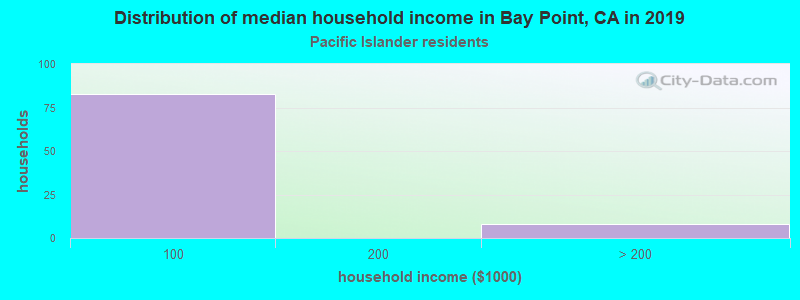
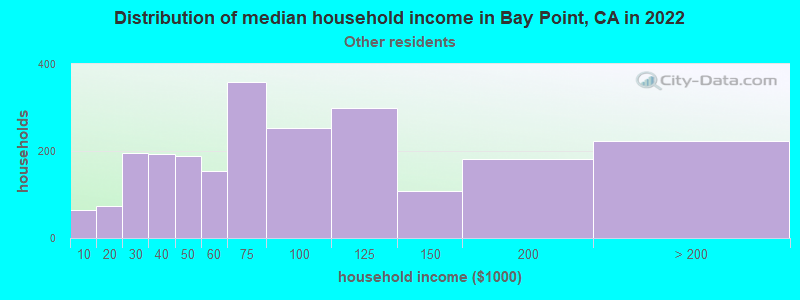
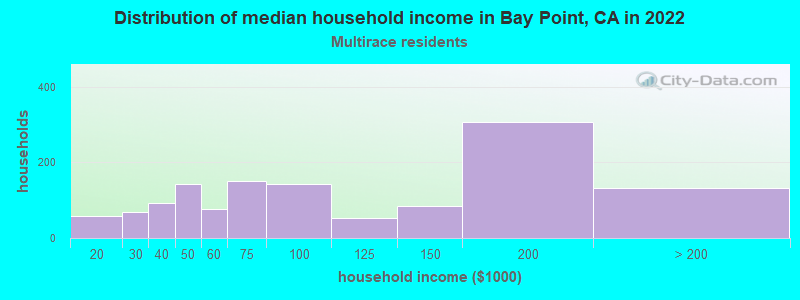
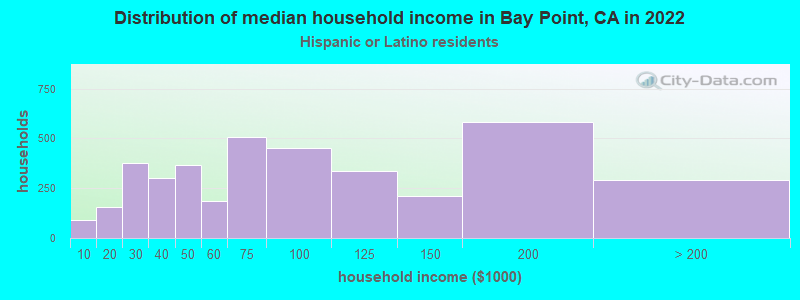
Income and house value in Bay Point Median household income in 2022 $85,634 White non-Hispanic householders$95,693 Black householders$20,438 American Indian and Alaska Native householders$102,410 Asian householders$7,561 Native Hawaiian and other Pacific Islander householders$83,366 Some other race householders$49,656 Two or more races householders$90,162 Hispanic or Latino race householdersMedian 2022 house value $511,100 White Non-Hispanic householders$541,694 Black or African American householders$440,913 American Indian or Alaska Native householders $702,942 Asian householders$506,061 Native Hawaiian and other Pacific Islander householders$480,865 Some other race householders$537,374 Two or more races householders$502,101 Hispanic or Latino householders
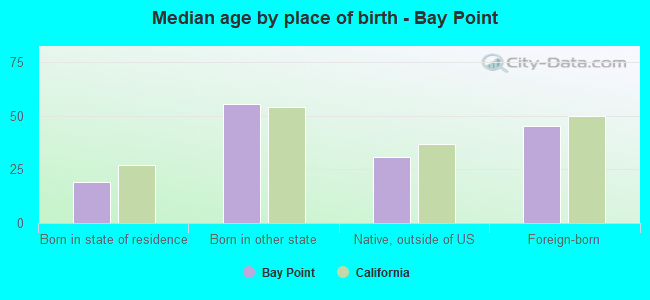
Median age by race in Bay Point
42.4 Median age for White residents39.8 46.1 31.3 Median age for Black or African American residents23.8 35.4 27.5 Median age for American Indian / Alaska Native residents27.8 56.8 47.4 Median age for Asian residents35.7 53.2 61.8 Median age for Native Hawaiian / Pacific Islander residents75.0 45.1 27.7 Median age for Other race residents28.0 27.5 37.4 Median age for Two or more races residents26.4 44.8 52.2 Median age for White alone residents50.0 53.0 30.5 Median age for Hispanic or Latino residents30.2 32.0
Owner/renter occupied households by race in Bay Point
House owners and renters - White residents 1,557 68.5% Owner occupied717 31.5% Renter occupiedHouse owners and renters - Black or African American residents 389 48.1% Owner occupied419 51.9% Renter occupiedHouse owners and renters - American Indian / Alaska Native residents 43 39.8% Owner occupied65 60.2% Renter occupiedHouse owners and renters - Asian residents 680 79.0% Owner occupied180 21.0% Renter occupiedHouse owners and renters - Native Hawaiian / Pacific Islander residents 72 86.6% Owner occupied11 13.4% Renter occupiedHouse owners and renters - Other race residents 1,177 34.8% Owner occupied2,209 65.2% Renter occupiedHouse owners and renters - Two or more races residents 677 60.7% Owner occupied438 39.3% Renter occupiedHouse owners and renters - White alone residents 1,049 77.3% Owner occupied308 22.7% Renter occupiedHouse owners and renters - Hispanic or Latino residents 1,888 44.9% Owner occupied2,317 55.1% Renter occupied
Language usage in Bay Point
English speakers - Total 33.9% of residents of Bay Point speak English at home.
56.4% of residents speak Spanish at home 6,733 49.2% Speak English very well6,951 50.8% Speak English less than very well8.6% of residents speak other language at home 1,245 59.5% Speak English very well846 40.5% Speak English less than very well
English speakers - Born in the United States 83.5% of residents of Bay Point speak English at home.
12.9% of residents speak Spanish at home 200 77.5% Speak English very well58 22.5% Speak English less than very well3.5% of residents speak other language at home 70 100.0% Speak English very well
English speakers - Native, born elsewhere 56.1% of residents of Bay Point speak English at home.
26.3% of residents speak Spanish at home 62 60.2% Speak English very well41 39.8% Speak English less than very well17.6% of residents speak other language at home 4 5.8% Speak English very well65 94.2% Speak English less than very well
English speakers - Foreign-born 4.5% of residents of Bay Point speak English at home.
77.5% of residents speak Spanish at home 2,097 26.3% Speak English very well5,875 73.7% Speak English less than very well15.4% of residents speak other language at home 842 53.1% Speak English very well744 46.9% Speak English less than very well
White (Caucasian) - Speak only English Native:
70.9% (2,777)Foreign-born:
3.1% (62)
White (Caucasian) - Speak another language Native:
23.1% (906)Foreign-born:
88.8% (1,761)
Black or African American - Speak only English Native:
96.7% (2,189)Foreign-born:
21.8% (19)
Black or African American - Speak another language Native:
3.2% (73)Foreign-born:
78.3% (68)
American Indian / Alaska Native - Speak another language Native:
55.5% (124)Foreign-born:
100.0% (255)
Asian - Speak only English Native:
58.9% (530)Foreign-born:
18.1% (321)
Asian - Speak another language Native:
40.7% (366)Foreign-born:
82.9% (1,472)
Native Hawaiian / Pacific Islander - Speak another language Native:
7.6% (9)Foreign-born:
96.4% (47)
Other race - Speak only English Native:
18.1% (1,243)Foreign-born:
0.9% (61)
Other race - Speak another language Native:
81.1% (5,569)Foreign-born:
98.8% (6,540)
Two or more races - Speak only English Native:
57.7% (1,715)Foreign-born:
1.3% (44)
Two or more races - Speak another language Native:
51.0% (1,514)Foreign-born:
100.0% (3,419)
White alone - Speak only English Native:
93.9% (2,503)Foreign-born:
34.0% (45)
White alone - Speak another language Native:
6.1% (162)Foreign-born:
65.9% (87)
Hispanic or Latino - Speak only English Native:
23.8% (1,819)Foreign-born:
1.4% (119)
Hispanic or Latino - Speak another language Native:
76.9% (5,879)Foreign-born:
97.8% (8,247)
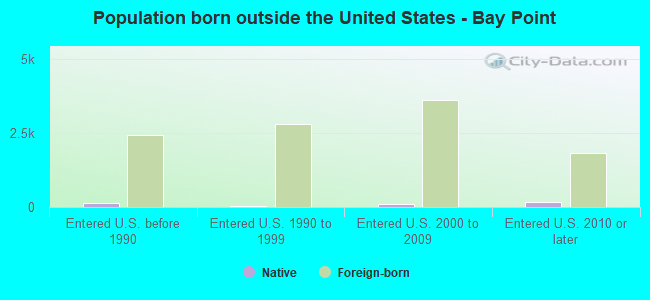
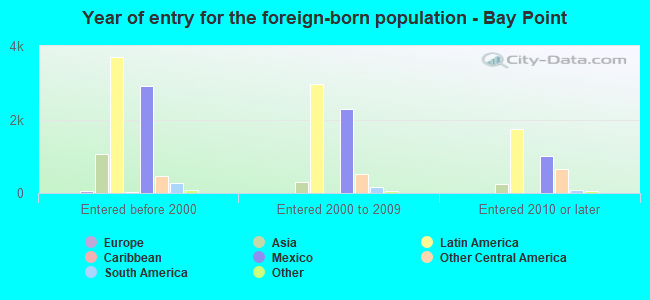
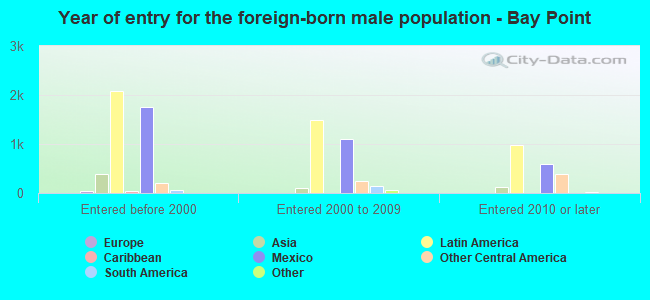
Foreign-born residents in Bay Point 10,521 residents are foreign born (32.9% Latin America , 6.3% Asia ).
This city:
40.3%California:
100.0%
Marital status for residents in Bay Point Marital status - White (Caucasian) population 15 years and over
Males 39.2% Never married44.4% Now married4.0% Separated3.1% Widowed9.4% DivorcedFemales 30.1% Never married48.1% Now married4.7% Separated4.4% Widowed12.7% DivorcedWomen who gave birth in the past 12 months Now married:
76.5% (62)Unmarried:
23.5% (19)
Women who did not give birth in the past 12 months Now married:
48.7% (656)Unmarried:
51.3% (691)
Marital status - Black or African American population 15 years and over
Males 60.3% Never married36.5% Now married0.4% Separated0.0% Widowed2.9% DivorcedFemales 33.5% Never married35.6% Now married10.2% Separated4.4% Widowed16.3% DivorcedWomen who gave birth in the past 12 months Now married:
100.0% (77)Unmarried:
0.0% (0)
Women who did not give birth in the past 12 months Now married:
38.0% (207)Unmarried:
62.0% (337)
Marital status - American Indian / Alaska Native population 15 years and over
Males 59.3% Never married40.7% Now married0.0% Separated0.0% Widowed0.0% DivorcedFemales 33.3% Never married24.2% Now married42.4% Separated0.0% Widowed0.0% DivorcedWomen who gave birth in the past 12 months Now married:
0.0% (0)Unmarried:
100.0% (13)
Women who did not give birth in the past 12 months Now married:
0.0% (0)Unmarried:
100.0% (51)
Marital status - Asian population 15 years and over
Males 44.5% Never married46.3% Now married2.1% Separated3.4% Widowed3.6% DivorcedFemales 25.4% Never married50.1% Now married3.2% Separated2.4% Widowed19.0% DivorcedWomen who gave birth in the past 12 months Now married:
100.0% (25)Unmarried:
0.0% (0)
Women who did not give birth in the past 12 months Now married:
50.5% (255)Unmarried:
49.5% (249)
Marital status - Native Hawaiian / Pacific Islander population 15 years and over
Males 21.9% Never married78.1% Now married0.0% Separated0.0% Widowed0.0% DivorcedFemales 27.8% Never married38.9% Now married0.0% Separated0.0% Widowed33.3% DivorcedWomen who gave birth in the past 12 months Now married:
0.0% (0)Unmarried:
100.0% (5)
Women who did not give birth in the past 12 months Now married:
67.7% (20)Unmarried:
32.3% (10)
Marital status - Other race population 15 years and over
Males 48.9% Never married43.8% Now married0.4% Separated0.9% Widowed6.0% DivorcedFemales 47.8% Never married40.5% Now married4.5% Separated0.9% Widowed6.3% DivorcedWomen who gave birth in the past 12 months Now married:
73.6% (132)Unmarried:
26.4% (47)
Women who did not give birth in the past 12 months Now married:
42.8% (1,769)Unmarried:
57.2% (2,365)
Marital status - Two or more races population 15 years and over
Males 57.2% Never married28.6% Now married0.0% Separated1.8% Widowed12.4% DivorcedFemales 60.4% Never married24.5% Now married1.5% Separated3.5% Widowed10.0% DivorcedWomen who gave birth in the past 12 months Now married:
100.0% (82)Unmarried:
0.0% (0)
Women who did not give birth in the past 12 months Now married:
20.7% (304)Unmarried:
79.3% (1,167)
Marital status - White alone, not Hispanic / Latino population 15 years and over
Males 33.0% Never married44.0% Now married0.6% Separated5.6% Widowed16.7% DivorcedFemales 26.2% Never married43.1% Now married3.4% Separated7.5% Widowed19.8% DivorcedWomen who gave birth in the past 12 months Now married:
94.9% (33)Unmarried:
5.1% (2)
Women who did not give birth in the past 12 months Now married:
50.6% (230)Unmarried:
49.4% (225)
Marital status - Hispanic or Latino population 15 years and over
Males 47.3% Never married42.6% Now married2.5% Separated1.3% Widowed6.3% DivorcedFemales 42.5% Never married43.4% Now married4.6% Separated1.9% Widowed7.5% DivorcedWomen who gave birth in the past 12 months Now married:
75.0% (177)Unmarried:
25.0% (59)
Women who did not give birth in the past 12 months Now married:
43.6% (2,059)Unmarried:
56.4% (2,669)
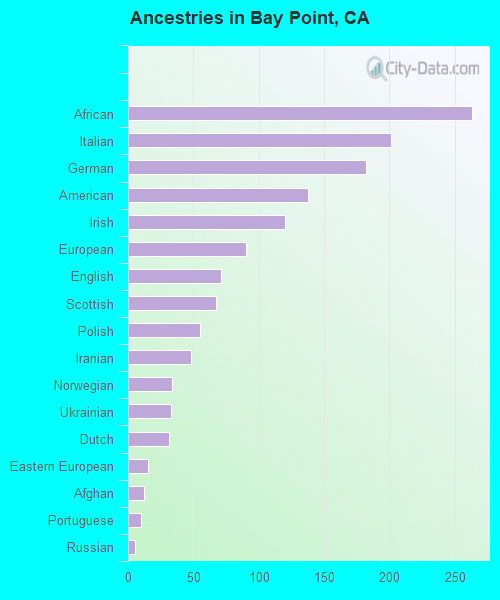
Ancestries in Bay Point
272 1.7% American207 1.3% African138 0.9% Italian113 0.7% German95 0.6% Irish56 0.4% European36 0.2% Dutch33 0.2% Scotch-Irish29 0.2% Ukrainian27 0.2% Ghanaian25 0.2% Polish23 0.1% Eastern European21 0.1% Iranian19 0.1% English15 0.09% Norwegian14 0.09% Portuguese13 0.08% Brazilian12 0.08% Northern European11 0.07% Scottish10 0.06% French6 0.04% Finnish2 0.01% Afghan
Geographical mobility in Bay Point Same house 1 year ago 6,196 94.2% White (Caucasian)2,232 89.4% Black or African American405 98.5% American Indian / Alaska Native2,425 88.3% Asian171 97.1% Native Hawaiian / Pacific Islander10,127 92.5% Other race4,840 90.4% Two or more races2,765 93.9% White alone, not Hispanic / Latino15,473 92.4% Hispanic or LatinoMoved within same county 233 3.5% White / Caucasian124 5.0% Black or African American14 3.5% American Indian / Alaska Native111 4.1% Asian646 5.9% Other race459 8.6% Two or more races105 3.6% White alone, not Hispanic / Latino902 5.4% Hispanic or LatinoMoved within same state 108 1.6% White / Caucasian101 4.1% Black or African American168 6.1% Asian206 1.9% Other race84 1.6% Two or more races84 2.9% White alone, not Hispanic / Latino286 1.7% Hispanic or LatinoMoved from different state 15 0.2% White / Caucasian31 1.2% Black or African American20 0.7% Asian12 0.4% White alone, not Hispanic / Latino11 0.1% Hispanic or LatinoMoved from abroad 63 1.0% White36 1.3% Asian6 3.2% Native Hawaiian / Pacific Islander1 0.0% White alone, not Hispanic / Latino114 0.7% Hispanic or Latino
Children Nativity (place of birth) in Bay Point
Children under 6 years - Living with two parents Both parents native 323 100.0% NativeBoth parents foreign-born 385 100.0% NativeOne native, one foreign-born parent 494 100.0% NativeChildren under 6 years - Living with one parent Native parent 307 100.0% Native0 0.0% Foreign-bornForeign-born parent 196 88.7% Native25 11.3% Foreign-bornChildren 6 to 17 years - Living with two parents Both parents native 464 99.7% Native1 0.3% Foreign-bornBoth parents foreign-born 1,488 86.5% Native232 13.5% Foreign-bornOne native, one foreign-born parent 576 100.0% NativeChildren 6 to 17 years - Living with one parent Native parent 972 100.0% NativeForeign-born parent 940 51.8% Native875 48.2% Foreign-born
Grandparents responsible for own grandchildren in Bay Point
Grandparents (30 to 59 years) White / Caucasian 30 42.9% Responsible for grandchildren40 57.1% Not responsible for grandchildrenBlack or African American 35 100.0% Not responsible for grandchildrenAsian 22 100.0% Not responsible for grandchildrenNative Hawaiian / Pacific Islander 12 100.0% Responsible for grandchildrenOther race 15 13.1% Responsible for grandchildren100 86.9% Not responsible for grandchildrenWhite alone, not Hispanic / Latino 4 14.4% Responsible for grandchildren25 85.6% Not responsible for grandchildrenHispanic or Latino 34 19.8% Responsible for grandchildren136 80.2% Not responsible for grandchildrenGrandparents (60 years and over) White / Caucasian 100 100.0% Not responsible for grandchildrenBlack or African American 2 100.0% Not responsible for grandchildrenAsian 140 100.0% Not responsible for grandchildrenOther race 41 44.6% Responsible for grandchildren51 55.4% Not responsible for grandchildrenWhite alone, not Hispanic / Latino 11 100.0% Not responsible for grandchildrenHispanic or Latino 32 15.3% Responsible for grandchildren180 84.7% Not responsible for grandchildren