Races in Bayou Cane, Louisiana (LA) Detailed Stats
Data:
Races - White alone (%)
Races - White alone (% change since 2000)
Races - Black alone (%)
Races - Black alone (% change since 2000)
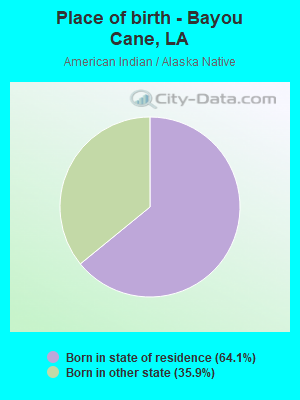
Races - American Indian alone (%)
Races - American Indian alone (% change since 2000)
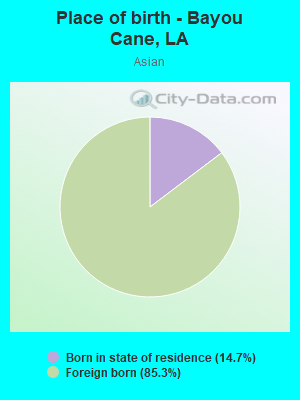
Races - Asian alone (%)
Races - Asian alone (% change since 2000)
Races - Hispanic (%)
Races - Hispanic (% change since 2000)
Races - Native Hawaiian and Other Pacific Islander alone (%)
Races - Native Hawaiian and Other Pacific Islander alone (% change since 2000)
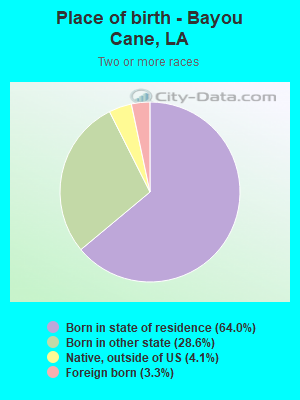
Races - Two or more races(%)
Races - Two or more races(% change since 2000)
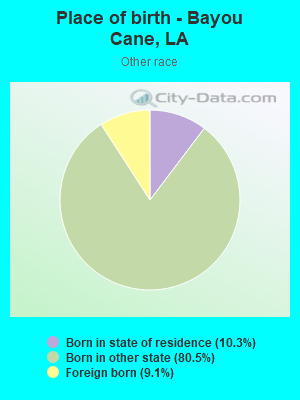
Races - Other race alone (%)
Races - Other race alone (% change since 2000)
Racial diversity
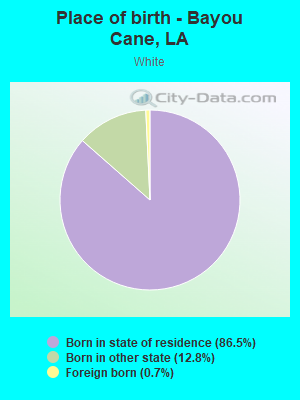
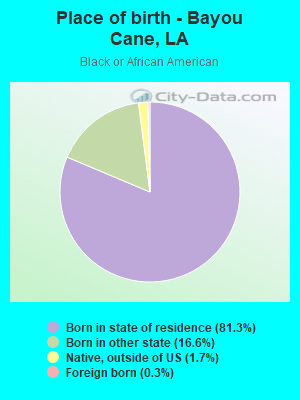
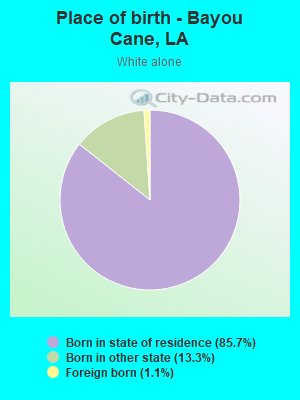
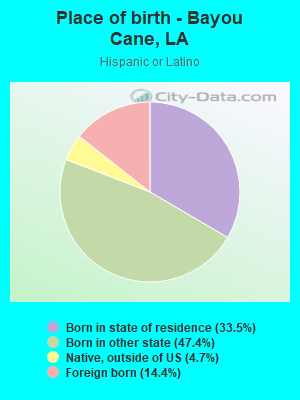
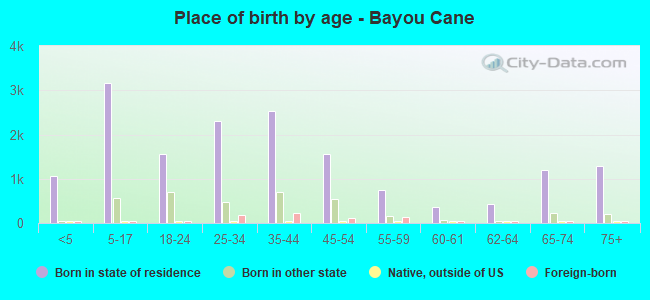
Place of birth - Born in state of residence (%)
Place of birth - Born in state of residence (%) - White
Place of birth - Born in state of residence (%) - Black or African American
Place of birth - Born in state of residence (%) - Asian
Place of birth - Born in state of residence (%) - Hispanic or Latino
Place of birth - Born in state of residence (%) - American Indian and Alaska Native
Place of birth - Born in state of residence (%) - Multirace
Place of birth - Born in state of residence (%) - Other Race
Place of birth - Born in other state (%)
Place of birth - Born in other state (%) - White
Place of birth - Born in other state (%) - Black or African American
Place of birth - Born in other state (%) - Asian
Place of birth - Born in other state (%) - Hispanic or Latino
Place of birth - Born in other state (%) - American Indian and Alaska Native
Place of birth - Born in other state (%) - Multirace
Place of birth - Born in other state (%) - Other Race
Place of birth - Native, outside of US (%)
Place of birth - Native, outside of US (%) - White
Place of birth - Native, outside of US (%) - Black or African American
Place of birth - Native, outside of US (%) - Asian
Place of birth - Native, outside of US (%) - Hispanic or Latino
Place of birth - Native, outside of US (%) - American Indian and Alaska Native
Place of birth - Native, outside of US (%) - Multirace
Place of birth - Native, outside of US (%) - Other Race
Place of birth - Foreign born (%)
Place of birth - Foreign born (%) - White
Place of birth - Foreign born (%) - Black or African American
Place of birth - Foreign born (%) - Asian
Place of birth - Foreign born (%) - Hispanic or Latino
Place of birth - Foreign born (%) - American Indian and Alaska Native
Place of birth - Foreign born (%) - Multirace
Place of birth - Foreign born (%) - Other Race
Residents speaking English at home (%)
Residents speaking English at home - Born in the United States (%)
Residents speaking English at home - Native, born elsewhere (%)
Residents speaking English at home - Foreign born (%)
Residents speaking Spanish at home (%)
Residents speaking Spanish at home - Born in the United States (%)
Residents speaking Spanish at home - Native, born elsewhere (%)
Residents speaking Spanish at home - Foreign born (%)
Residents speaking other language at home (%)
Residents speaking other language at home - Born in the United States (%)
Residents speaking other language at home - Native, born elsewhere (%)
Residents speaking other language at home - Foreign born (%)
Marital status - Never married (%)
Marital status - Now married (%)
Marital status - Separated (%)
Marital status - Widowed (%)
Marital status - Divorced (%)
Ancestries Reported - Arab (%)
Ancestries Reported - Czech (%)
Ancestries Reported - Danish (%)
Ancestries Reported - Dutch (%)
Ancestries Reported - English (%)
Ancestries Reported - French (%)
Ancestries Reported - French Canadian (%)
Ancestries Reported - German (%)
Ancestries Reported - Greek (%)
Ancestries Reported - Hungarian (%)
Ancestries Reported - Irish (%)
Ancestries Reported - Italian (%)
Ancestries Reported - Lithuanian (%)
Ancestries Reported - Norwegian (%)
Ancestries Reported - Polish (%)
Ancestries Reported - Portuguese (%)
Ancestries Reported - Russian (%)
Ancestries Reported - Scotch-Irish (%)
Ancestries Reported - Scottish (%)
Ancestries Reported - Slovak (%)
Ancestries Reported - Subsaharan African (%)
Ancestries Reported - Swedish (%)
Ancestries Reported - Swiss (%)
Ancestries Reported - Ukrainian (%)
Ancestries Reported - United States (%)
Ancestries Reported - Welsh (%)
Ancestries Reported - West Indian (%)
Ancestries Reported - Other (%)
Geographical mobility - Same house 1 year ago (%)
Geographical mobility - Same house 1 year ago (%) - White
Geographical mobility - Same house 1 year ago (%) - Black or African American
Geographical mobility - Same house 1 year ago (%) - Asian
Geographical mobility - Same house 1 year ago (%) - Hispanic or Latino
Geographical mobility - Same house 1 year ago (%) - American Indian and Alaska Native
Geographical mobility - Same house 1 year ago (%) - Multirace
Geographical mobility - Same house 1 year ago (%) - Other Race
Geographical mobility - Moved within same county (%)
Geographical mobility - Moved within same county (%) - White
Geographical mobility - Moved within same county (%) - Black or African American
Geographical mobility - Moved within same county (%) - Asian
Geographical mobility - Moved within same county (%) - Hispanic or Latino
Geographical mobility - Moved within same county (%) - American Indian and Alaska Native
Geographical mobility - Moved within same county (%) - Multirace
Geographical mobility - Moved within same county (%) - Other Race
Geographical mobility - Moved from different county within same state (%)
Geographical mobility - Moved from different county within same state (%) - White
Geographical mobility - Moved from different county within same state (%) - Black or African American
Geographical mobility - Moved from different county within same state (%) - Asian
Geographical mobility - Moved from different county within same state (%) - Hispanic or Latino
Geographical mobility - Moved from different county within same state (%) - American Indian and Alaska Native
Geographical mobility - Moved from different county within same state (%) - Multirace
Geographical mobility - Moved from different county within same state (%) - Other Race
Geographical mobility - Moved from different state (%)
Geographical mobility - Moved from different state (%) - White
Geographical mobility - Moved from different state (%) - Black or African American
Geographical mobility - Moved from different state (%) - Asian
Geographical mobility - Moved from different state (%) - Hispanic or Latino
Geographical mobility - Moved from different state (%) - American Indian and Alaska Native
Geographical mobility - Moved from different state (%) - Multirace
Geographical mobility - Moved from different state (%) - Other Race
Geographical mobility - Moved from abroad (%)
Geographical mobility - Moved from abroad (%) - White
Geographical mobility - Moved from abroad (%) - Black or African American
Geographical mobility - Moved from abroad (%) - Asian
Geographical mobility - Moved from abroad (%) - Hispanic or Latino
Geographical mobility - Moved from abroad (%) - American Indian and Alaska Native
Geographical mobility - Moved from abroad (%) - Multirace
Geographical mobility - Moved from abroad (%) - Other Race
Place of birth for the foreign-born population - Ireland (%)
Place of birth for the foreign-born population - Denmark (%)
Place of birth for the foreign-born population - Norway (%)
Place of birth for the foreign-born population - Sweden (%)
Place of birth for the foreign-born population - United Kingdom (%)
Place of birth for the foreign-born population - England (%)
Place of birth for the foreign-born population - Scotland (%)
Place of birth for the foreign-born population - Other Northern Europe (%)
Place of birth for the foreign-born population - Austria (%)
Place of birth for the foreign-born population - Belgium (%)
Place of birth for the foreign-born population - France (%)
Place of birth for the foreign-born population - Germany (%)
Place of birth for the foreign-born population - Netherlands (%)
Place of birth for the foreign-born population - Switzerland (%)
Place of birth for the foreign-born population - Other Western Europe (%)
Place of birth for the foreign-born population - Greece (%)
Place of birth for the foreign-born population - Italy (%)
Place of birth for the foreign-born population - Portugal (%)
Place of birth for the foreign-born population - Spain (%)
Place of birth for the foreign-born population - Other Southern Europe (%)
Place of birth for the foreign-born population - Albania (%)
Place of birth for the foreign-born population - Belarus (%)
Place of birth for the foreign-born population - Bosnia and Herzegovina (%)
Place of birth for the foreign-born population - Bulgaria (%)
Place of birth for the foreign-born population - Croatia (%)
Place of birth for the foreign-born population - Czechoslovakia (%)
Place of birth for the foreign-born population - Hungary (%)
Place of birth for the foreign-born population - Latvia (%)
Place of birth for the foreign-born population - Lithuania (%)
Place of birth for the foreign-born population - North Macedonia (Macedonia) (%)
Place of birth for the foreign-born population - Moldova (%)
Place of birth for the foreign-born population - Poland (%)
Place of birth for the foreign-born population - Romania (%)
Place of birth for the foreign-born population - Russia (%)
Place of birth for the foreign-born population - Serbia (%)
Place of birth for the foreign-born population - Ukraine (%)
Place of birth for the foreign-born population - Other Eastern Europe (%)
Place of birth for the foreign-born population - China (%)
Place of birth for the foreign-born population - Hong Kong (%)
Place of birth for the foreign-born population - Taiwan (%)
Place of birth for the foreign-born population - Japan (%)
Place of birth for the foreign-born population - Korea (%)
Place of birth for the foreign-born population - Other Eastern Asia (%)
Place of birth for the foreign-born population - Afghanistan (%)
Place of birth for the foreign-born population - Bangladesh (%)
Place of birth for the foreign-born population - India (%)
Place of birth for the foreign-born population - Iran (%)
Place of birth for the foreign-born population - Kazakhstan (%)
Place of birth for the foreign-born population - Nepal (%)
Place of birth for the foreign-born population - Pakistan (%)
Place of birth for the foreign-born population - Sri Lanka (%)
Place of birth for the foreign-born population - Uzbekistan (%)
Place of birth for the foreign-born population - Other South Central Asia (%)
Place of birth for the foreign-born population - Burma (%)
Place of birth for the foreign-born population - Cambodia (%)
Place of birth for the foreign-born population - Indonesia (%)
Place of birth for the foreign-born population - Laos (%)
Place of birth for the foreign-born population - Malaysia (%)
Place of birth for the foreign-born population - Philippines (%)
Place of birth for the foreign-born population - Singapore (%)
Place of birth for the foreign-born population - Thailand (%)
Place of birth for the foreign-born population - Vietnam (%)
Place of birth for the foreign-born population - Other South Eastern Asia (%)
Place of birth for the foreign-born population - Armenia (%)
Place of birth for the foreign-born population - Iraq (%)
Place of birth for the foreign-born population - Israel (%)
Place of birth for the foreign-born population - Jordan (%)
Place of birth for the foreign-born population - Kuwait (%)
Place of birth for the foreign-born population - Lebanon (%)
Place of birth for the foreign-born population - Saudi Arabia (%)
Place of birth for the foreign-born population - Syria (%)
Place of birth for the foreign-born population - Turkey (%)
Place of birth for the foreign-born population - Yemen (%)
Place of birth for the foreign-born population - Other Western Asia (%)
Place of birth for the foreign-born population - Eritrea (%)
Place of birth for the foreign-born population - Ethiopia (%)
Place of birth for the foreign-born population - Kenya (%)
Place of birth for the foreign-born population - Somalia (%)
Place of birth for the foreign-born population - Uganda (%)
Place of birth for the foreign-born population - Zimbabwe (%)
Place of birth for the foreign-born population - Other Eastern Africa (%)
Place of birth for the foreign-born population - Cameroon (%)
Place of birth for the foreign-born population - Congo (%)
Place of birth for the foreign-born population - Democratic Republic of Congo (Zaire) (%)
Place of birth for the foreign-born population - Other Middle Africa (%)
Place of birth for the foreign-born population - Egypt (%)
Place of birth for the foreign-born population - Morocco (%)
Place of birth for the foreign-born population - Sudan (%)
Place of birth for the foreign-born population - Other Northern Africa (%)
Place of birth for the foreign-born population - South Africa (%)
Place of birth for the foreign-born population - Other Southern Africa (%)
Place of birth for the foreign-born population - Cabo Verde (%)
Place of birth for the foreign-born population - Ghana (%)
Place of birth for the foreign-born population - Liberia (%)
Place of birth for the foreign-born population - Nigeria (%)
Place of birth for the foreign-born population - Senegal (%)
Place of birth for the foreign-born population - Sierra Leone (%)
Place of birth for the foreign-born population - Other Western Africa (%)
Place of birth for the foreign-born population - Australia (%)
Place of birth for the foreign-born population - New Zealand (%)
Place of birth for the foreign-born population - Fiji (%)
Place of birth for the foreign-born population - Micronesia (%)
Place of birth for the foreign-born population - Bahamas (%)
Place of birth for the foreign-born population - Barbados (%)
Place of birth for the foreign-born population - Cuba (%)
Place of birth for the foreign-born population - Dominica (%)
Place of birth for the foreign-born population - Dominican Republic (%)
Place of birth for the foreign-born population - Grenada (%)
Place of birth for the foreign-born population - Haiti (%)
Place of birth for the foreign-born population - Jamaica (%)
Place of birth for the foreign-born population - St. Vincent and the Grenadines (%)
Place of birth for the foreign-born population - Trinidad and Tobago (%)
Place of birth for the foreign-born population - West Indies (%)
Place of birth for the foreign-born population - Other Caribbean (%)
Place of birth for the foreign-born population - Belize (%)
Place of birth for the foreign-born population - Costa Rica (%)
Place of birth for the foreign-born population - El Salvador (%)
Place of birth for the foreign-born population - Guatemala (%)
Place of birth for the foreign-born population - Honduras (%)
Place of birth for the foreign-born population - Mexico (%)
Place of birth for the foreign-born population - Nicaragua (%)
Place of birth for the foreign-born population - Panama (%)
Place of birth for the foreign-born population - Other Central America (%)
Place of birth for the foreign-born population - Argentina (%)
Place of birth for the foreign-born population - Bolivia (%)
Place of birth for the foreign-born population - Brazil (%)
Place of birth for the foreign-born population - Chile (%)
Place of birth for the foreign-born population - Colombia (%)
Place of birth for the foreign-born population - Ecuador (%)
Place of birth for the foreign-born population - Guyana (%)
Place of birth for the foreign-born population - Peru (%)
Place of birth for the foreign-born population - Uruguay (%)
Place of birth for the foreign-born population - Venezuela (%)
Place of birth for the foreign-born population - Other South America (%)
Place of birth for the foreign-born population - Canada (%)
Place of birth for the foreign-born population - Other Northern America (%)
Place of birth for the foreign-born population - Other (%)
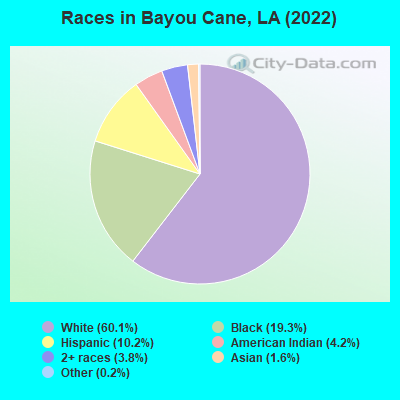
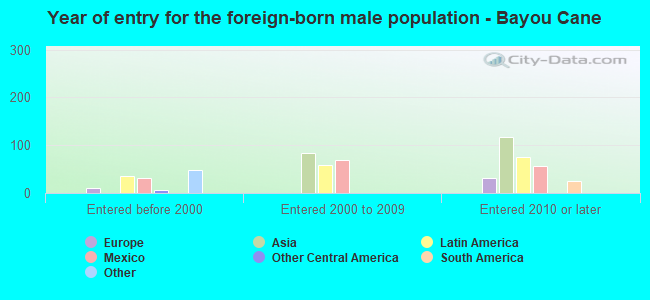
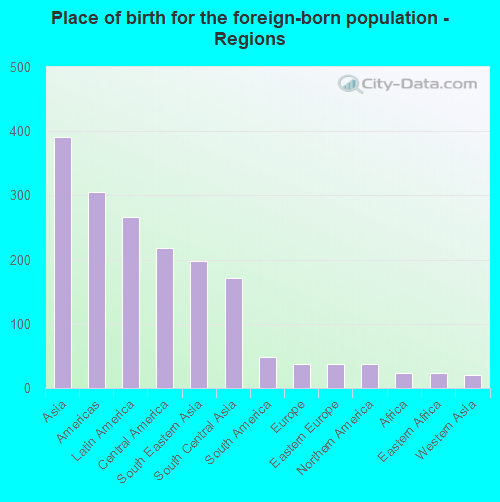
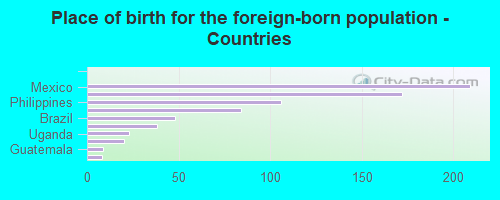
According to 2022 data, the most numerous races in Bayou Cane, LA are White alone (12,237 residents), Black alone (3,925 residents), and Hispanic (2,071 residents). 88.4% of Bayou Cane residents speak English at home. 3.7% of Bayou Cane, LA residents are foreign-born (1.8% born in Asia, 1.2% born in Latin America), which is 7.2% less than the foreign-born rate of 4.0% across the entire state of Louisiana.
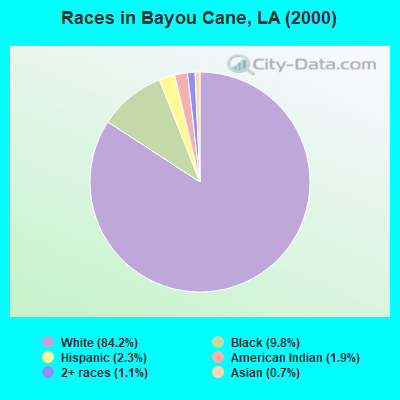
Race distribution in Bayou Cane
2000 2022
2,794,391 62.5% White alone 1,443,390 32.3% Black alone 107,738 2.4% Hispanic 54,256 1.2% Asian alone 39,260 0.9% Two or more races 24,129 0.5% American Indian alone 4,736 0.1% Other race alone 1,076 0.02% Native Hawaiian and Other
2,603,221 56.7% White alone 1,420,055 30.9% Black alone 262,213 5.7% Hispanic 183,270 4.0% Two or more races 81,169 1.8% Asian alone 19,991 0.4% American Indian alone 18,043 0.4% Other race alone 2,279 0.05% Native Hawaiian and Other
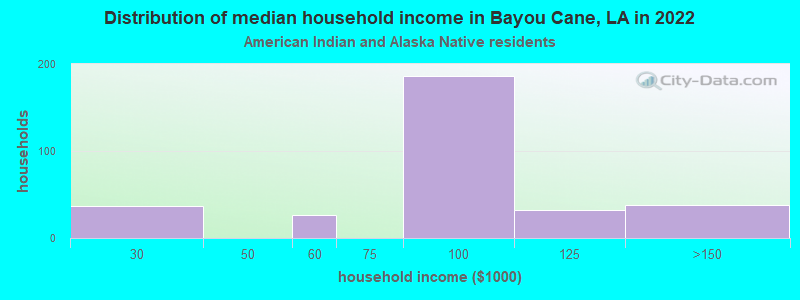
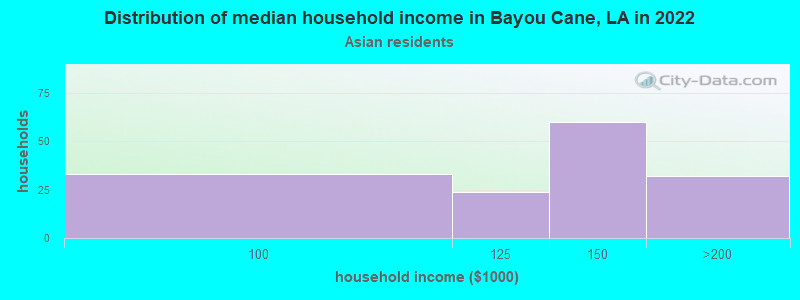
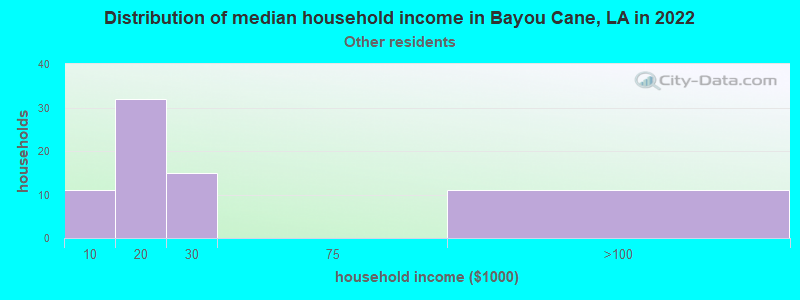
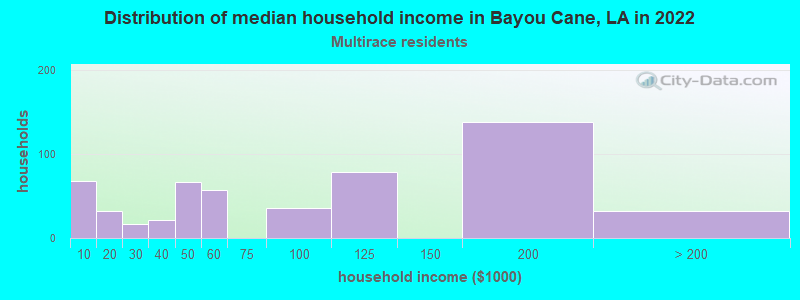
Income and house value in Bayou Cane Median household income in 2022 $70,128 White non-Hispanic householders$52,794 Black householders$51,781 American Indian and Alaska Native householders$122,042 Asian householders$100,464 Two or more races householders$95,600 Hispanic or Latino race householdersMedian 2022 house value $205,454 White Non-Hispanic householders$232,091 Black or African American householders$189,668 American Indian or Alaska Native householders $219,019 Asian householders$177,090 Some other race householders$135,653 Two or more races householders$190,655 Hispanic or Latino householders
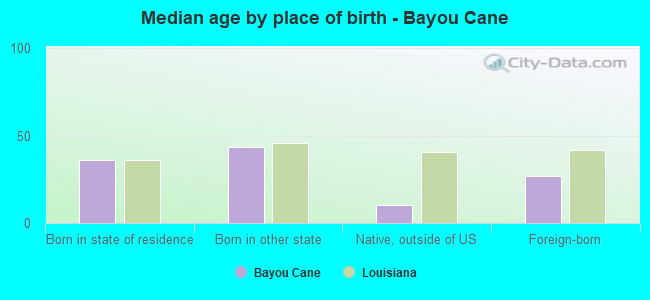
Median age by race in Bayou Cane
39.2 Median age for White residents39.4 40.8 33.9 Median age for Black or African American residents34.8 32.0 27.1 Median age for American Indian / Alaska Native residents25.3 23.5 39.8 Median age for Asian residents95.0 27.3 -666,666,666.0 Median age for Native Hawaiian / Pacific Islander residents-666,666,666.0 -666,666,666.0 20.3 Median age for Other race residents21.7 66.0 21.1 Median age for Two or more races residents28.9 30.8 39.0 Median age for White alone residents39.1 40.5 21.1 Median age for Hispanic or Latino residents21.3 25.8
Owner/renter occupied households by race in Bayou Cane
House owners and renters - White residents 3,681 70.5% Owner occupied1,538 29.5% Renter occupiedHouse owners and renters - Black or African American residents 314 36.0% Owner occupied557 64.0% Renter occupiedHouse owners and renters - American Indian / Alaska Native residents 121 60.4% Owner occupied79 39.6% Renter occupiedHouse owners and renters - Asian residents 47 32.6% Owner occupied97 67.4% Renter occupiedHouse owners and renters - Other race residents 67 84.1% Owner occupied13 15.9% Renter occupiedHouse owners and renters - Two or more races residents 500 87.8% Owner occupied69 12.2% Renter occupiedHouse owners and renters - White alone residents 3,668 69.8% Owner occupied1,587 30.2% Renter occupiedHouse owners and renters - Hispanic or Latino residents 381 94.2% Owner occupied23 5.8% Renter occupied
Language usage in Bayou Cane
English speakers - Total 88.4% of residents of Bayou Cane speak English at home.
5.9% of residents speak Spanish at home 1,041 88.6% Speak English very well134 11.4% Speak English less than very well5.7% of residents speak other language at home 962 84.8% Speak English very well172 15.2% Speak English less than very well
English speakers - Born in the United States 77.2% of residents of Bayou Cane speak English at home.
19.6% of residents speak Spanish at home 718 98.8% Speak English very well9 1.2% Speak English less than very well3.8% of residents speak other language at home 142 100.0% Speak English very well
English speakers - Native, born elsewhere 68.0% of residents of Bayou Cane speak English at home.
23.7% of residents speak Spanish at home 23 100.0% Speak English very well
English speakers - Foreign-born 19.9% of residents of Bayou Cane speak English at home.
28.5% of residents speak Spanish at home 148 71.2% Speak English very well60 28.8% Speak English less than very well51.5% of residents speak other language at home 273 72.6% Speak English very well103 27.4% Speak English less than very well
White (Caucasian) - Speak only English Native:
96.2% (11,460)Foreign-born:
53.3% (47)
White (Caucasian) - Speak another language Native:
3.7% (446)Foreign-born:
53.3% (47)
Black or African American - Speak only English Native:
99.7% (3,626)Foreign-born:
97.5% (23)
Asian - Speak another language Native:
100.0% (68)Foreign-born:
79.2% (289)
Other race - Speak another language Native:
65.8% (236)Foreign-born:
100.0% (48)
Two or more races - Speak another language Native:
43.0% (971)Foreign-born:
100.0% (244)
White alone - Speak only English Native:
95.8% (11,463)Foreign-born:
40.5% (53)
White alone - Speak another language Native:
4.1% (495)Foreign-born:
59.6% (78)
Hispanic or Latino - Speak another language Native:
28.5% (464)Foreign-born:
100.0% (296)
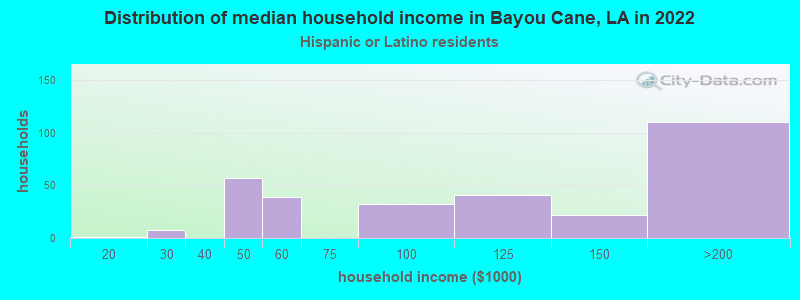
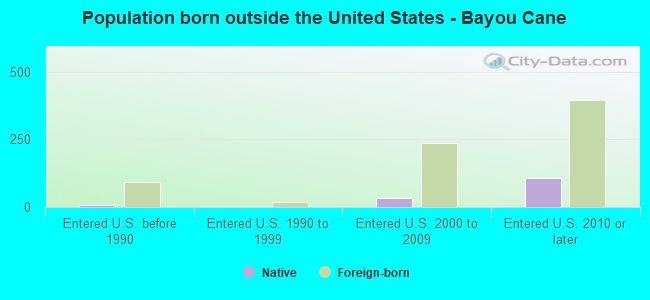
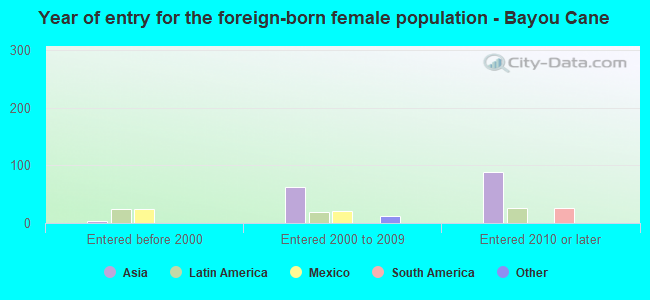
Foreign-born residents in Bayou Cane 759 residents are foreign born (1.8% Asia , 1.2% Latin America ).
This city:
3.7%Louisiana:
4.2%
Marital status for residents in Bayou Cane Marital status - White (Caucasian) population 15 years and over
Males 33.4% Never married49.8% Now married2.1% Separated3.3% Widowed11.4% DivorcedFemales 25.1% Never married47.2% Now married2.3% Separated12.6% Widowed12.7% DivorcedWomen who gave birth in the past 12 months Now married:
57.1% (87)Unmarried:
42.9% (65)
Women who did not give birth in the past 12 months Now married:
50.1% (1,356)Unmarried:
49.9% (1,351)
Marital status - Black or African American population 15 years and over
Males 67.3% Never married23.1% Now married0.0% Separated2.5% Widowed7.1% DivorcedFemales 54.9% Never married27.4% Now married0.0% Separated14.2% Widowed3.4% DivorcedWomen who gave birth in the past 12 months Now married:
0.0% (0)Unmarried:
100.0% (82)
Women who did not give birth in the past 12 months Now married:
22.6% (200)Unmarried:
77.4% (684)
Marital status - American Indian / Alaska Native population 15 years and over
Males 30.3% Never married54.2% Now married0.0% Separated5.7% Widowed9.9% DivorcedFemales 38.1% Never married52.5% Now married0.0% Separated0.0% Widowed9.4% DivorcedWomen who gave birth in the past 12 months Now married:
100.0% (79)Unmarried:
0.0% (0)
Women who did not give birth in the past 12 months Now married:
27.8% (55)Unmarried:
72.2% (142)
Marital status - Asian population 15 years and over
Males 0.0% Never married100.0% Now married0.0% Separated0.0% Widowed0.0% DivorcedFemales 38.0% Never married48.5% Now married13.5% Separated0.0% Widowed0.0% DivorcedWomen who did not give birth in the past 12 months Now married:
47.9% (59)Unmarried:
52.1% (64)
Marital status - Other race population 15 years and over
Males 96.5% Never married0.0% Now married0.0% Separated0.0% Widowed3.5% DivorcedFemales 7.3% Never married39.1% Now married0.0% Separated14.6% Widowed39.1% DivorcedWomen who did not give birth in the past 12 months Now married:
84.3% (63)Unmarried:
15.7% (12)
Marital status - Two or more races population 15 years and over
Males 59.5% Never married34.0% Now married0.0% Separated3.3% Widowed3.2% DivorcedFemales 59.2% Never married33.1% Now married7.7% Separated0.0% Widowed0.0% DivorcedWomen who gave birth in the past 12 months Now married:
0.0% (0)Unmarried:
100.0% (53)
Women who did not give birth in the past 12 months Now married:
32.4% (186)Unmarried:
67.6% (386)
Marital status - White alone, not Hispanic / Latino population 15 years and over
Males 33.1% Never married50.1% Now married2.2% Separated3.3% Widowed11.4% DivorcedFemales 25.1% Never married47.3% Now married2.3% Separated12.6% Widowed12.7% DivorcedWomen who gave birth in the past 12 months Now married:
57.1% (88)Unmarried:
42.9% (66)
Women who did not give birth in the past 12 months Now married:
50.2% (1,373)Unmarried:
49.8% (1,365)
Marital status - Hispanic or Latino population 15 years and over
Males 77.0% Never married21.2% Now married0.0% Separated0.0% Widowed1.7% DivorcedFemales 53.4% Never married39.1% Now married0.0% Separated3.4% Widowed4.2% DivorcedWomen who gave birth in the past 12 months Now married:
47.2% (35)Unmarried:
52.8% (39)
Women who did not give birth in the past 12 months Now married:
36.0% (132)Unmarried:
64.0% (235)
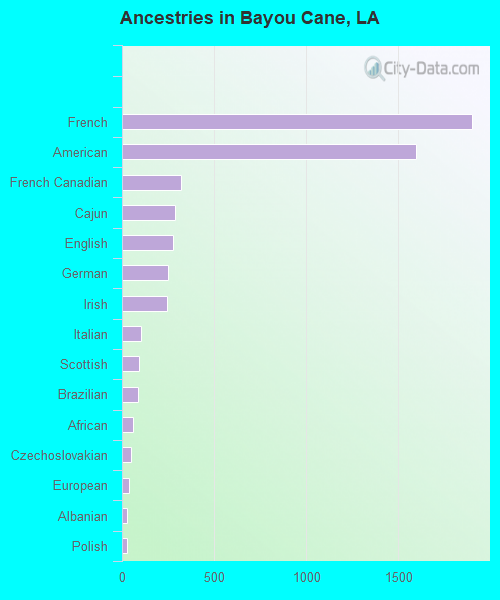
Ancestries in Bayou Cane
1,898 17.5% French1,598 14.7% American319 2.9% French Canadian290 2.7% Cajun275 2.5% English249 2.3% German247 2.3% Irish101 0.9% Italian95 0.9% Scottish89 0.8% Brazilian60 0.6% African48 0.4% Czechoslovakian40 0.4% European29 0.3% Albanian28 0.3% Polish12 0.1% Czech12 0.1% Russian8 0.07% Scotch-Irish
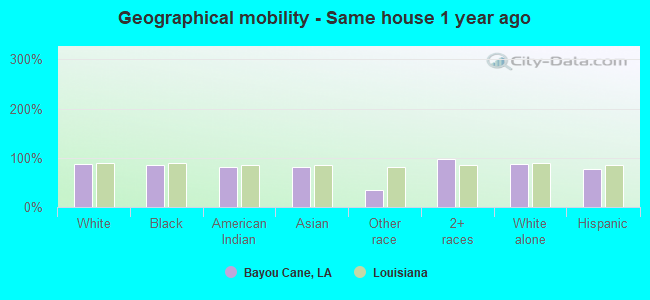
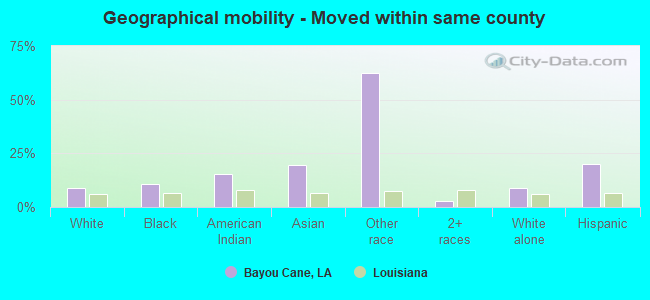
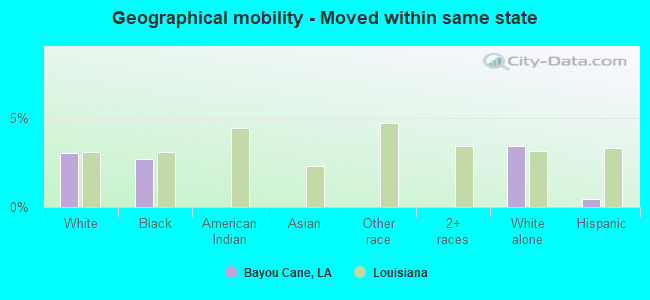
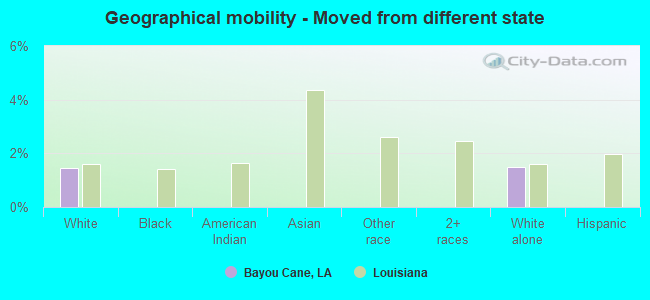
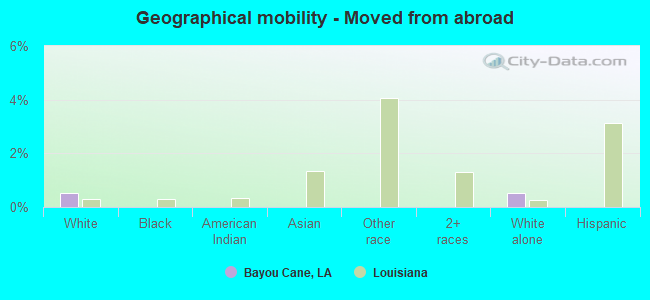
Geographical mobility in Bayou Cane Same house 1 year ago 10,414 86.8% White (Caucasian)3,335 85.6% Black or African American1,101 81.7% American Indian / Alaska Native353 81.5% Asian145 33.8% Other race2,575 97.1% Two or more races10,533 86.5% White alone, not Hispanic / Latino1,539 78.0% Hispanic or LatinoMoved within same county 1,060 8.8% White / Caucasian419 10.7% Black or African American206 15.3% American Indian / Alaska Native84 19.4% Asian268 62.4% Other race71 2.7% Two or more races1,062 8.7% White alone, not Hispanic / Latino398 20.2% Hispanic or LatinoMoved within same state 364 3.0% White / Caucasian104 2.7% Black or African American412 3.4% White alone, not Hispanic / Latino9 0.4% Hispanic or LatinoMoved from different state 173 1.4% White / Caucasian182 1.5% White alone, not Hispanic / LatinoMoved from abroad 65 0.5% White65 0.5% White alone, not Hispanic / Latino
Children Nativity (place of birth) in Bayou Cane
Children under 6 years - Living with two parents Both parents native 606 100.0% NativeBoth parents foreign-born 23 100.0% NativeOne native, one foreign-born parent 63 100.0% NativeChildren under 6 years - Living with one parent Native parent 609 100.0% NativeChildren 6 to 17 years - Living with two parents Both parents native 1,500 100.0% NativeBoth parents foreign-born 41 100.0% Foreign-bornOne native, one foreign-born parent 305 100.0% NativeChildren 6 to 17 years - Living with one parent Native parent 1,492 100.0% NativeForeign-born parent 21 50.6% Native20 49.4% Foreign-born
Grandparents responsible for own grandchildren in Bayou Cane
Grandparents (30 to 59 years) White / Caucasian 54 54.0% Responsible for grandchildren46 46.0% Not responsible for grandchildrenBlack or African American 74 100.0% Not responsible for grandchildrenAmerican Indian / Alaska Native 26 100.0% Responsible for grandchildrenTwo or more races 157 100.0% Not responsible for grandchildrenWhite alone, not Hispanic / Latino 56 54.7% Responsible for grandchildren46 45.3% Not responsible for grandchildrenHispanic or Latino 81 100.0% Not responsible for grandchildrenGrandparents (60 years and over) White / Caucasian 124 70.7% Responsible for grandchildren51 29.3% Not responsible for grandchildrenBlack or African American 4 5.3% Responsible for grandchildren65 94.7% Not responsible for grandchildrenAmerican Indian / Alaska Native 6 100.0% Responsible for grandchildrenTwo or more races 1 100.0% Responsible for grandchildrenWhite alone, not Hispanic / Latino 124 70.7% Responsible for grandchildren51 29.3% Not responsible for grandchildrenHispanic or Latino 1 90.3% Responsible for grandchildren