Races in Bear Swamp, South Carolina (SC) Detailed Stats
Ancestries, Foreign-born residents, place of birth
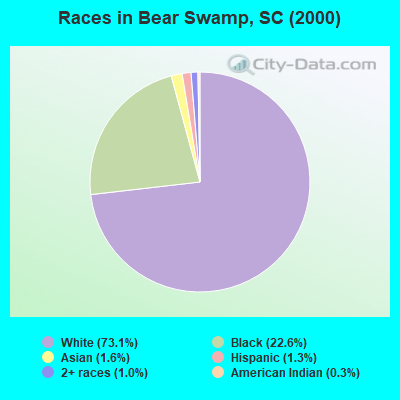
Race distribution in Bear Swamp

- 8,71673.1%White alone
- 2,70022.6%Black alone
- 1931.6%Asian alone
- 1541.3%Hispanic
- 1221.0%Two or more races
- 300.3%American Indian alone
- 60.05%Other race alone
- 10.01%Native Hawaiian and Other
Pacific Islander alone
2000
2022
-
- 2,652,29166.1%White alone
- 1,178,48629.4%Black alone
- 95,0762.4%Hispanic
- 35,5680.9%Asian alone
- 33,2900.8%Two or more races
- 12,7650.3%American Indian alone
- 3,2660.08%Other race alone
- 1,2700.03%Native Hawaiian and Other
Pacific Islander alone

-
- 3,301,73962.5%White alone
- 1,313,29024.9%Black alone
- 343,7836.5%Hispanic
- 190,5083.6%Two or more races
- 89,8881.7%Asian alone
- 29,3900.6%Other race alone
- 12,1120.2%American Indian alone
- 1,9240.04%Native Hawaiian and Other
Pacific Islander alone

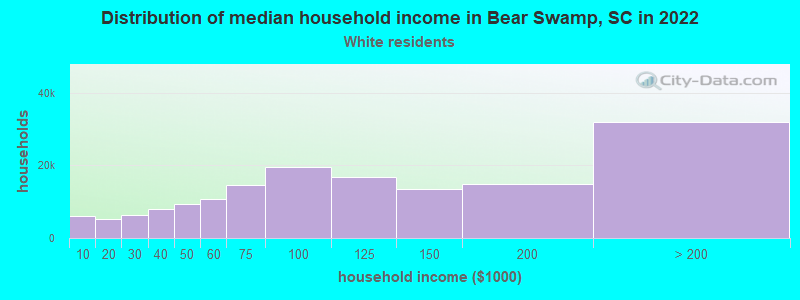
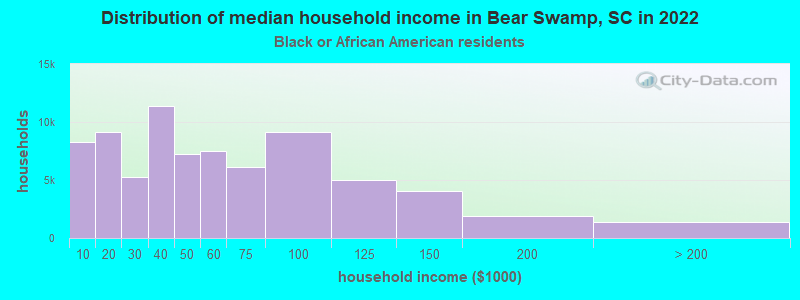
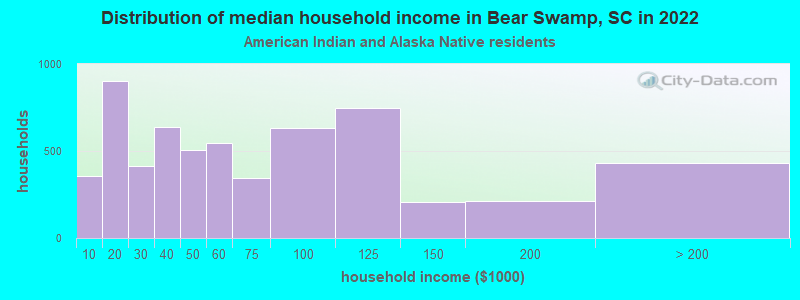
Income and house value in Bear Swamp
- Median household income in 2022
- $122,203White non-Hispanic householders
- $90,127Black householders
- $65,951American Indian and Alaska Native householders
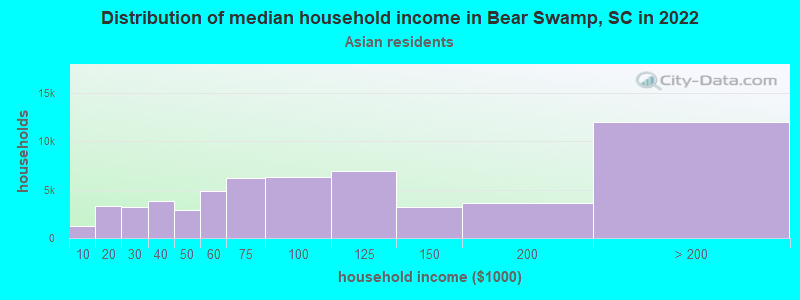
- $120,309Asian householders
- $168,330Some other race householders
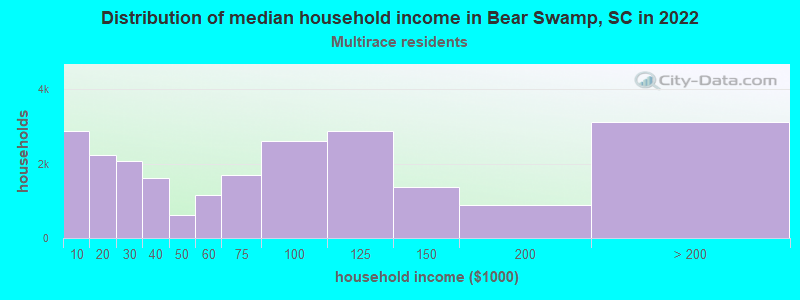
- over $200,000Two or more races householders
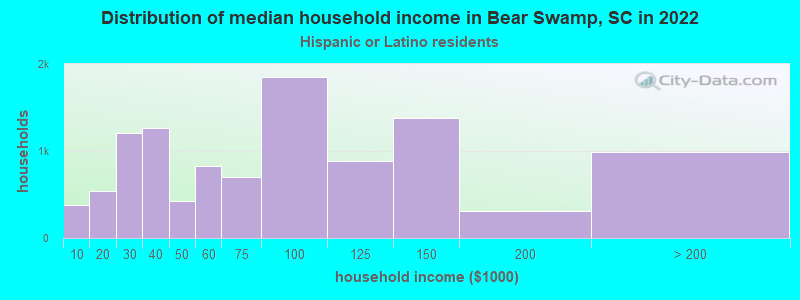
- $148,696Hispanic or Latino race householders
- Median 2022 house value
- $601,057White Non-Hispanic householders
- $327,205Black or African American householders
- $677,336American Indian or Alaska Native householders
- $625,233Asian householders
- $573,130Some other race householders
- $573,130Two or more races householders
- $557,708Hispanic or Latino householders
Household income for White non-Hispanic householders
Household income for Black householders
Household income for American Indian and Alaska Native householders
Household income for Asian householders
Household income for Two or more races householders
Household income for Hispanic or Latino race householders
Zip code: 29414