Races in Beaverton, Oregon (OR) Detailed Stats
Data:
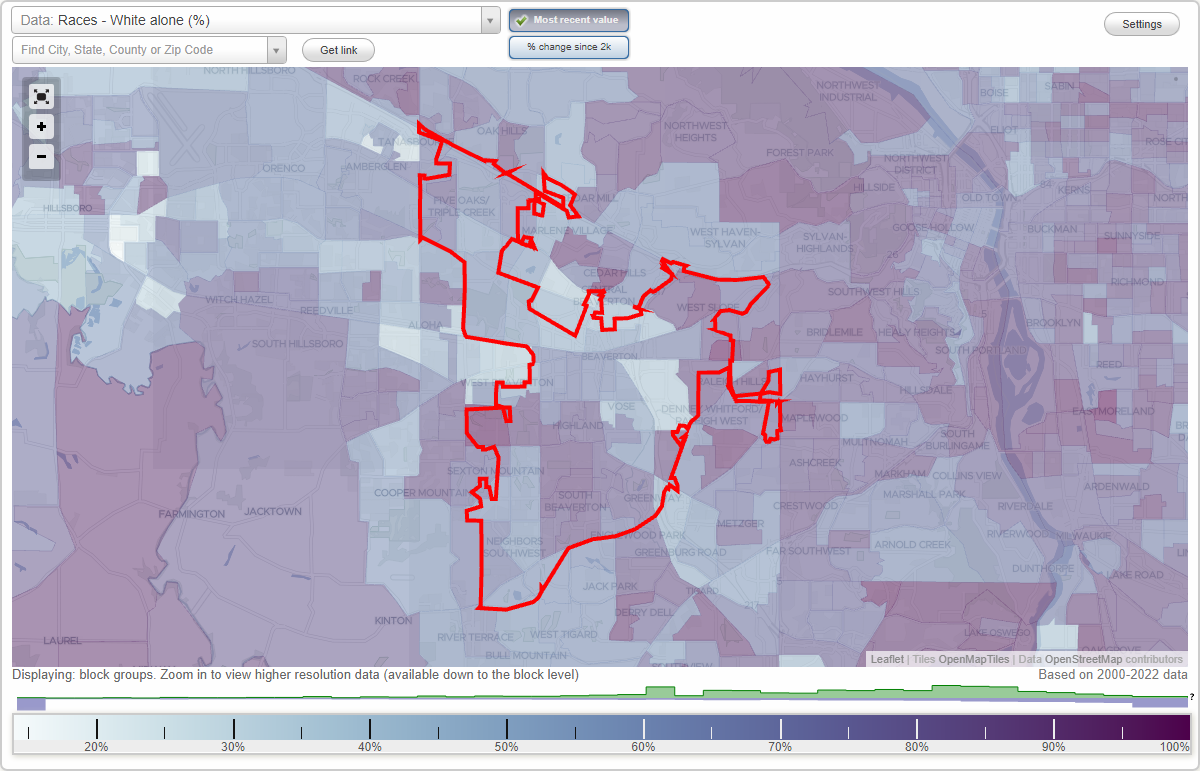
Races - White alone (%)
Races - White alone (% change since 2000)
Races - Black alone (%)
Races - Black alone (% change since 2000)
Races - American Indian alone (%)
Races - American Indian alone (% change since 2000)
Races - Asian alone (%)
Races - Asian alone (% change since 2000)
Races - Hispanic (%)
Races - Hispanic (% change since 2000)
Races - Native Hawaiian and Other Pacific Islander alone (%)
Races - Native Hawaiian and Other Pacific Islander alone (% change since 2000)
Races - Two or more races(%)
Races - Two or more races(% change since 2000)
Races - Other race alone (%)
Races - Other race alone (% change since 2000)
Racial diversity
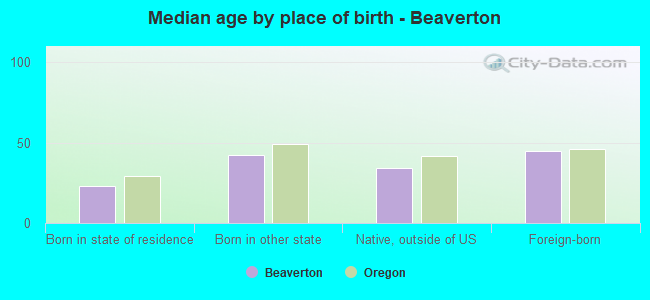
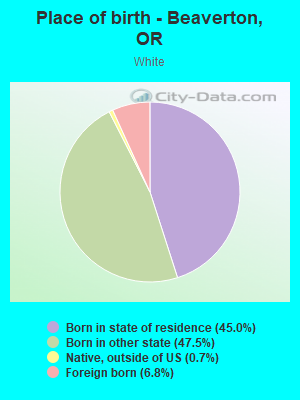
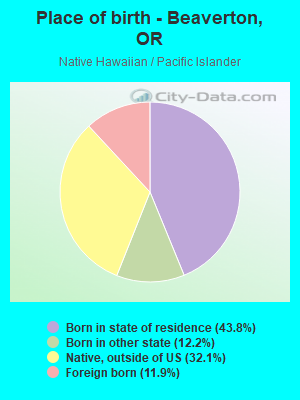
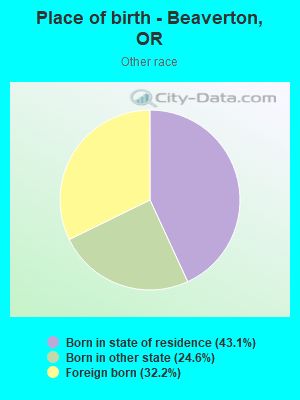
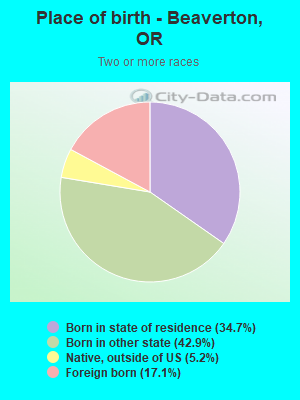
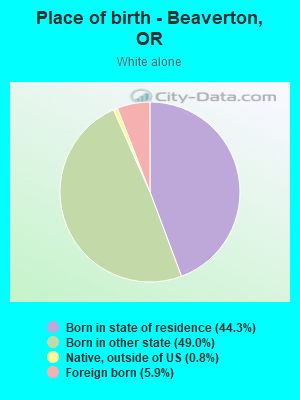
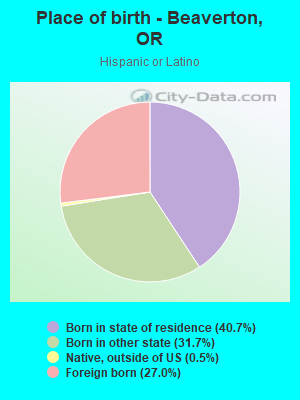
Place of birth - Born in state of residence (%)
Place of birth - Born in state of residence (%) - White
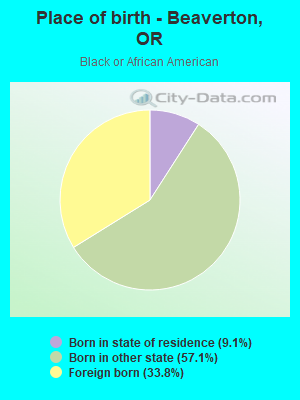
Place of birth - Born in state of residence (%) - Black or African American
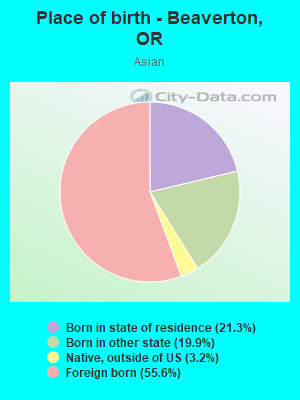
Place of birth - Born in state of residence (%) - Asian
Place of birth - Born in state of residence (%) - Hispanic or Latino
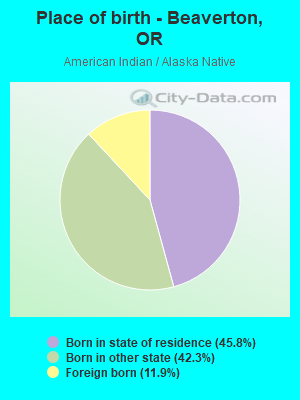
Place of birth - Born in state of residence (%) - American Indian and Alaska Native
Place of birth - Born in state of residence (%) - Multirace
Place of birth - Born in state of residence (%) - Other Race
Place of birth - Born in other state (%)
Place of birth - Born in other state (%) - White
Place of birth - Born in other state (%) - Black or African American
Place of birth - Born in other state (%) - Asian
Place of birth - Born in other state (%) - Hispanic or Latino
Place of birth - Born in other state (%) - American Indian and Alaska Native
Place of birth - Born in other state (%) - Multirace
Place of birth - Born in other state (%) - Other Race
Place of birth - Native, outside of US (%)
Place of birth - Native, outside of US (%) - White
Place of birth - Native, outside of US (%) - Black or African American
Place of birth - Native, outside of US (%) - Asian
Place of birth - Native, outside of US (%) - Hispanic or Latino
Place of birth - Native, outside of US (%) - American Indian and Alaska Native
Place of birth - Native, outside of US (%) - Multirace
Place of birth - Native, outside of US (%) - Other Race
Place of birth - Foreign born (%)
Place of birth - Foreign born (%) - White
Place of birth - Foreign born (%) - Black or African American
Place of birth - Foreign born (%) - Asian
Place of birth - Foreign born (%) - Hispanic or Latino
Place of birth - Foreign born (%) - American Indian and Alaska Native
Place of birth - Foreign born (%) - Multirace
Place of birth - Foreign born (%) - Other Race
Residents speaking English at home (%)
Residents speaking English at home - Born in the United States (%)
Residents speaking English at home - Native, born elsewhere (%)
Residents speaking English at home - Foreign born (%)
Residents speaking Spanish at home (%)
Residents speaking Spanish at home - Born in the United States (%)
Residents speaking Spanish at home - Native, born elsewhere (%)
Residents speaking Spanish at home - Foreign born (%)
Residents speaking other language at home (%)
Residents speaking other language at home - Born in the United States (%)
Residents speaking other language at home - Native, born elsewhere (%)
Residents speaking other language at home - Foreign born (%)
Marital status - Never married (%)
Marital status - Now married (%)
Marital status - Separated (%)
Marital status - Widowed (%)
Marital status - Divorced (%)
Ancestries Reported - Arab (%)
Ancestries Reported - Czech (%)
Ancestries Reported - Danish (%)
Ancestries Reported - Dutch (%)
Ancestries Reported - English (%)
Ancestries Reported - French (%)
Ancestries Reported - French Canadian (%)
Ancestries Reported - German (%)
Ancestries Reported - Greek (%)
Ancestries Reported - Hungarian (%)
Ancestries Reported - Irish (%)
Ancestries Reported - Italian (%)
Ancestries Reported - Lithuanian (%)
Ancestries Reported - Norwegian (%)
Ancestries Reported - Polish (%)
Ancestries Reported - Portuguese (%)
Ancestries Reported - Russian (%)
Ancestries Reported - Scotch-Irish (%)
Ancestries Reported - Scottish (%)
Ancestries Reported - Slovak (%)
Ancestries Reported - Subsaharan African (%)
Ancestries Reported - Swedish (%)
Ancestries Reported - Swiss (%)
Ancestries Reported - Ukrainian (%)
Ancestries Reported - United States (%)
Ancestries Reported - Welsh (%)
Ancestries Reported - West Indian (%)
Ancestries Reported - Other (%)
Geographical mobility - Same house 1 year ago (%)
Geographical mobility - Same house 1 year ago (%) - White
Geographical mobility - Same house 1 year ago (%) - Black or African American
Geographical mobility - Same house 1 year ago (%) - Asian
Geographical mobility - Same house 1 year ago (%) - Hispanic or Latino
Geographical mobility - Same house 1 year ago (%) - American Indian and Alaska Native
Geographical mobility - Same house 1 year ago (%) - Multirace
Geographical mobility - Same house 1 year ago (%) - Other Race
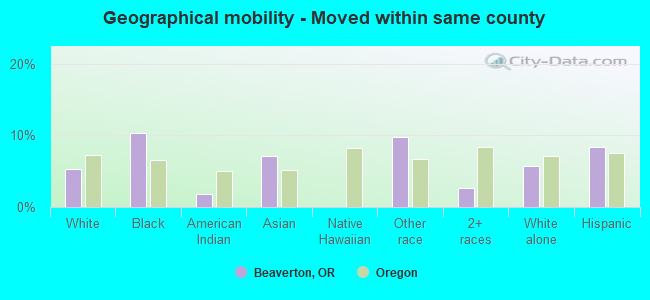
Geographical mobility - Moved within same county (%)
Geographical mobility - Moved within same county (%) - White
Geographical mobility - Moved within same county (%) - Black or African American
Geographical mobility - Moved within same county (%) - Asian
Geographical mobility - Moved within same county (%) - Hispanic or Latino
Geographical mobility - Moved within same county (%) - American Indian and Alaska Native
Geographical mobility - Moved within same county (%) - Multirace
Geographical mobility - Moved within same county (%) - Other Race
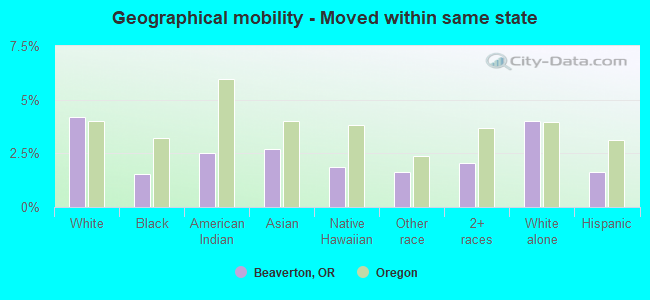
Geographical mobility - Moved from different county within same state (%)
Geographical mobility - Moved from different county within same state (%) - White
Geographical mobility - Moved from different county within same state (%) - Black or African American
Geographical mobility - Moved from different county within same state (%) - Asian
Geographical mobility - Moved from different county within same state (%) - Hispanic or Latino
Geographical mobility - Moved from different county within same state (%) - American Indian and Alaska Native
Geographical mobility - Moved from different county within same state (%) - Multirace
Geographical mobility - Moved from different county within same state (%) - Other Race
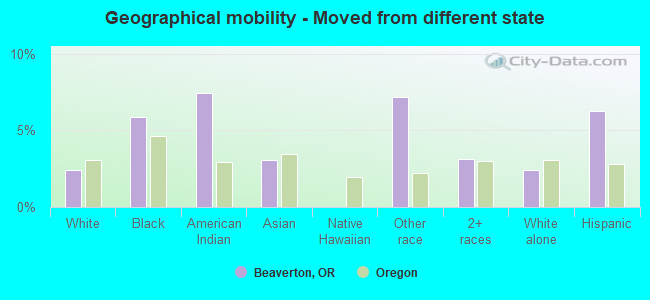
Geographical mobility - Moved from different state (%)
Geographical mobility - Moved from different state (%) - White
Geographical mobility - Moved from different state (%) - Black or African American
Geographical mobility - Moved from different state (%) - Asian
Geographical mobility - Moved from different state (%) - Hispanic or Latino
Geographical mobility - Moved from different state (%) - American Indian and Alaska Native
Geographical mobility - Moved from different state (%) - Multirace
Geographical mobility - Moved from different state (%) - Other Race
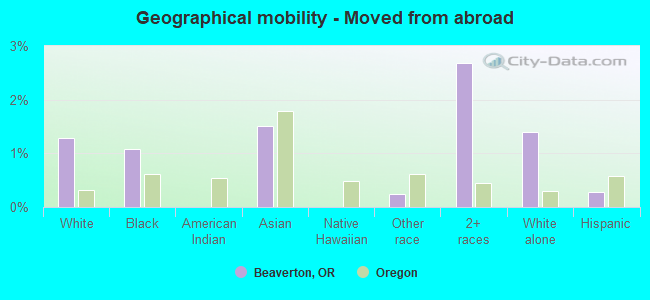
Geographical mobility - Moved from abroad (%)
Geographical mobility - Moved from abroad (%) - White
Geographical mobility - Moved from abroad (%) - Black or African American
Geographical mobility - Moved from abroad (%) - Asian
Geographical mobility - Moved from abroad (%) - Hispanic or Latino
Geographical mobility - Moved from abroad (%) - American Indian and Alaska Native
Geographical mobility - Moved from abroad (%) - Multirace
Geographical mobility - Moved from abroad (%) - Other Race
Place of birth for the foreign-born population - Ireland (%)
Place of birth for the foreign-born population - Denmark (%)
Place of birth for the foreign-born population - Norway (%)
Place of birth for the foreign-born population - Sweden (%)
Place of birth for the foreign-born population - United Kingdom (%)
Place of birth for the foreign-born population - England (%)
Place of birth for the foreign-born population - Scotland (%)
Place of birth for the foreign-born population - Other Northern Europe (%)
Place of birth for the foreign-born population - Austria (%)
Place of birth for the foreign-born population - Belgium (%)
Place of birth for the foreign-born population - France (%)
Place of birth for the foreign-born population - Germany (%)
Place of birth for the foreign-born population - Netherlands (%)
Place of birth for the foreign-born population - Switzerland (%)
Place of birth for the foreign-born population - Other Western Europe (%)
Place of birth for the foreign-born population - Greece (%)
Place of birth for the foreign-born population - Italy (%)
Place of birth for the foreign-born population - Portugal (%)
Place of birth for the foreign-born population - Spain (%)
Place of birth for the foreign-born population - Other Southern Europe (%)
Place of birth for the foreign-born population - Albania (%)
Place of birth for the foreign-born population - Belarus (%)
Place of birth for the foreign-born population - Bosnia and Herzegovina (%)
Place of birth for the foreign-born population - Bulgaria (%)
Place of birth for the foreign-born population - Croatia (%)
Place of birth for the foreign-born population - Czechoslovakia (%)
Place of birth for the foreign-born population - Hungary (%)
Place of birth for the foreign-born population - Latvia (%)
Place of birth for the foreign-born population - Lithuania (%)
Place of birth for the foreign-born population - North Macedonia (Macedonia) (%)
Place of birth for the foreign-born population - Moldova (%)
Place of birth for the foreign-born population - Poland (%)
Place of birth for the foreign-born population - Romania (%)
Place of birth for the foreign-born population - Russia (%)
Place of birth for the foreign-born population - Serbia (%)
Place of birth for the foreign-born population - Ukraine (%)
Place of birth for the foreign-born population - Other Eastern Europe (%)
Place of birth for the foreign-born population - China (%)
Place of birth for the foreign-born population - Hong Kong (%)
Place of birth for the foreign-born population - Taiwan (%)
Place of birth for the foreign-born population - Japan (%)
Place of birth for the foreign-born population - Korea (%)
Place of birth for the foreign-born population - Other Eastern Asia (%)
Place of birth for the foreign-born population - Afghanistan (%)
Place of birth for the foreign-born population - Bangladesh (%)
Place of birth for the foreign-born population - India (%)
Place of birth for the foreign-born population - Iran (%)
Place of birth for the foreign-born population - Kazakhstan (%)
Place of birth for the foreign-born population - Nepal (%)
Place of birth for the foreign-born population - Pakistan (%)
Place of birth for the foreign-born population - Sri Lanka (%)
Place of birth for the foreign-born population - Uzbekistan (%)
Place of birth for the foreign-born population - Other South Central Asia (%)
Place of birth for the foreign-born population - Burma (%)
Place of birth for the foreign-born population - Cambodia (%)
Place of birth for the foreign-born population - Indonesia (%)
Place of birth for the foreign-born population - Laos (%)
Place of birth for the foreign-born population - Malaysia (%)
Place of birth for the foreign-born population - Philippines (%)
Place of birth for the foreign-born population - Singapore (%)
Place of birth for the foreign-born population - Thailand (%)
Place of birth for the foreign-born population - Vietnam (%)
Place of birth for the foreign-born population - Other South Eastern Asia (%)
Place of birth for the foreign-born population - Armenia (%)
Place of birth for the foreign-born population - Iraq (%)
Place of birth for the foreign-born population - Israel (%)
Place of birth for the foreign-born population - Jordan (%)
Place of birth for the foreign-born population - Kuwait (%)
Place of birth for the foreign-born population - Lebanon (%)
Place of birth for the foreign-born population - Saudi Arabia (%)
Place of birth for the foreign-born population - Syria (%)
Place of birth for the foreign-born population - Turkey (%)
Place of birth for the foreign-born population - Yemen (%)
Place of birth for the foreign-born population - Other Western Asia (%)
Place of birth for the foreign-born population - Eritrea (%)
Place of birth for the foreign-born population - Ethiopia (%)
Place of birth for the foreign-born population - Kenya (%)
Place of birth for the foreign-born population - Somalia (%)
Place of birth for the foreign-born population - Uganda (%)
Place of birth for the foreign-born population - Zimbabwe (%)
Place of birth for the foreign-born population - Other Eastern Africa (%)
Place of birth for the foreign-born population - Cameroon (%)
Place of birth for the foreign-born population - Congo (%)
Place of birth for the foreign-born population - Democratic Republic of Congo (Zaire) (%)
Place of birth for the foreign-born population - Other Middle Africa (%)
Place of birth for the foreign-born population - Egypt (%)
Place of birth for the foreign-born population - Morocco (%)
Place of birth for the foreign-born population - Sudan (%)
Place of birth for the foreign-born population - Other Northern Africa (%)
Place of birth for the foreign-born population - South Africa (%)
Place of birth for the foreign-born population - Other Southern Africa (%)
Place of birth for the foreign-born population - Cabo Verde (%)
Place of birth for the foreign-born population - Ghana (%)
Place of birth for the foreign-born population - Liberia (%)
Place of birth for the foreign-born population - Nigeria (%)
Place of birth for the foreign-born population - Senegal (%)
Place of birth for the foreign-born population - Sierra Leone (%)
Place of birth for the foreign-born population - Other Western Africa (%)
Place of birth for the foreign-born population - Australia (%)
Place of birth for the foreign-born population - New Zealand (%)
Place of birth for the foreign-born population - Fiji (%)
Place of birth for the foreign-born population - Micronesia (%)
Place of birth for the foreign-born population - Bahamas (%)
Place of birth for the foreign-born population - Barbados (%)
Place of birth for the foreign-born population - Cuba (%)
Place of birth for the foreign-born population - Dominica (%)
Place of birth for the foreign-born population - Dominican Republic (%)
Place of birth for the foreign-born population - Grenada (%)
Place of birth for the foreign-born population - Haiti (%)
Place of birth for the foreign-born population - Jamaica (%)
Place of birth for the foreign-born population - St. Vincent and the Grenadines (%)
Place of birth for the foreign-born population - Trinidad and Tobago (%)
Place of birth for the foreign-born population - West Indies (%)
Place of birth for the foreign-born population - Other Caribbean (%)
Place of birth for the foreign-born population - Belize (%)
Place of birth for the foreign-born population - Costa Rica (%)
Place of birth for the foreign-born population - El Salvador (%)
Place of birth for the foreign-born population - Guatemala (%)
Place of birth for the foreign-born population - Honduras (%)
Place of birth for the foreign-born population - Mexico (%)
Place of birth for the foreign-born population - Nicaragua (%)
Place of birth for the foreign-born population - Panama (%)
Place of birth for the foreign-born population - Other Central America (%)
Place of birth for the foreign-born population - Argentina (%)
Place of birth for the foreign-born population - Bolivia (%)
Place of birth for the foreign-born population - Brazil (%)
Place of birth for the foreign-born population - Chile (%)
Place of birth for the foreign-born population - Colombia (%)
Place of birth for the foreign-born population - Ecuador (%)
Place of birth for the foreign-born population - Guyana (%)
Place of birth for the foreign-born population - Peru (%)
Place of birth for the foreign-born population - Uruguay (%)
Place of birth for the foreign-born population - Venezuela (%)
Place of birth for the foreign-born population - Other South America (%)
Place of birth for the foreign-born population - Canada (%)
Place of birth for the foreign-born population - Other Northern America (%)
Place of birth for the foreign-born population - Other (%)
Latest news about races in Beaverton, OR collected exclusively by city-data.com from local newspapers, TV, and radio stations
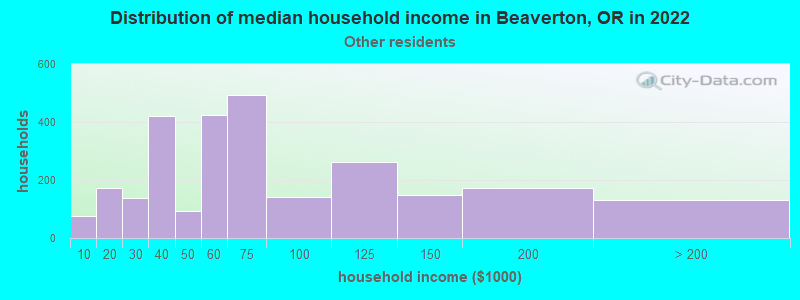
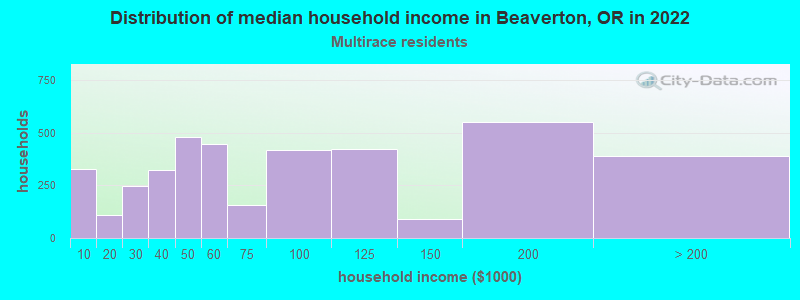
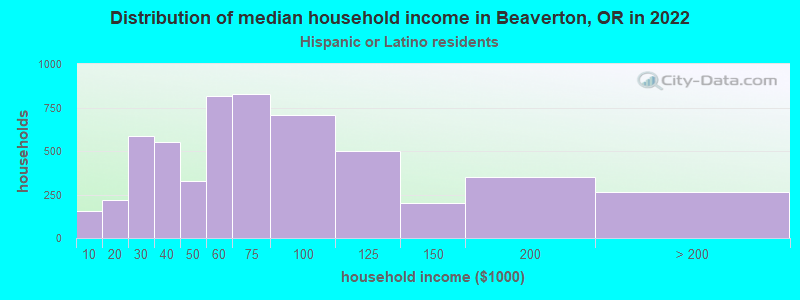
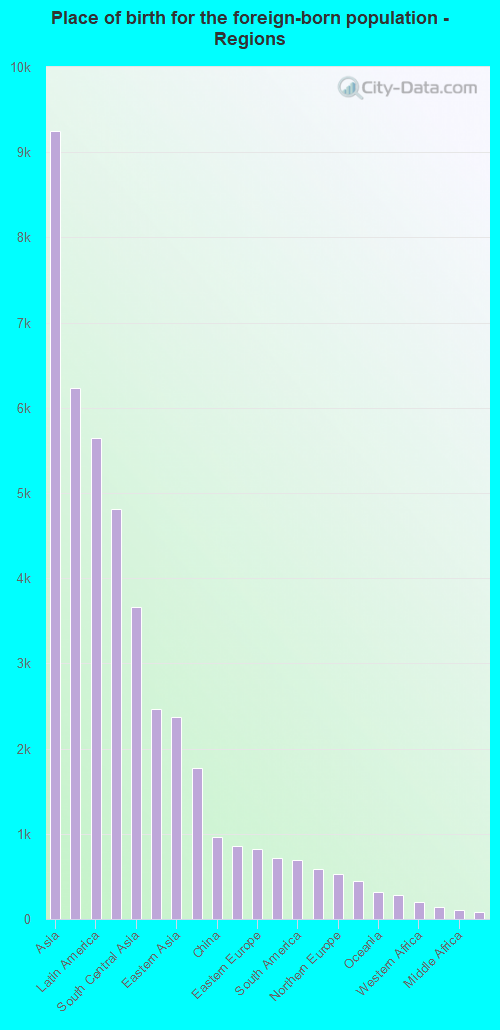
According to 2022 data, the most numerous races in Beaverton, OR are White alone (55,213 residents), Hispanic (18,997 residents), and Two or more races (7,220 residents). 71.4% of Beaverton residents speak English at home. 18.9% of Beaverton, OR residents are foreign-born (9.3% born in Asia, 5.7% born in Latin America), which is 52.3% greater than the foreign-born rate of 9.0% across the entire state of Oregon.
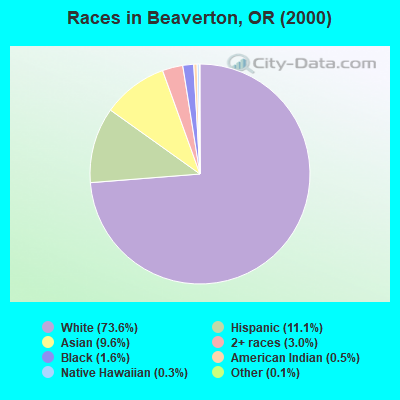
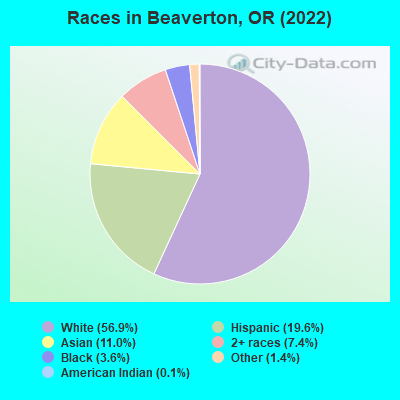
Race distribution in Beaverton
2000 2022
56,035 73.6% White alone 8,463 11.1% Hispanic 7,310 9.6% Asian alone 2,317 3.0% Two or more races 1,243 1.6% Black alone 384 0.5% American Indian alone 263 0.3% Native Hawaiian and Other 114 0.1% Other race alone
55,213 56.9% White alone 18,997 19.6% Hispanic 10,671 11.0% Asian alone 7,220 7.4% Two or more races 3,476 3.6% Black alone 1,312 1.4% Other race alone 110 0.1% American Indian alone 65 0.07% Native Hawaiian and Other
2000 2022
2,857,616 83.5% White alone 275,314 8.0% Hispanic 100,333 2.9% Asian alone 82,733 2.4% Two or more races 53,325 1.6% Black alone 40,130 1.2% American Indian alone 7,398 0.2% Native Hawaiian and Other 4,550 0.1% Other race alone
3,037,571 71.6% White alone 609,538 14.4% Hispanic 252,744 6.0% Two or more races 191,283 4.5% Asian alone 78,228 1.8% Black alone 29,399 0.7% American Indian alone 25,731 0.6% Other race alone 15,643 0.4% Native Hawaiian and Other
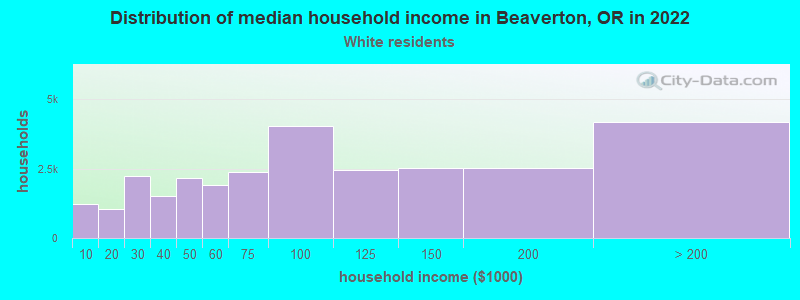
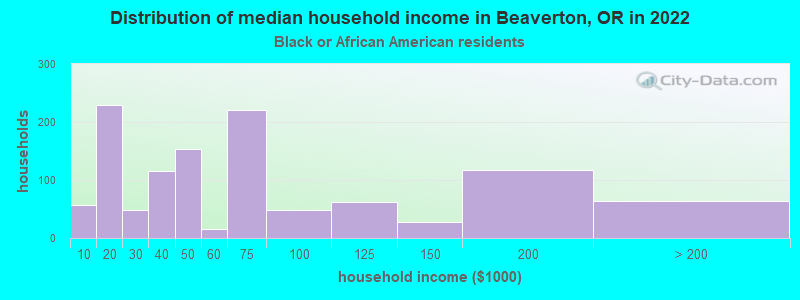
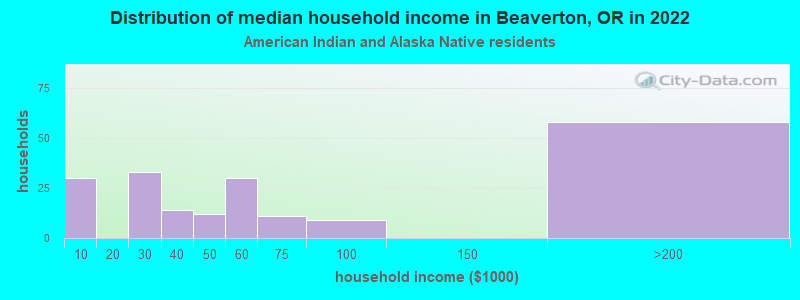
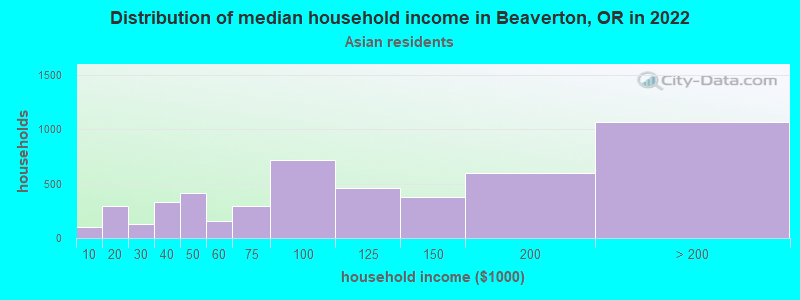
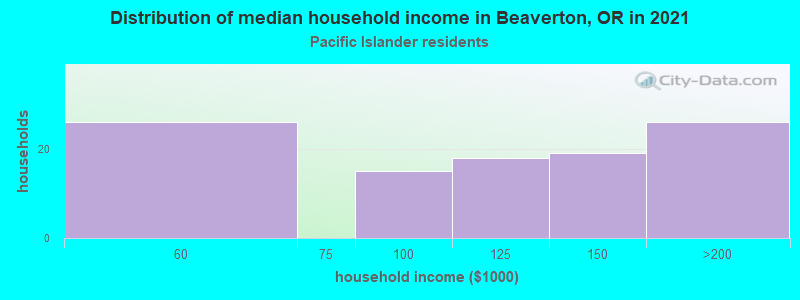
Income and house value in Beaverton Median household income in 2022 $89,421 White non-Hispanic householders$42,813 Black householders$50,471 American Indian and Alaska Native householders$97,667 Asian householders$58,270 Some other race householders$80,943 Two or more races householders$59,039 Hispanic or Latino race householdersMedian 2022 house value $577,454 White Non-Hispanic householders$568,269 Black or African American householders$574,086 American Indian or Alaska Native householders $645,120 Asian householders$599,499 Native Hawaiian and other Pacific Islander householders$574,086 Some other race householders$600,111 Two or more races householders$548,367 Hispanic or Latino householders
Median age by race in Beaverton
39.5 Median age for White residents37.5 42.3 28.9 Median age for Black or African American residents28.6 30.1 46.8 Median age for American Indian / Alaska Native residents53.1 41.6 34.8 Median age for Asian residents30.2 43.2 10.9 Median age for Native Hawaiian / Pacific Islander residents10.4 11.5 22.7 Median age for Other race residents19.5 26.2 26.4 Median age for Two or more races residents25.4 27.8 41.3 Median age for White alone residents38.7 44.2 22.6 Median age for Hispanic or Latino residents17.2 26.3
Owner/renter occupied households by race in Beaverton
House owners and renters - White residents 14,801 52.6% Owner occupied13,322 47.4% Renter occupiedHouse owners and renters - Black or African American residents 149 15.9% Owner occupied787 84.1% Renter occupiedHouse owners and renters - American Indian / Alaska Native residents 90 42.6% Owner occupied121 57.4% Renter occupiedHouse owners and renters - Asian residents 2,179 57.9% Owner occupied1,585 42.1% Renter occupiedHouse owners and renters - Native Hawaiian / Pacific Islander residents 31 29.7% Owner occupied74 70.3% Renter occupiedHouse owners and renters - Other race residents 674 29.2% Owner occupied1,631 70.8% Renter occupiedHouse owners and renters - Two or more races residents 1,596 52.5% Owner occupied1,443 47.5% Renter occupiedHouse owners and renters - White alone residents 14,650 55.2% Owner occupied11,883 44.8% Renter occupiedHouse owners and renters - Hispanic or Latino residents 1,302 25.2% Owner occupied3,860 74.8% Renter occupied
Language usage in Beaverton
English speakers - Total 71.4% of residents of Beaverton speak English at home.
12.5% of residents speak Spanish at home 8,311 72.8% Speak English very well3,098 27.2% Speak English less than very well16.0% of residents speak other language at home 10,411 71.3% Speak English very well4,194 28.7% Speak English less than very well
English speakers - Born in the United States 86.9% of residents of Beaverton speak English at home.
6.6% of residents speak Spanish at home 2,301 87.4% Speak English very well331 12.6% Speak English less than very well6.6% of residents speak other language at home 2,263 85.6% Speak English very well382 14.4% Speak English less than very well
English speakers - Native, born elsewhere 65.2% of residents of Beaverton speak English at home.
34.8% of residents speak other language at home 493 100.0% Speak English very well
English speakers - Foreign-born 14.6% of residents of Beaverton speak English at home.
30.2% of residents speak Spanish at home 2,468 50.3% Speak English very well2,435 49.7% Speak English less than very well55.2% of residents speak other language at home 5,441 60.8% Speak English very well3,506 39.2% Speak English less than very well
White (Caucasian) - Speak only English Native:
89.9% (48,422)Foreign-born:
27.4% (1,116)
White (Caucasian) - Speak another language Native:
10.1% (5,449)Foreign-born:
72.6% (2,964)
Black or African American - Speak only English Native:
81.0% (1,563)Foreign-born:
40.9% (328)
Black or African American - Speak another language Native:
19.9% (384)Foreign-born:
56.9% (456)
American Indian / Alaska Native - Speak only English Native:
98.6% (270)Foreign-born:
65.8% (24)
American Indian / Alaska Native - Speak another language Native:
7.6% (21)Foreign-born:
48.3% (18)
Asian - Speak only English Native:
65.5% (2,704)Foreign-born:
12.0% (714)
Asian - Speak another language Native:
34.5% (1,422)Foreign-born:
88.0% (5,224)
Native Hawaiian / Pacific Islander - Speak only English Native:
52.3% (293)Foreign-born:
10.8% (9)
Native Hawaiian / Pacific Islander - Speak another language Native:
49.1% (275)Foreign-born:
89.3% (76)
Other race - Speak only English Native:
45.4% (2,185)Foreign-born:
1.9% (51)
Other race - Speak another language Native:
54.6% (2,633)Foreign-born:
98.1% (2,590)
Two or more races - Speak only English Native:
88.4% (7,610)Foreign-born:
7.1% (150)
Two or more races - Speak another language Native:
11.6% (994)Foreign-born:
92.9% (1,973)
White alone - Speak only English Native:
93.8% (46,904)Foreign-born:
34.4% (1,116)
White alone - Speak another language Native:
6.2% (3,078)Foreign-born:
65.6% (2,126)
Hispanic or Latino - Speak only English Native:
46.3% (5,264)Foreign-born:
0.9% (46)
Hispanic or Latino - Speak another language Native:
53.7% (6,105)Foreign-born:
99.1% (4,847)
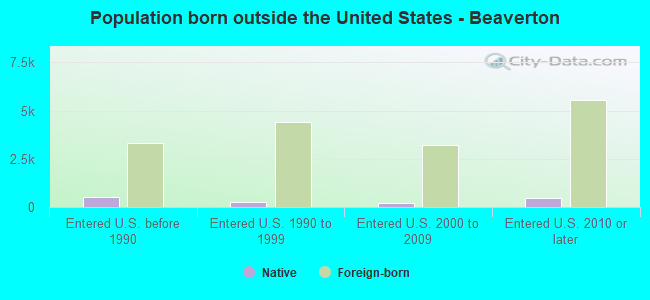
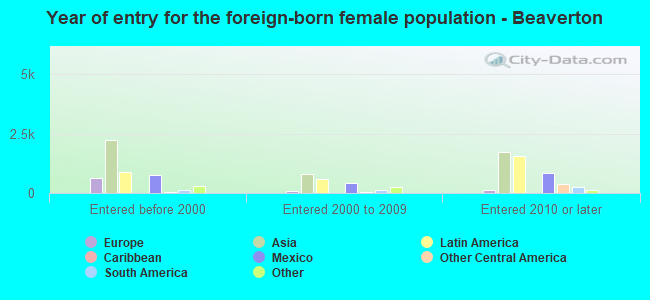
Foreign-born residents in Beaverton 18,430 residents are foreign born (9.3% Asia , 5.7% Latin America ).
This city:
18.9%Oregon:
9.8%
Marital status for residents in Beaverton Marital status - White (Caucasian) population 15 years and over
Males 40.3% Never married47.3% Now married1.2% Separated3.8% Widowed7.4% DivorcedFemales 30.3% Never married42.4% Now married0.2% Separated7.3% Widowed19.8% DivorcedWomen who gave birth in the past 12 months Now married:
61.0% (499)Unmarried:
39.0% (319)
Women who did not give birth in the past 12 months Now married:
43.8% (6,087)Unmarried:
56.2% (7,824)
Marital status - Black or African American population 15 years and over
Males 49.3% Never married43.5% Now married0.0% Separated5.2% Widowed2.0% DivorcedFemales 42.0% Never married37.1% Now married0.0% Separated4.6% Widowed16.3% DivorcedWomen who gave birth in the past 12 months Now married:
40.5% (16)Unmarried:
59.5% (23)
Women who did not give birth in the past 12 months Now married:
34.0% (156)Unmarried:
66.0% (302)
Marital status - American Indian / Alaska Native population 15 years and over
Males 14.0% Never married48.8% Now married20.7% Separated0.0% Widowed16.5% DivorcedFemales 8.1% Never married66.4% Now married0.0% Separated0.0% Widowed25.5% DivorcedWomen who did not give birth in the past 12 months Now married:
58.9% (58)Unmarried:
41.1% (40)
Marital status - Asian population 15 years and over
Males 41.1% Never married54.5% Now married0.0% Separated0.0% Widowed4.4% DivorcedFemales 30.1% Never married52.7% Now married1.9% Separated5.1% Widowed10.1% DivorcedWomen who gave birth in the past 12 months Now married:
100.0% (225)Unmarried:
0.0% (0)
Women who did not give birth in the past 12 months Now married:
47.1% (1,358)Unmarried:
52.9% (1,525)
Marital status - Native Hawaiian / Pacific Islander population 15 years and over
Males 60.4% Never married39.6% Now married0.0% Separated0.0% Widowed0.0% DivorcedFemales 35.4% Never married62.4% Now married0.0% Separated2.1% Widowed0.0% DivorcedWomen who gave birth in the past 12 months Now married:
100.0% (56)Unmarried:
0.0% (0)
Women who did not give birth in the past 12 months Now married:
48.5% (83)Unmarried:
51.5% (88)
Marital status - Other race population 15 years and over
Males 56.7% Never married35.8% Now married1.3% Separated0.6% Widowed5.6% DivorcedFemales 49.1% Never married35.5% Now married6.1% Separated0.5% Widowed8.8% DivorcedWomen who gave birth in the past 12 months Now married:
50.6% (55)Unmarried:
49.4% (53)
Women who did not give birth in the past 12 months Now married:
35.0% (797)Unmarried:
65.0% (1,479)
Marital status - Two or more races population 15 years and over
Males 42.2% Never married52.8% Now married0.0% Separated0.3% Widowed4.8% DivorcedFemales 45.0% Never married43.2% Now married0.9% Separated4.9% Widowed5.9% DivorcedWomen who gave birth in the past 12 months Now married:
27.8% (133)Unmarried:
72.2% (345)
Women who did not give birth in the past 12 months Now married:
46.4% (1,507)Unmarried:
53.6% (1,738)
Marital status - White alone, not Hispanic / Latino population 15 years and over
Males 39.2% Never married48.7% Now married1.3% Separated4.1% Widowed6.7% DivorcedFemales 29.7% Never married41.5% Now married0.2% Separated7.8% Widowed20.9% DivorcedWomen who gave birth in the past 12 months Now married:
61.0% (499)Unmarried:
39.0% (319)
Women who did not give birth in the past 12 months Now married:
42.2% (5,273)Unmarried:
57.8% (7,232)
Marital status - Hispanic or Latino population 15 years and over
Males 49.6% Never married42.6% Now married0.0% Separated0.0% Widowed7.8% DivorcedFemales 43.6% Never married40.8% Now married4.1% Separated1.5% Widowed10.0% DivorcedWomen who gave birth in the past 12 months Now married:
31.6% (133)Unmarried:
68.4% (288)
Women who did not give birth in the past 12 months Now married:
47.1% (2,042)Unmarried:
52.9% (2,290)
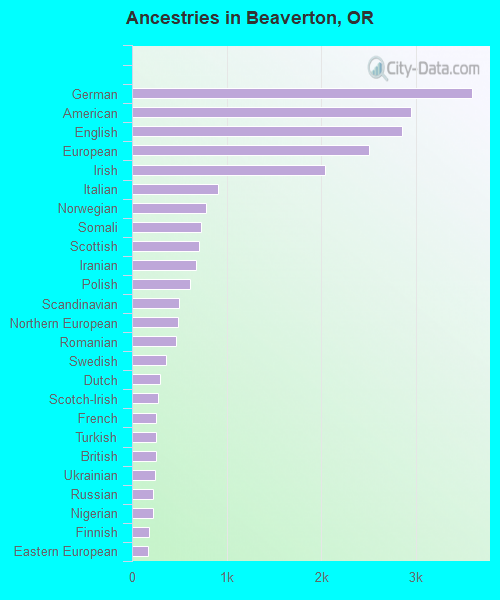
Ancestries in Beaverton
3,597 7.3% German2,951 6.0% American2,857 5.8% English2,506 5.1% European2,045 4.1% Irish906 1.8% Italian786 1.6% Norwegian732 1.5% Somali704 1.4% Scottish676 1.4% Iranian614 1.2% Polish497 1.0% Scandinavian491 1.0% Northern European461 0.9% Romanian362 0.7% Swedish298 0.6% Dutch280 0.6% Scotch-Irish257 0.5% French255 0.5% Turkish252 0.5% British239 0.5% Ukrainian225 0.5% Russian222 0.4% Nigerian177 0.4% Finnish174 0.4% Eastern European154 0.3% Canadian153 0.3% Afghan149 0.3% Hungarian142 0.3% Sudanese140 0.3% Serbian139 0.3% Lebanese121 0.2% Swiss117 0.2% French Canadian106 0.2% Danish100 0.2% African89 0.2% Welsh85 0.2% Czech70 0.1% Austrian70 0.1% Iraqi61 0.1% Palestinian55 0.1% Jordanian50 0.1% Belgian48 0.10% Israeli43 0.09% Haitian39 0.08% Greek39 0.08% West Indian38 0.08% Armenian36 0.07% Croatian35 0.07% Portuguese33 0.07% Ghanaian32 0.06% Egyptian27 0.05% Brazilian26 0.05% Lithuanian19 0.04% Jamaican18 0.04% Syrian17 0.03% Basque17 0.03% Luxembourger16 0.03% Cape Verdean13 0.03% South African11 0.02% Macedonian10 0.02% Kenyan9 0.02% Cajun9 0.02% Ethiopian9 0.02% Slovak3 0.01% Yugoslavian
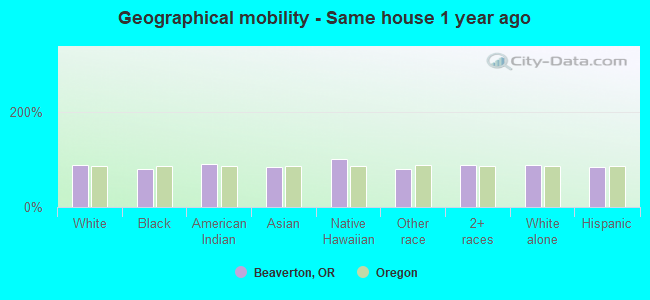
Geographical mobility in Beaverton Same house 1 year ago 51,534 86.9% White (Caucasian)2,086 78.9% Black or African American364 89.9% American Indian / Alaska Native10,063 83.1% Asian689 100.0% Native Hawaiian / Pacific Islander6,342 80.5% Other race10,683 89.5% Two or more races47,088 86.5% White alone, not Hispanic / Latino14,658 84.2% Hispanic or LatinoMoved within same county 3,124 5.3% White / Caucasian273 10.3% Black or African American7 1.8% American Indian / Alaska Native856 7.1% Asian775 9.8% Other race315 2.6% Two or more races3,085 5.7% White alone, not Hispanic / Latino1,462 8.4% Hispanic or LatinoMoved within same state 2,478 4.2% White / Caucasian41 1.5% Black or African American10 2.5% American Indian / Alaska Native325 2.7% Asian12 1.9% Native Hawaiian / Pacific Islander129 1.6% Other race245 2.1% Two or more races2,176 4.0% White alone, not Hispanic / Latino280 1.6% Hispanic or LatinoMoved from different state 1,430 2.4% White / Caucasian154 5.8% Black or African American30 7.4% American Indian / Alaska Native374 3.1% Asian567 7.2% Other race376 3.1% Two or more races1,308 2.4% White alone, not Hispanic / Latino1,085 6.2% Hispanic or LatinoMoved from abroad 764 1.3% White29 1.1% Black or African American183 1.5% Asian19 0.2% Other race321 2.7% Two or more races764 1.4% White alone, not Hispanic / Latino49 0.3% Hispanic or Latino
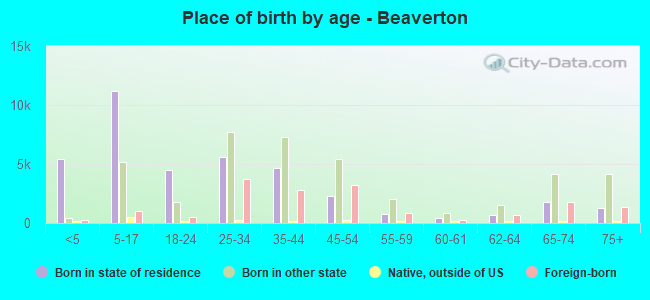
Children Nativity (place of birth) in Beaverton
Children under 6 years - Living with two parents Both parents native 3,651 100.0% NativeBoth parents foreign-born 1,229 100.0% NativeOne native, one foreign-born parent 1,006 100.0% NativeChildren under 6 years - Living with one parent Native parent 1,516 100.0% NativeForeign-born parent 234 100.0% Foreign-bornChildren 6 to 17 years - Living with two parents Both parents native 6,177 99.2% Native48 0.8% Foreign-bornBoth parents foreign-born 3,436 93.8% Native228 6.2% Foreign-bornOne native, one foreign-born parent 1,580 100.0% NativeChildren 6 to 17 years - Living with one parent Native parent 1,945 100.0% NativeForeign-born parent 1,787 61.6% Native1,115 38.4% Foreign-born
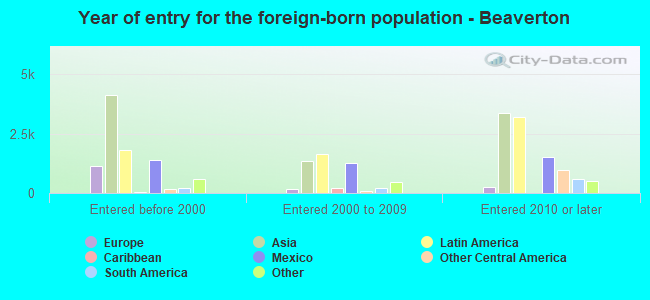
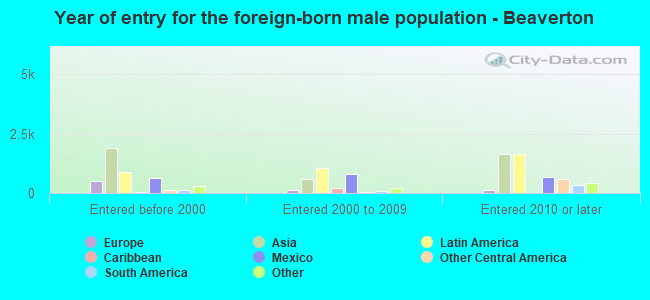
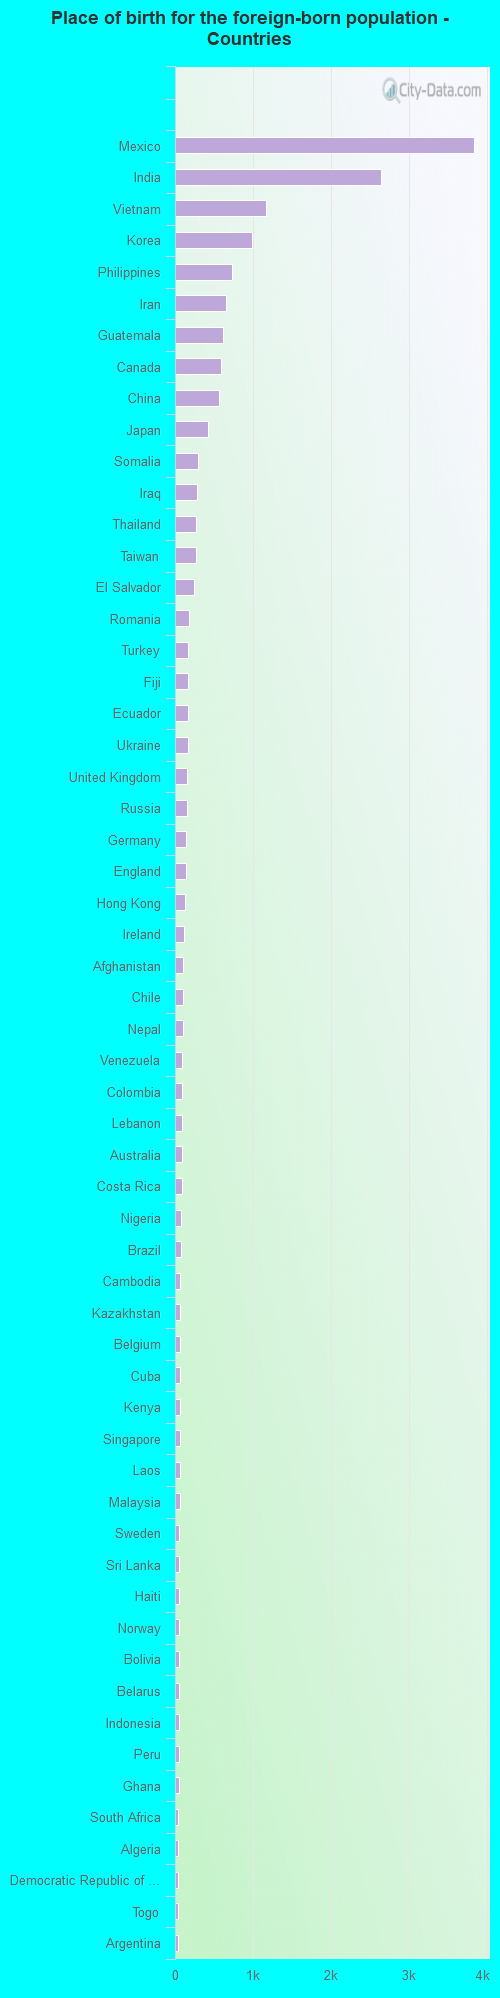
Place of birth for residents in Beaverton 9,247 Asia6,233 Americas5,641 Latin America4,818 Central America3,664 South Central Asia2,469 South Eastern Asia2,366 Eastern Asia1,773 Europe959 China854 Africa824 Eastern Europe717 Western Asia688 South America591 Northern America525 Northern Europe446 Eastern Africa322 Oceania277 Western Europe198 Western Africa135 Caribbean106 Middle Africa86 Australia and New Zealand Subregion58 Northern Africa44 Southern Africa37 Southern Europe3,836 Mexico2,641 India1,163 Vietnam985 Korea729 Philippines654 Iran618 Guatemala591 Canada568 China422 Japan292 Somalia278 Iraq275 Thailand268 Taiwan240 El Salvador183 Romania173 Turkey169 Fiji168 Ecuador167 Ukraine152 United Kingdom151 Russia146 Germany143 England122 Hong Kong117 Ireland108 Afghanistan99 Chile97 Nepal96 Venezuela95 Colombia87 Lebanon86 Australia86 Costa Rica81 Nigeria78 Brazil70 Cambodia70 Kazakhstan68 Belgium68 Cuba64 Kenya63 Singapore60 Laos59 Malaysia57 Sweden56 Sri Lanka50 Haiti48 Norway48 Bolivia47 Belarus47 Indonesia46 Peru45 Ghana44 South Africa43 Algeria43 Democratic Republic of Congo (Zaire)40 Togo36 Argentina34 Cameroon34 Azerbaijan29 Israel28 Bosnia and Herzegovina28 Saudi Arabia27 Congo26 Syria25 Nicaragua25 Croatia20 Spain20 Switzerland17 Czechoslovakia17 Zimbabwe16 Trinidad and Tobago16 Uruguay15 Netherlands15 North Macedonia (Macedonia)15 Moldova15 Poland14 Egypt14 Jordan14 Austria14 Armenia14 Latvia12 Kuwait12 Bulgaria12 France12 Hungary11 Ethiopia11 Uzbekistan11 Pakistan10 Panama9 Greece9 Tanzania8 Italy6 Scotland
Grandparents responsible for own grandchildren in Beaverton
Grandparents (30 to 59 years) White / Caucasian 21 10.2% Responsible for grandchildren185 89.8% Not responsible for grandchildrenBlack or African American 2 100.0% Responsible for grandchildrenAsian 55 100.0% Not responsible for grandchildrenTwo or more races 18 25.8% Responsible for grandchildren51 74.2% Not responsible for grandchildrenWhite alone, not Hispanic / Latino 22 9.2% Responsible for grandchildren216 90.8% Not responsible for grandchildrenHispanic or Latino 35 100.0% Not responsible for grandchildrenGrandparents (60 years and over) White / Caucasian 17 4.0% Responsible for grandchildren414 96.0% Not responsible for grandchildrenAsian 1 0.7% Responsible for grandchildren138 99.3% Not responsible for grandchildrenTwo or more races 33 17.8% Responsible for grandchildren152 82.2% Not responsible for grandchildrenWhite alone, not Hispanic / Latino 18 3.5% Responsible for grandchildren501 96.5% Not responsible for grandchildren