Races in Bellflower, California (CA) Detailed Stats
Data:
Races - White alone (%)
Races - White alone (% change since 2000)
Races - Black alone (%)
Races - Black alone (% change since 2000)
Races - American Indian alone (%)
Races - American Indian alone (% change since 2000)
Races - Asian alone (%)
Races - Asian alone (% change since 2000)
Races - Hispanic (%)
Races - Hispanic (% change since 2000)
Races - Native Hawaiian and Other Pacific Islander alone (%)
Races - Native Hawaiian and Other Pacific Islander alone (% change since 2000)
Races - Two or more races(%)
Races - Two or more races(% change since 2000)
Races - Other race alone (%)
Races - Other race alone (% change since 2000)
Racial diversity
Place of birth - Born in state of residence (%)
Place of birth - Born in state of residence (%) - White
Place of birth - Born in state of residence (%) - Black or African American
Place of birth - Born in state of residence (%) - Asian
Place of birth - Born in state of residence (%) - Hispanic or Latino
Place of birth - Born in state of residence (%) - American Indian and Alaska Native
Place of birth - Born in state of residence (%) - Multirace
Place of birth - Born in state of residence (%) - Other Race
Place of birth - Born in other state (%)
Place of birth - Born in other state (%) - White
Place of birth - Born in other state (%) - Black or African American
Place of birth - Born in other state (%) - Asian
Place of birth - Born in other state (%) - Hispanic or Latino
Place of birth - Born in other state (%) - American Indian and Alaska Native
Place of birth - Born in other state (%) - Multirace
Place of birth - Born in other state (%) - Other Race
Place of birth - Native, outside of US (%)
Place of birth - Native, outside of US (%) - White
Place of birth - Native, outside of US (%) - Black or African American
Place of birth - Native, outside of US (%) - Asian
Place of birth - Native, outside of US (%) - Hispanic or Latino
Place of birth - Native, outside of US (%) - American Indian and Alaska Native
Place of birth - Native, outside of US (%) - Multirace
Place of birth - Native, outside of US (%) - Other Race
Place of birth - Foreign born (%)
Place of birth - Foreign born (%) - White
Place of birth - Foreign born (%) - Black or African American
Place of birth - Foreign born (%) - Asian
Place of birth - Foreign born (%) - Hispanic or Latino
Place of birth - Foreign born (%) - American Indian and Alaska Native
Place of birth - Foreign born (%) - Multirace
Place of birth - Foreign born (%) - Other Race
Residents speaking English at home (%)
Residents speaking English at home - Born in the United States (%)
Residents speaking English at home - Native, born elsewhere (%)
Residents speaking English at home - Foreign born (%)
Residents speaking Spanish at home (%)
Residents speaking Spanish at home - Born in the United States (%)
Residents speaking Spanish at home - Native, born elsewhere (%)
Residents speaking Spanish at home - Foreign born (%)
Residents speaking other language at home (%)
Residents speaking other language at home - Born in the United States (%)
Residents speaking other language at home - Native, born elsewhere (%)
Residents speaking other language at home - Foreign born (%)
Marital status - Never married (%)
Marital status - Now married (%)
Marital status - Separated (%)
Marital status - Widowed (%)
Marital status - Divorced (%)
Ancestries Reported - Arab (%)
Ancestries Reported - Czech (%)
Ancestries Reported - Danish (%)
Ancestries Reported - Dutch (%)
Ancestries Reported - English (%)
Ancestries Reported - French (%)
Ancestries Reported - French Canadian (%)
Ancestries Reported - German (%)
Ancestries Reported - Greek (%)
Ancestries Reported - Hungarian (%)
Ancestries Reported - Irish (%)
Ancestries Reported - Italian (%)
Ancestries Reported - Lithuanian (%)
Ancestries Reported - Norwegian (%)
Ancestries Reported - Polish (%)
Ancestries Reported - Portuguese (%)
Ancestries Reported - Russian (%)
Ancestries Reported - Scotch-Irish (%)
Ancestries Reported - Scottish (%)
Ancestries Reported - Slovak (%)
Ancestries Reported - Subsaharan African (%)
Ancestries Reported - Swedish (%)
Ancestries Reported - Swiss (%)
Ancestries Reported - Ukrainian (%)
Ancestries Reported - United States (%)
Ancestries Reported - Welsh (%)
Ancestries Reported - West Indian (%)
Ancestries Reported - Other (%)
Geographical mobility - Same house 1 year ago (%)
Geographical mobility - Same house 1 year ago (%) - White
Geographical mobility - Same house 1 year ago (%) - Black or African American
Geographical mobility - Same house 1 year ago (%) - Asian
Geographical mobility - Same house 1 year ago (%) - Hispanic or Latino
Geographical mobility - Same house 1 year ago (%) - American Indian and Alaska Native
Geographical mobility - Same house 1 year ago (%) - Multirace
Geographical mobility - Same house 1 year ago (%) - Other Race
Geographical mobility - Moved within same county (%)
Geographical mobility - Moved within same county (%) - White
Geographical mobility - Moved within same county (%) - Black or African American
Geographical mobility - Moved within same county (%) - Asian
Geographical mobility - Moved within same county (%) - Hispanic or Latino
Geographical mobility - Moved within same county (%) - American Indian and Alaska Native
Geographical mobility - Moved within same county (%) - Multirace
Geographical mobility - Moved within same county (%) - Other Race
Geographical mobility - Moved from different county within same state (%)
Geographical mobility - Moved from different county within same state (%) - White
Geographical mobility - Moved from different county within same state (%) - Black or African American
Geographical mobility - Moved from different county within same state (%) - Asian
Geographical mobility - Moved from different county within same state (%) - Hispanic or Latino
Geographical mobility - Moved from different county within same state (%) - American Indian and Alaska Native
Geographical mobility - Moved from different county within same state (%) - Multirace
Geographical mobility - Moved from different county within same state (%) - Other Race
Geographical mobility - Moved from different state (%)
Geographical mobility - Moved from different state (%) - White
Geographical mobility - Moved from different state (%) - Black or African American
Geographical mobility - Moved from different state (%) - Asian
Geographical mobility - Moved from different state (%) - Hispanic or Latino
Geographical mobility - Moved from different state (%) - American Indian and Alaska Native
Geographical mobility - Moved from different state (%) - Multirace
Geographical mobility - Moved from different state (%) - Other Race
Geographical mobility - Moved from abroad (%)
Geographical mobility - Moved from abroad (%) - White
Geographical mobility - Moved from abroad (%) - Black or African American
Geographical mobility - Moved from abroad (%) - Asian
Geographical mobility - Moved from abroad (%) - Hispanic or Latino
Geographical mobility - Moved from abroad (%) - American Indian and Alaska Native
Geographical mobility - Moved from abroad (%) - Multirace
Geographical mobility - Moved from abroad (%) - Other Race
Place of birth for the foreign-born population - Ireland (%)
Place of birth for the foreign-born population - Denmark (%)
Place of birth for the foreign-born population - Norway (%)
Place of birth for the foreign-born population - Sweden (%)
Place of birth for the foreign-born population - United Kingdom (%)
Place of birth for the foreign-born population - England (%)
Place of birth for the foreign-born population - Scotland (%)
Place of birth for the foreign-born population - Other Northern Europe (%)
Place of birth for the foreign-born population - Austria (%)
Place of birth for the foreign-born population - Belgium (%)
Place of birth for the foreign-born population - France (%)
Place of birth for the foreign-born population - Germany (%)
Place of birth for the foreign-born population - Netherlands (%)
Place of birth for the foreign-born population - Switzerland (%)
Place of birth for the foreign-born population - Other Western Europe (%)
Place of birth for the foreign-born population - Greece (%)
Place of birth for the foreign-born population - Italy (%)
Place of birth for the foreign-born population - Portugal (%)
Place of birth for the foreign-born population - Spain (%)
Place of birth for the foreign-born population - Other Southern Europe (%)
Place of birth for the foreign-born population - Albania (%)
Place of birth for the foreign-born population - Belarus (%)
Place of birth for the foreign-born population - Bosnia and Herzegovina (%)
Place of birth for the foreign-born population - Bulgaria (%)
Place of birth for the foreign-born population - Croatia (%)
Place of birth for the foreign-born population - Czechoslovakia (%)
Place of birth for the foreign-born population - Hungary (%)
Place of birth for the foreign-born population - Latvia (%)
Place of birth for the foreign-born population - Lithuania (%)
Place of birth for the foreign-born population - North Macedonia (Macedonia) (%)
Place of birth for the foreign-born population - Moldova (%)
Place of birth for the foreign-born population - Poland (%)
Place of birth for the foreign-born population - Romania (%)
Place of birth for the foreign-born population - Russia (%)
Place of birth for the foreign-born population - Serbia (%)
Place of birth for the foreign-born population - Ukraine (%)
Place of birth for the foreign-born population - Other Eastern Europe (%)
Place of birth for the foreign-born population - China (%)
Place of birth for the foreign-born population - Hong Kong (%)
Place of birth for the foreign-born population - Taiwan (%)
Place of birth for the foreign-born population - Japan (%)
Place of birth for the foreign-born population - Korea (%)
Place of birth for the foreign-born population - Other Eastern Asia (%)
Place of birth for the foreign-born population - Afghanistan (%)
Place of birth for the foreign-born population - Bangladesh (%)
Place of birth for the foreign-born population - India (%)
Place of birth for the foreign-born population - Iran (%)
Place of birth for the foreign-born population - Kazakhstan (%)
Place of birth for the foreign-born population - Nepal (%)
Place of birth for the foreign-born population - Pakistan (%)
Place of birth for the foreign-born population - Sri Lanka (%)
Place of birth for the foreign-born population - Uzbekistan (%)
Place of birth for the foreign-born population - Other South Central Asia (%)
Place of birth for the foreign-born population - Burma (%)
Place of birth for the foreign-born population - Cambodia (%)
Place of birth for the foreign-born population - Indonesia (%)
Place of birth for the foreign-born population - Laos (%)
Place of birth for the foreign-born population - Malaysia (%)
Place of birth for the foreign-born population - Philippines (%)
Place of birth for the foreign-born population - Singapore (%)
Place of birth for the foreign-born population - Thailand (%)
Place of birth for the foreign-born population - Vietnam (%)
Place of birth for the foreign-born population - Other South Eastern Asia (%)
Place of birth for the foreign-born population - Armenia (%)
Place of birth for the foreign-born population - Iraq (%)
Place of birth for the foreign-born population - Israel (%)
Place of birth for the foreign-born population - Jordan (%)
Place of birth for the foreign-born population - Kuwait (%)
Place of birth for the foreign-born population - Lebanon (%)
Place of birth for the foreign-born population - Saudi Arabia (%)
Place of birth for the foreign-born population - Syria (%)
Place of birth for the foreign-born population - Turkey (%)
Place of birth for the foreign-born population - Yemen (%)
Place of birth for the foreign-born population - Other Western Asia (%)
Place of birth for the foreign-born population - Eritrea (%)
Place of birth for the foreign-born population - Ethiopia (%)
Place of birth for the foreign-born population - Kenya (%)
Place of birth for the foreign-born population - Somalia (%)
Place of birth for the foreign-born population - Uganda (%)
Place of birth for the foreign-born population - Zimbabwe (%)
Place of birth for the foreign-born population - Other Eastern Africa (%)
Place of birth for the foreign-born population - Cameroon (%)
Place of birth for the foreign-born population - Congo (%)
Place of birth for the foreign-born population - Democratic Republic of Congo (Zaire) (%)
Place of birth for the foreign-born population - Other Middle Africa (%)
Place of birth for the foreign-born population - Egypt (%)
Place of birth for the foreign-born population - Morocco (%)
Place of birth for the foreign-born population - Sudan (%)
Place of birth for the foreign-born population - Other Northern Africa (%)
Place of birth for the foreign-born population - South Africa (%)
Place of birth for the foreign-born population - Other Southern Africa (%)
Place of birth for the foreign-born population - Cabo Verde (%)
Place of birth for the foreign-born population - Ghana (%)
Place of birth for the foreign-born population - Liberia (%)
Place of birth for the foreign-born population - Nigeria (%)
Place of birth for the foreign-born population - Senegal (%)
Place of birth for the foreign-born population - Sierra Leone (%)
Place of birth for the foreign-born population - Other Western Africa (%)
Place of birth for the foreign-born population - Australia (%)
Place of birth for the foreign-born population - New Zealand (%)
Place of birth for the foreign-born population - Fiji (%)
Place of birth for the foreign-born population - Micronesia (%)
Place of birth for the foreign-born population - Bahamas (%)
Place of birth for the foreign-born population - Barbados (%)
Place of birth for the foreign-born population - Cuba (%)
Place of birth for the foreign-born population - Dominica (%)
Place of birth for the foreign-born population - Dominican Republic (%)
Place of birth for the foreign-born population - Grenada (%)
Place of birth for the foreign-born population - Haiti (%)
Place of birth for the foreign-born population - Jamaica (%)
Place of birth for the foreign-born population - St. Vincent and the Grenadines (%)
Place of birth for the foreign-born population - Trinidad and Tobago (%)
Place of birth for the foreign-born population - West Indies (%)
Place of birth for the foreign-born population - Other Caribbean (%)
Place of birth for the foreign-born population - Belize (%)
Place of birth for the foreign-born population - Costa Rica (%)
Place of birth for the foreign-born population - El Salvador (%)
Place of birth for the foreign-born population - Guatemala (%)
Place of birth for the foreign-born population - Honduras (%)
Place of birth for the foreign-born population - Mexico (%)
Place of birth for the foreign-born population - Nicaragua (%)
Place of birth for the foreign-born population - Panama (%)
Place of birth for the foreign-born population - Other Central America (%)
Place of birth for the foreign-born population - Argentina (%)
Place of birth for the foreign-born population - Bolivia (%)
Place of birth for the foreign-born population - Brazil (%)
Place of birth for the foreign-born population - Chile (%)
Place of birth for the foreign-born population - Colombia (%)
Place of birth for the foreign-born population - Ecuador (%)
Place of birth for the foreign-born population - Guyana (%)
Place of birth for the foreign-born population - Peru (%)
Place of birth for the foreign-born population - Uruguay (%)
Place of birth for the foreign-born population - Venezuela (%)
Place of birth for the foreign-born population - Other South America (%)
Place of birth for the foreign-born population - Canada (%)
Place of birth for the foreign-born population - Other Northern America (%)
Place of birth for the foreign-born population - Other (%)
Latest news about races in Bellflower, CA collected exclusively by city-data.com from local newspapers, TV, and radio stations
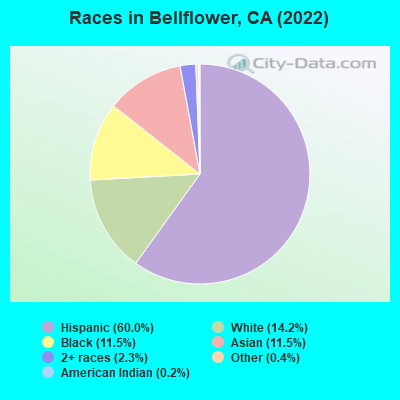
According to 2022 data, the most numerous races in Bellflower, CA are Hispanic (47,289 residents), White alone (8,241 residents), and Asian alone (6,854 residents). 43.2% of Bellflower residents speak English at home. 32.1% of Bellflower, CA residents are foreign-born (20.5% born in Latin America, 8.8% born in Asia), which is 19.0% greater than the foreign-born rate of 26.0% across the entire state of California.
Race distribution in Bellflower
2000 2022
31,503 43.2% Hispanic 22,403 30.7% White alone 9,239 12.7% Black alone 6,976 9.6% Asian alone 1,814 2.5% Two or more races 475 0.7% Native Hawaiian and Other 280 0.4% American Indian alone 188 0.3% Other race alone
47,289 61.7% Hispanic 12,524 16.4% Black alone 8,241 10.8% White alone 6,854 8.9% Asian alone 1,953 2.6% Two or more races 238 0.3% Native Hawaiian and Other 50 0.07% American Indian alone
2000 2022
15,816,790 46.7% White alone 10,966,556 32.4% Hispanic 3,648,860 10.8% Asian alone 2,181,926 6.4% Black alone 903,115 2.7% Two or more races 178,984 0.5% American Indian alone 103,736 0.3% Native Hawaiian and Other 71,681 0.2% Other race alone
15,732,184 40.3% Hispanic 13,160,426 33.7% White alone 5,957,867 15.3% Asian alone 2,025,218 5.2% Black alone 1,663,222 4.3% Two or more races 251,618 0.6% Other race alone 135,777 0.3% Native Hawaiian and Other 103,030 0.3% American Indian alone
Income and house value in Bellflower Median household income in 2022 $87,721 White non-Hispanic householders$84,119 Black householders$115,904 American Indian and Alaska Native householders$92,839 Asian householders$124,021 Native Hawaiian and other Pacific Islander householders$83,840 Some other race householders$66,736 Two or more races householders$84,439 Hispanic or Latino race householdersMedian 2022 house value $658,311 White Non-Hispanic householders$616,919 Black or African American householders$548,892 American Indian or Alaska Native householders $655,071 Asian householders$703,662 Native Hawaiian and other Pacific Islander householders$629,876 Some other race householders$639,234 Two or more races householders$626,637 Hispanic or Latino householders
Median age by race in Bellflower
45.2 Median age for White residents46.0 44.5 40.0 Median age for Black or African American residents33.6 41.2 46.5 Median age for American Indian / Alaska Native residents57.1 37.9 49.5 Median age for Asian residents46.5 50.9 31.7 Median age for Native Hawaiian / Pacific Islander residents17.8 44.8 34.5 Median age for Other race residents30.5 37.7 33.0 Median age for Two or more races residents30.9 33.1 61.7 Median age for White alone residents61.5 61.8 33.5 Median age for Hispanic or Latino residents31.1 35.7
Owner/renter occupied households by race in Bellflower
House owners and renters - White residents 3,154 47.1% Owner occupied3,545 52.9% Renter occupiedHouse owners and renters - Black or African American residents 1,249 26.3% Owner occupied3,494 73.7% Renter occupiedHouse owners and renters - American Indian / Alaska Native residents 69 44.8% Owner occupied85 55.2% Renter occupiedHouse owners and renters - Asian residents 1,411 54.1% Owner occupied1,199 45.9% Renter occupiedHouse owners and renters - Native Hawaiian / Pacific Islander residents 8 8.5% Owner occupied90 91.5% Renter occupiedHouse owners and renters - Other race residents 3,041 33.3% Owner occupied6,087 66.7% Renter occupiedHouse owners and renters - Two or more races residents 1,087 55.0% Owner occupied891 45.0% Renter occupiedHouse owners and renters - White alone residents 1,991 46.1% Owner occupied2,325 53.9% Renter occupiedHouse owners and renters - Hispanic or Latino residents 4,288 36.6% Owner occupied7,425 63.4% Renter occupied
Language usage in Bellflower
English speakers - Total 43.2% of residents of Bellflower speak English at home.
43.9% of residents speak Spanish at home 21,493 67.7% Speak English very well10,250 32.3% Speak English less than very well12.6% of residents speak other language at home 5,155 56.5% Speak English very well3,975 43.5% Speak English less than very well
English speakers - Born in the United States 88.3% of residents of Bellflower speak English at home.
9.6% of residents speak Spanish at home 469 79.8% Speak English very well119 20.2% Speak English less than very well1.9% of residents speak other language at home 71 60.7% Speak English very well46 39.3% Speak English less than very well
English speakers - Native, born elsewhere 51.8% of residents of Bellflower speak English at home.
35.2% of residents speak Spanish at home 297 88.7% Speak English very well38 11.3% Speak English less than very well13.3% of residents speak other language at home 105 82.7% Speak English very well22 17.3% Speak English less than very well
English speakers - Foreign-born 7.2% of residents of Bellflower speak English at home.
60.4% of residents speak Spanish at home 5,881 40.3% Speak English very well8,705 59.7% Speak English less than very well31.4% of residents speak other language at home 3,913 51.6% Speak English very well3,671 48.4% Speak English less than very well
White (Caucasian) - Speak only English Native:
68.1% (10,159)Foreign-born:
3.3% (117)
White (Caucasian) - Speak another language Native:
27.0% (4,034)Foreign-born:
92.1% (3,235)
Black or African American - Speak only English Native:
96.3% (8,116)Foreign-born:
44.0% (348)
Black or African American - Speak another language Native:
3.3% (276)Foreign-born:
53.8% (427)
American Indian / Alaska Native - Speak only English Native:
66.1% (234)Foreign-born:
5.3% (5)
American Indian / Alaska Native - Speak another language Native:
34.8% (123)Foreign-born:
94.7% (82)
Asian - Speak only English Native:
79.6% (1,869)Foreign-born:
10.0% (446)
Asian - Speak another language Native:
21.9% (515)Foreign-born:
89.8% (3,995)
Native Hawaiian / Pacific Islander - Speak another language Native:
13.4% (29)Foreign-born:
97.0% (159)
Other race - Speak only English Native:
30.9% (6,398)Foreign-born:
4.0% (524)
Other race - Speak another language Native:
69.0% (14,274)Foreign-born:
95.5% (12,381)
Two or more races - Speak only English Native:
59.4% (3,310)Foreign-born:
3.3% (84)
Two or more races - Speak another language Native:
49.1% (2,734)Foreign-born:
100.0% (2,538)
White alone - Speak only English Native:
95.5% (7,183)Foreign-born:
19.2% (128)
White alone - Speak another language Native:
4.5% (336)Foreign-born:
81.0% (538)
Hispanic or Latino - Speak only English Native:
33.2% (9,759)Foreign-born:
2.7% (429)
Hispanic or Latino - Speak another language Native:
66.1% (19,450)Foreign-born:
96.5% (15,287)
Foreign-born residents in Bellflower 24,714 residents are foreign born (20.5% Latin America , 8.8% Asia ).
This city:
32.1%California:
100.0%
Marital status for residents in Bellflower Marital status - White (Caucasian) population 15 years and over
Males 42.3% Never married43.1% Now married2.2% Separated2.1% Widowed10.2% DivorcedFemales 38.8% Never married39.6% Now married1.2% Separated9.6% Widowed10.8% DivorcedWomen who gave birth in the past 12 months Now married:
50.5% (180)Unmarried:
49.5% (176)
Women who did not give birth in the past 12 months Now married:
42.0% (1,860)Unmarried:
58.0% (2,570)
Marital status - Black or African American population 15 years and over
Males 47.8% Never married31.8% Now married2.0% Separated1.5% Widowed16.9% DivorcedFemales 44.7% Never married24.3% Now married5.1% Separated13.4% Widowed12.4% DivorcedWomen who gave birth in the past 12 months Now married:
57.1% (59)Unmarried:
42.9% (44)
Women who did not give birth in the past 12 months Now married:
18.3% (493)Unmarried:
81.7% (2,203)
Marital status - American Indian / Alaska Native population 15 years and over
Males 30.9% Never married54.5% Now married0.0% Separated8.2% Widowed6.4% DivorcedFemales 50.6% Never married4.2% Now married11.4% Separated0.0% Widowed33.7% DivorcedWomen who did not give birth in the past 12 months Now married:
0.0% (0)Unmarried:
100.0% (178)
Marital status - Asian population 15 years and over
Males 32.4% Never married61.0% Now married0.0% Separated1.8% Widowed4.8% DivorcedFemales 28.3% Never married49.3% Now married1.6% Separated14.9% Widowed5.9% DivorcedWomen who gave birth in the past 12 months Now married:
69.0% (29)Unmarried:
31.0% (13)
Women who did not give birth in the past 12 months Now married:
53.6% (1,142)Unmarried:
46.4% (990)
Marital status - Native Hawaiian / Pacific Islander population 15 years and over
Males 49.0% Never married51.0% Now married0.0% Separated0.0% Widowed0.0% DivorcedFemales 38.5% Never married44.0% Now married11.9% Separated0.0% Widowed5.5% DivorcedWomen who did not give birth in the past 12 months Now married:
76.3% (43)Unmarried:
23.7% (13)
Marital status - Other race population 15 years and over
Males 49.9% Never married36.8% Now married3.5% Separated1.3% Widowed8.5% DivorcedFemales 41.9% Never married35.9% Now married6.8% Separated12.1% Widowed3.4% DivorcedWomen who gave birth in the past 12 months Now married:
52.0% (142)Unmarried:
48.0% (131)
Women who did not give birth in the past 12 months Now married:
43.0% (3,595)Unmarried:
57.0% (4,771)
Marital status - Two or more races population 15 years and over
Males 67.2% Never married25.5% Now married2.6% Separated0.0% Widowed4.8% DivorcedFemales 65.6% Never married22.4% Now married1.8% Separated1.6% Widowed8.6% DivorcedWomen who gave birth in the past 12 months Now married:
75.0% (62)Unmarried:
25.0% (21)
Women who did not give birth in the past 12 months Now married:
12.2% (191)Unmarried:
87.8% (1,374)
Marital status - White alone, not Hispanic / Latino population 15 years and over
Males 29.6% Never married45.2% Now married0.1% Separated5.4% Widowed19.7% DivorcedFemales 30.8% Never married37.7% Now married1.3% Separated12.1% Widowed18.1% DivorcedWomen who gave birth in the past 12 months Now married:
100.0% (85)Unmarried:
0.0% (0)
Women who did not give birth in the past 12 months Now married:
34.6% (477)Unmarried:
65.4% (900)
Marital status - Hispanic or Latino population 15 years and over
Males 51.5% Never married37.5% Now married3.4% Separated0.8% Widowed6.7% DivorcedFemales 43.4% Never married37.1% Now married5.0% Separated10.4% Widowed4.2% DivorcedWomen who gave birth in the past 12 months Now married:
28.3% (142)Unmarried:
71.7% (358)
Women who did not give birth in the past 12 months Now married:
41.9% (4,914)Unmarried:
58.1% (6,824)
Ancestries in Bellflower
951 1.8% Egyptian857 1.6% American661 1.2% English639 1.2% German496 0.9% Dutch386 0.7% Nigerian340 0.6% European300 0.6% Irish272 0.5% Italian117 0.2% African115 0.2% Portuguese107 0.2% West Indian87 0.2% Jamaican85 0.2% Polish78 0.1% Lebanese55 0.1% Arab46 0.08% Norwegian43 0.08% Swedish37 0.07% Belizean36 0.07% Palestinian32 0.06% Brazilian32 0.06% Scottish28 0.05% Danish28 0.05% Scandinavian27 0.05% British27 0.05% Hungarian25 0.05% Greek24 0.04% Yugoslavian17 0.03% Armenian16 0.03% Scotch-Irish16 0.03% Slovak14 0.03% Croatian14 0.03% Finnish14 0.03% Swiss13 0.02% Austrian13 0.02% Iranian12 0.02% French12 0.02% Canadian11 0.02% Icelander9 0.02% Haitian8 0.01% Somali8 0.01% French Canadian8 0.01% Welsh8 0.01% Romanian8 0.01% Russian7 0.01% Guyanese7 0.01% Maltese7 0.01% Serbian6 0.01% Bulgarian
Geographical mobility in Bellflower Same house 1 year ago 18,610 93.6% White (Caucasian)8,908 90.9% Black or African American390 88.4% American Indian / Alaska Native9,623 97.7% Asian407 93.7% Native Hawaiian / Pacific Islander30,101 94.2% Other race7,508 91.5% Two or more races11,037 95.2% White alone, not Hispanic / Latino40,260 92.4% Hispanic or LatinoMoved within same county 1,000 5.0% White / Caucasian835 8.5% Black or African American49 11.1% American Indian / Alaska Native215 2.2% Asian25 5.8% Native Hawaiian / Pacific Islander1,733 5.4% Other race761 9.3% Two or more races405 3.5% White alone, not Hispanic / Latino2,805 6.4% Hispanic or LatinoMoved within same state 165 0.8% White / Caucasian8 0.1% Black or African American74 0.8% Asian154 0.5% Other race6 0.1% Two or more races105 0.9% White alone, not Hispanic / Latino337 0.8% Hispanic or LatinoMoved from different state 99 0.5% White / Caucasian9 0.1% Black or African American30 0.3% Asian30 0.1% Other race39 0.3% White alone, not Hispanic / Latino102 0.2% Hispanic or LatinoMoved from abroad 75 0.4% White14 0.1% Black or African American50 0.5% Asian38 0.1% Other race77 0.7% White alone, not Hispanic / Latino81 0.2% Hispanic or Latino
Children Nativity (place of birth) in Bellflower
Children under 6 years - Living with two parents Both parents native 833 100.0% NativeBoth parents foreign-born 649 100.0% NativeOne native, one foreign-born parent 221 100.0% NativeChildren under 6 years - Living with one parent Native parent 1,388 100.0% Native1 0.0% Foreign-bornForeign-born parent 338 88.2% Native45 11.8% Foreign-bornChildren 6 to 17 years - Living with two parents Both parents native 2,227 100.0% NativeBoth parents foreign-born 2,415 87.1% Native359 12.9% Foreign-bornOne native, one foreign-born parent 1,241 100.0% NativeChildren 6 to 17 years - Living with one parent Native parent 3,598 100.0% NativeForeign-born parent 2,250 51.0% Native2,165 49.0% Foreign-born
Grandparents responsible for own grandchildren in Bellflower
Grandparents (30 to 59 years) White / Caucasian 23 14.8% Responsible for grandchildren130 85.2% Not responsible for grandchildrenBlack or African American 27 21.5% Responsible for grandchildren98 78.5% Not responsible for grandchildrenAmerican Indian / Alaska Native 14 100.0% Not responsible for grandchildrenAsian 74 100.0% Not responsible for grandchildrenNative Hawaiian / Pacific Islander 41 100.0% Not responsible for grandchildrenOther race 36 11.1% Responsible for grandchildren285 88.9% Not responsible for grandchildrenTwo or more races 67 100.0% Not responsible for grandchildrenWhite alone, not Hispanic / Latino 23 31.6% Responsible for grandchildren50 68.4% Not responsible for grandchildrenHispanic or Latino 31 7.2% Responsible for grandchildren405 92.8% Not responsible for grandchildrenGrandparents (60 years and over) White / Caucasian 96 28.0% Responsible for grandchildren246 72.0% Not responsible for grandchildrenBlack or African American 105 47.3% Responsible for grandchildren117 52.7% Not responsible for grandchildrenAsian 101 26.0% Responsible for grandchildren288 74.0% Not responsible for grandchildrenNative Hawaiian / Pacific Islander 6 100.0% Not responsible for grandchildrenOther race 39 7.4% Responsible for grandchildren485 92.6% Not responsible for grandchildrenTwo or more races 83 100.0% Not responsible for grandchildrenWhite alone, not Hispanic / Latino 45 18.8% Responsible for grandchildren196 81.2% Not responsible for grandchildrenHispanic or Latino 143 20.2% Responsible for grandchildren563 79.8% Not responsible for grandchildren