Races in Blackfeet, Montana (MT) Detailed Stats
Ancestries, Foreign-born residents, place of birth
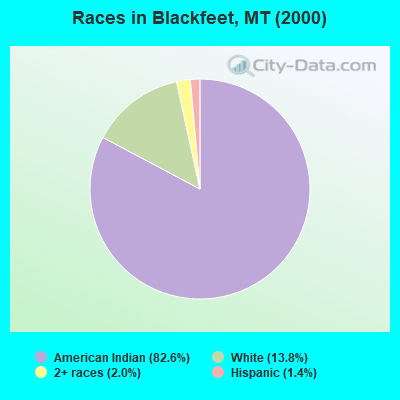
Race distribution in Blackfeet

- 7,61082.6%American Indian alone
- 1,27013.8%White alone
- 1862.0%Two or more races
- 1291.4%Hispanic
- 70.08%Black alone
- 30.03%Other race alone
- 30.03%Native Hawaiian and Other
Pacific Islander alone - 10.01%Asian alone
2000
2022
-
- 807,82389.5%White alone
- 54,4266.0%American Indian alone
- 18,0812.0%Hispanic
- 13,7681.5%Two or more races
- 4,5690.5%Asian alone
- 2,5340.3%Black alone
- 5690.06%Other race alone
- 4250.05%Native Hawaiian and Other
Pacific Islander alone

-
- 937,36583.5%White alone
- 58,7485.2%American Indian alone
- 55,1724.9%Two or more races
- 49,8304.4%Hispanic
- 9,0120.8%Other race alone
- 7,7000.7%Asian alone
- 3,4280.3%Black alone
- 1,6120.1%Native Hawaiian and Other
Pacific Islander alone

Income and house value in Blackfeet
- Median household income in 2022
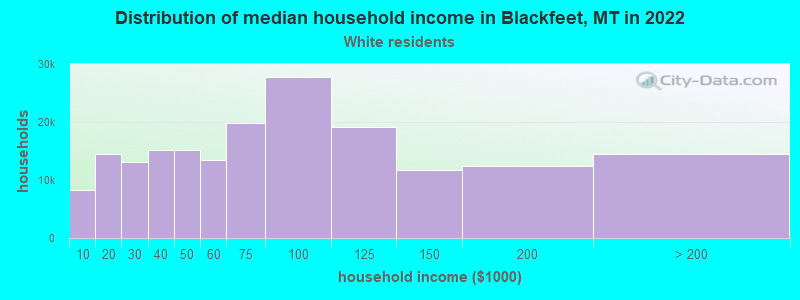
- $62,690White non-Hispanic householders
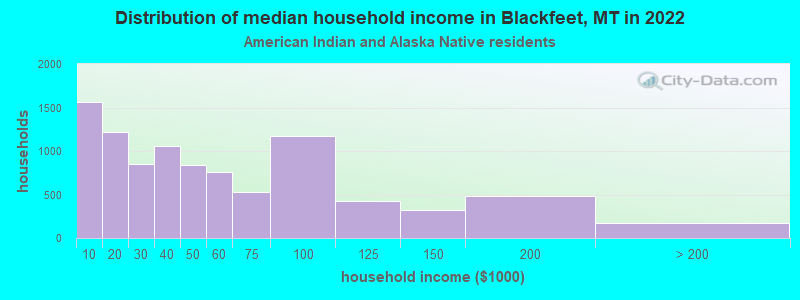
- $42,755American Indian and Alaska Native householders
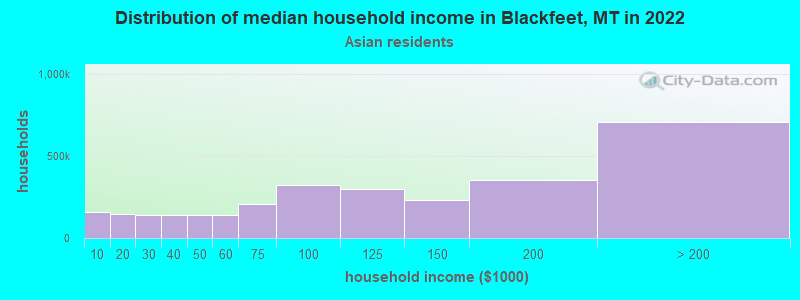
- $44,300Asian householders
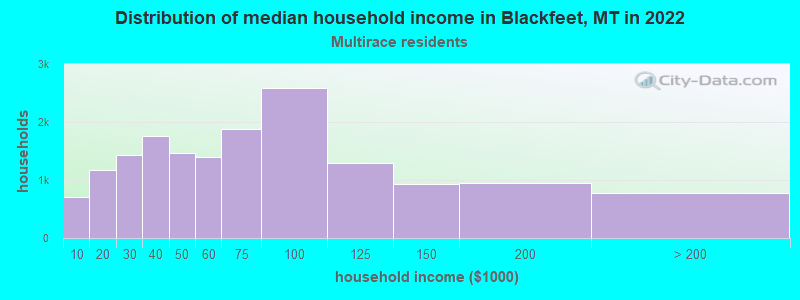
- $73,682Two or more races householders
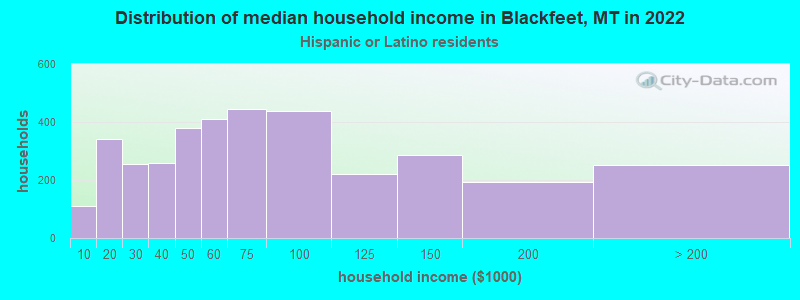
- $27,240Hispanic or Latino race householders
- Median 2022 house value
- $236,301White Non-Hispanic householders
- $157,905American Indian or Alaska Native householders
- $210,169Two or more races householders
Household income for White non-Hispanic householders
Household income for American Indian and Alaska Native householders
Household income for Asian householders
Household income for Two or more races householders
Household income for Hispanic or Latino race householders
Zip code: 59417