Races in Blackwells Mills, New Jersey (NJ) Detailed Stats
Data:
Races - White alone (%)
Races - White alone (% change since 2000)
Races - Black alone (%)
Races - Black alone (% change since 2000)
Races - American Indian alone (%)
Races - American Indian alone (% change since 2000)
Races - Asian alone (%)
Races - Asian alone (% change since 2000)
Races - Hispanic (%)
Races - Hispanic (% change since 2000)
Races - Native Hawaiian and Other Pacific Islander alone (%)
Races - Native Hawaiian and Other Pacific Islander alone (% change since 2000)
Races - Two or more races(%)
Races - Two or more races(% change since 2000)
Races - Other race alone (%)
Races - Other race alone (% change since 2000)
Racial diversity
Place of birth - Born in state of residence (%)
Place of birth - Born in state of residence (%) - White
Place of birth - Born in state of residence (%) - Black or African American
Place of birth - Born in state of residence (%) - Asian
Place of birth - Born in state of residence (%) - Hispanic or Latino
Place of birth - Born in state of residence (%) - American Indian and Alaska Native
Place of birth - Born in state of residence (%) - Multirace
Place of birth - Born in state of residence (%) - Other Race
Place of birth - Born in other state (%)
Place of birth - Born in other state (%) - White
Place of birth - Born in other state (%) - Black or African American
Place of birth - Born in other state (%) - Asian
Place of birth - Born in other state (%) - Hispanic or Latino
Place of birth - Born in other state (%) - American Indian and Alaska Native
Place of birth - Born in other state (%) - Multirace
Place of birth - Born in other state (%) - Other Race
Place of birth - Native, outside of US (%)
Place of birth - Native, outside of US (%) - White
Place of birth - Native, outside of US (%) - Black or African American
Place of birth - Native, outside of US (%) - Asian
Place of birth - Native, outside of US (%) - Hispanic or Latino
Place of birth - Native, outside of US (%) - American Indian and Alaska Native
Place of birth - Native, outside of US (%) - Multirace
Place of birth - Native, outside of US (%) - Other Race
Place of birth - Foreign born (%)
Place of birth - Foreign born (%) - White
Place of birth - Foreign born (%) - Black or African American
Place of birth - Foreign born (%) - Asian
Place of birth - Foreign born (%) - Hispanic or Latino
Place of birth - Foreign born (%) - American Indian and Alaska Native
Place of birth - Foreign born (%) - Multirace
Place of birth - Foreign born (%) - Other Race
Residents speaking English at home (%)
Residents speaking English at home - Born in the United States (%)
Residents speaking English at home - Native, born elsewhere (%)
Residents speaking English at home - Foreign born (%)
Residents speaking Spanish at home (%)
Residents speaking Spanish at home - Born in the United States (%)
Residents speaking Spanish at home - Native, born elsewhere (%)
Residents speaking Spanish at home - Foreign born (%)
Residents speaking other language at home (%)
Residents speaking other language at home - Born in the United States (%)
Residents speaking other language at home - Native, born elsewhere (%)
Residents speaking other language at home - Foreign born (%)
Marital status - Never married (%)
Marital status - Now married (%)
Marital status - Separated (%)
Marital status - Widowed (%)
Marital status - Divorced (%)
Ancestries Reported - Arab (%)
Ancestries Reported - Czech (%)
Ancestries Reported - Danish (%)
Ancestries Reported - Dutch (%)
Ancestries Reported - English (%)
Ancestries Reported - French (%)
Ancestries Reported - French Canadian (%)
Ancestries Reported - German (%)
Ancestries Reported - Greek (%)
Ancestries Reported - Hungarian (%)
Ancestries Reported - Irish (%)
Ancestries Reported - Italian (%)
Ancestries Reported - Lithuanian (%)
Ancestries Reported - Norwegian (%)
Ancestries Reported - Polish (%)
Ancestries Reported - Portuguese (%)
Ancestries Reported - Russian (%)
Ancestries Reported - Scotch-Irish (%)
Ancestries Reported - Scottish (%)
Ancestries Reported - Slovak (%)
Ancestries Reported - Subsaharan African (%)
Ancestries Reported - Swedish (%)
Ancestries Reported - Swiss (%)
Ancestries Reported - Ukrainian (%)
Ancestries Reported - United States (%)
Ancestries Reported - Welsh (%)
Ancestries Reported - West Indian (%)
Ancestries Reported - Other (%)
Geographical mobility - Same house 1 year ago (%)
Geographical mobility - Same house 1 year ago (%) - White
Geographical mobility - Same house 1 year ago (%) - Black or African American
Geographical mobility - Same house 1 year ago (%) - Asian
Geographical mobility - Same house 1 year ago (%) - Hispanic or Latino
Geographical mobility - Same house 1 year ago (%) - American Indian and Alaska Native
Geographical mobility - Same house 1 year ago (%) - Multirace
Geographical mobility - Same house 1 year ago (%) - Other Race
Geographical mobility - Moved within same county (%)
Geographical mobility - Moved within same county (%) - White
Geographical mobility - Moved within same county (%) - Black or African American
Geographical mobility - Moved within same county (%) - Asian
Geographical mobility - Moved within same county (%) - Hispanic or Latino
Geographical mobility - Moved within same county (%) - American Indian and Alaska Native
Geographical mobility - Moved within same county (%) - Multirace
Geographical mobility - Moved within same county (%) - Other Race
Geographical mobility - Moved from different county within same state (%)
Geographical mobility - Moved from different county within same state (%) - White
Geographical mobility - Moved from different county within same state (%) - Black or African American
Geographical mobility - Moved from different county within same state (%) - Asian
Geographical mobility - Moved from different county within same state (%) - Hispanic or Latino
Geographical mobility - Moved from different county within same state (%) - American Indian and Alaska Native
Geographical mobility - Moved from different county within same state (%) - Multirace
Geographical mobility - Moved from different county within same state (%) - Other Race
Geographical mobility - Moved from different state (%)
Geographical mobility - Moved from different state (%) - White
Geographical mobility - Moved from different state (%) - Black or African American
Geographical mobility - Moved from different state (%) - Asian
Geographical mobility - Moved from different state (%) - Hispanic or Latino
Geographical mobility - Moved from different state (%) - American Indian and Alaska Native
Geographical mobility - Moved from different state (%) - Multirace
Geographical mobility - Moved from different state (%) - Other Race
Geographical mobility - Moved from abroad (%)
Geographical mobility - Moved from abroad (%) - White
Geographical mobility - Moved from abroad (%) - Black or African American
Geographical mobility - Moved from abroad (%) - Asian
Geographical mobility - Moved from abroad (%) - Hispanic or Latino
Geographical mobility - Moved from abroad (%) - American Indian and Alaska Native
Geographical mobility - Moved from abroad (%) - Multirace
Geographical mobility - Moved from abroad (%) - Other Race
Place of birth for the foreign-born population - Ireland (%)
Place of birth for the foreign-born population - Denmark (%)
Place of birth for the foreign-born population - Norway (%)
Place of birth for the foreign-born population - Sweden (%)
Place of birth for the foreign-born population - United Kingdom (%)
Place of birth for the foreign-born population - England (%)
Place of birth for the foreign-born population - Scotland (%)
Place of birth for the foreign-born population - Other Northern Europe (%)
Place of birth for the foreign-born population - Austria (%)
Place of birth for the foreign-born population - Belgium (%)
Place of birth for the foreign-born population - France (%)
Place of birth for the foreign-born population - Germany (%)
Place of birth for the foreign-born population - Netherlands (%)
Place of birth for the foreign-born population - Switzerland (%)
Place of birth for the foreign-born population - Other Western Europe (%)
Place of birth for the foreign-born population - Greece (%)
Place of birth for the foreign-born population - Italy (%)
Place of birth for the foreign-born population - Portugal (%)
Place of birth for the foreign-born population - Spain (%)
Place of birth for the foreign-born population - Other Southern Europe (%)
Place of birth for the foreign-born population - Albania (%)
Place of birth for the foreign-born population - Belarus (%)
Place of birth for the foreign-born population - Bosnia and Herzegovina (%)
Place of birth for the foreign-born population - Bulgaria (%)
Place of birth for the foreign-born population - Croatia (%)
Place of birth for the foreign-born population - Czechoslovakia (%)
Place of birth for the foreign-born population - Hungary (%)
Place of birth for the foreign-born population - Latvia (%)
Place of birth for the foreign-born population - Lithuania (%)
Place of birth for the foreign-born population - North Macedonia (Macedonia) (%)
Place of birth for the foreign-born population - Moldova (%)
Place of birth for the foreign-born population - Poland (%)
Place of birth for the foreign-born population - Romania (%)
Place of birth for the foreign-born population - Russia (%)
Place of birth for the foreign-born population - Serbia (%)
Place of birth for the foreign-born population - Ukraine (%)
Place of birth for the foreign-born population - Other Eastern Europe (%)
Place of birth for the foreign-born population - China (%)
Place of birth for the foreign-born population - Hong Kong (%)
Place of birth for the foreign-born population - Taiwan (%)
Place of birth for the foreign-born population - Japan (%)
Place of birth for the foreign-born population - Korea (%)
Place of birth for the foreign-born population - Other Eastern Asia (%)
Place of birth for the foreign-born population - Afghanistan (%)
Place of birth for the foreign-born population - Bangladesh (%)
Place of birth for the foreign-born population - India (%)
Place of birth for the foreign-born population - Iran (%)
Place of birth for the foreign-born population - Kazakhstan (%)
Place of birth for the foreign-born population - Nepal (%)
Place of birth for the foreign-born population - Pakistan (%)
Place of birth for the foreign-born population - Sri Lanka (%)
Place of birth for the foreign-born population - Uzbekistan (%)
Place of birth for the foreign-born population - Other South Central Asia (%)
Place of birth for the foreign-born population - Burma (%)
Place of birth for the foreign-born population - Cambodia (%)
Place of birth for the foreign-born population - Indonesia (%)
Place of birth for the foreign-born population - Laos (%)
Place of birth for the foreign-born population - Malaysia (%)
Place of birth for the foreign-born population - Philippines (%)
Place of birth for the foreign-born population - Singapore (%)
Place of birth for the foreign-born population - Thailand (%)
Place of birth for the foreign-born population - Vietnam (%)
Place of birth for the foreign-born population - Other South Eastern Asia (%)
Place of birth for the foreign-born population - Armenia (%)
Place of birth for the foreign-born population - Iraq (%)
Place of birth for the foreign-born population - Israel (%)
Place of birth for the foreign-born population - Jordan (%)
Place of birth for the foreign-born population - Kuwait (%)
Place of birth for the foreign-born population - Lebanon (%)
Place of birth for the foreign-born population - Saudi Arabia (%)
Place of birth for the foreign-born population - Syria (%)
Place of birth for the foreign-born population - Turkey (%)
Place of birth for the foreign-born population - Yemen (%)
Place of birth for the foreign-born population - Other Western Asia (%)
Place of birth for the foreign-born population - Eritrea (%)
Place of birth for the foreign-born population - Ethiopia (%)
Place of birth for the foreign-born population - Kenya (%)
Place of birth for the foreign-born population - Somalia (%)
Place of birth for the foreign-born population - Uganda (%)
Place of birth for the foreign-born population - Zimbabwe (%)
Place of birth for the foreign-born population - Other Eastern Africa (%)
Place of birth for the foreign-born population - Cameroon (%)
Place of birth for the foreign-born population - Congo (%)
Place of birth for the foreign-born population - Democratic Republic of Congo (Zaire) (%)
Place of birth for the foreign-born population - Other Middle Africa (%)
Place of birth for the foreign-born population - Egypt (%)
Place of birth for the foreign-born population - Morocco (%)
Place of birth for the foreign-born population - Sudan (%)
Place of birth for the foreign-born population - Other Northern Africa (%)
Place of birth for the foreign-born population - South Africa (%)
Place of birth for the foreign-born population - Other Southern Africa (%)
Place of birth for the foreign-born population - Cabo Verde (%)
Place of birth for the foreign-born population - Ghana (%)
Place of birth for the foreign-born population - Liberia (%)
Place of birth for the foreign-born population - Nigeria (%)
Place of birth for the foreign-born population - Senegal (%)
Place of birth for the foreign-born population - Sierra Leone (%)
Place of birth for the foreign-born population - Other Western Africa (%)
Place of birth for the foreign-born population - Australia (%)
Place of birth for the foreign-born population - New Zealand (%)
Place of birth for the foreign-born population - Fiji (%)
Place of birth for the foreign-born population - Micronesia (%)
Place of birth for the foreign-born population - Bahamas (%)
Place of birth for the foreign-born population - Barbados (%)
Place of birth for the foreign-born population - Cuba (%)
Place of birth for the foreign-born population - Dominica (%)
Place of birth for the foreign-born population - Dominican Republic (%)
Place of birth for the foreign-born population - Grenada (%)
Place of birth for the foreign-born population - Haiti (%)
Place of birth for the foreign-born population - Jamaica (%)
Place of birth for the foreign-born population - St. Vincent and the Grenadines (%)
Place of birth for the foreign-born population - Trinidad and Tobago (%)
Place of birth for the foreign-born population - West Indies (%)
Place of birth for the foreign-born population - Other Caribbean (%)
Place of birth for the foreign-born population - Belize (%)
Place of birth for the foreign-born population - Costa Rica (%)
Place of birth for the foreign-born population - El Salvador (%)
Place of birth for the foreign-born population - Guatemala (%)
Place of birth for the foreign-born population - Honduras (%)
Place of birth for the foreign-born population - Mexico (%)
Place of birth for the foreign-born population - Nicaragua (%)
Place of birth for the foreign-born population - Panama (%)
Place of birth for the foreign-born population - Other Central America (%)
Place of birth for the foreign-born population - Argentina (%)
Place of birth for the foreign-born population - Bolivia (%)
Place of birth for the foreign-born population - Brazil (%)
Place of birth for the foreign-born population - Chile (%)
Place of birth for the foreign-born population - Colombia (%)
Place of birth for the foreign-born population - Ecuador (%)
Place of birth for the foreign-born population - Guyana (%)
Place of birth for the foreign-born population - Peru (%)
Place of birth for the foreign-born population - Uruguay (%)
Place of birth for the foreign-born population - Venezuela (%)
Place of birth for the foreign-born population - Other South America (%)
Place of birth for the foreign-born population - Canada (%)
Place of birth for the foreign-born population - Other Northern America (%)
Place of birth for the foreign-born population - Other (%)
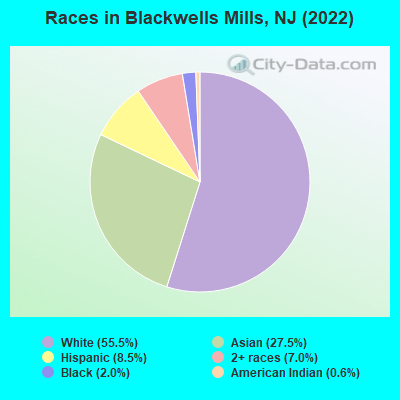
According to 2022 data, the most numerous races in Blackwells Mills, NJ are White alone (5,607 residents), Hispanic (854 residents), and Black alone (201 residents). 67.5% of Blackwells Mills residents speak English at home.
Race distribution in Blackwells Mills 5,607 55.5% White alone 2,781 27.5% Asian alone 854 8.5% Hispanic 704 7.0% Two or more races 201 2.0% Black alone 62 0.6% American Indian alone 7 0.07% Other race alone
2000 2022
5,557,209 66.0% White alone 1,117,191 13.3% Hispanic 1,096,171 13.0% Black alone 477,012 5.7% Asian alone 133,689 1.6% Two or more races 19,565 0.2% Other race alone 11,338 0.1% American Indian alone 2,175 0.03% Native Hawaiian and Other
4,766,476 51.5% White alone 2,028,470 21.9% Hispanic 1,111,632 12.0% Black alone 923,546 10.0% Asian alone 332,237 3.6% Two or more races 89,847 1.0% Other race alone 8,557 0.09% American Indian alone 934 0.01% Native Hawaiian and Other
Income and house value in Blackwells Mills Median household income in 2022 $198,899 White non-Hispanic householders$159,594 Black householdersover $200,000 Asian householdersover $200,000 Two or more races householdersover $200,000 Hispanic or Latino race householders
Median age by race in Blackwells Mills
43.5 Median age for White residents44.4 43.2 54.9 Median age for Black or African American residents55.2 52.1 20.3 Median age for American Indian / Alaska Native residents-643,500,642.9 -1,220,338,981.8 43.3 Median age for Asian residents44.5 41.6 -804,177,544.9 Median age for Native Hawaiian / Pacific Islander residents-666,666,666.0 -713,070,378.3 35.9 Median age for Other race residents37.7 -691,745,035.9 25.2 Median age for Two or more races residents12.0 31.6 45.0 Median age for White alone residents45.5 43.6 19.5 Median age for Hispanic or Latino residents19.0 29.2
Owner/renter occupied households by race in Blackwells Mills
House owners and renters - White residents 1,807 99.5% Owner occupied10 0.5% Renter occupiedHouse owners and renters - Black or African American residents 110 100.0% Owner occupiedHouse owners and renters - Asian residents 808 100.0% Owner occupiedHouse owners and renters - Other race residents 59 100.0% Owner occupiedHouse owners and renters - Two or more races residents 123 55.3% Owner occupied99 44.7% Renter occupiedHouse owners and renters - White alone residents 1,741 99.4% Owner occupied11 0.6% Renter occupiedHouse owners and renters - Hispanic or Latino residents 173 80.8% Owner occupied41 19.2% Renter occupied
Language usage in Blackwells Mills
English speakers - Total 67.5% of residents of Blackwells Mills speak English at home.
4.5% of residents speak Spanish at home 417 97.4% Speak English very well11 2.6% Speak English less than very well28.4% of residents speak other language at home 2,249 83.0% Speak English very well460 17.0% Speak English less than very well
English speakers - Born in the United States 89.6% of residents of Blackwells Mills speak English at home.
1.4% of residents speak Spanish at home 35 100.0% Speak English very well8.8% of residents speak other language at home 213 98.6% Speak English very well3 1.4% Speak English less than very well
English speakers - Native, born elsewhere 47.8% of residents of Blackwells Mills speak English at home.
36.2% of residents speak other language at home 44 88.0% Speak English very well6 12.0% Speak English less than very well
English speakers - Foreign-born 15.7% of residents of Blackwells Mills speak English at home.
1.9% of residents speak Spanish at home 41 100.0% Speak English very well84.7% of residents speak other language at home 1,464 79.2% Speak English very well385 20.8% Speak English less than very well
White (Caucasian) - Speak only English Native:
87.6% (4,550)Foreign-born:
9.3% (30)
White (Caucasian) - Speak another language Native:
12.3% (639)Foreign-born:
92.1% (301)
Black or African American - Speak only English Native:
100.0% (171)Foreign-born:
100.0% (29)
Asian - Speak only English Native:
51.4% (551)Foreign-born:
13.2% (211)
Asian - Speak another language Native:
47.4% (508)Foreign-born:
86.8% (1,390)
Other race - Speak another language Native:
73.0% (36)Foreign-born:
98.0% (42)
Two or more races - Speak only English Native:
100.0% (857)Foreign-born:
33.3% (59)
White alone - Speak only English Native:
92.8% (4,530)Foreign-born:
6.2% (24)
White alone - Speak another language Native:
7.3% (356)Foreign-born:
100.0% (382)
Hispanic or Latino - Speak only English Native:
35.0% (267)Foreign-born:
53.9% (43)
Hispanic or Latino - Speak another language Native:
65.3% (498)Foreign-born:
57.1% (46)
Foreign-born residents in Blackwells Mills
Marital status for residents in Blackwells Mills Marital status - White (Caucasian) population 15 years and over
Males 25.4% Never married70.3% Now married0.0% Separated0.7% Widowed3.6% DivorcedFemales 23.3% Never married68.8% Now married1.0% Separated4.5% Widowed2.5% DivorcedWomen who gave birth in the past 12 months Now married:
100.0% (43)Unmarried:
0.0% (0)
Women who did not give birth in the past 12 months Now married:
50.1% (556)Unmarried:
49.9% (554)
Marital status - Black or African American population 15 years and over
Males 73.4% Never married17.9% Now married0.0% Separated7.5% Widowed1.2% DivorcedFemales 39.5% Never married60.5% Now married0.0% Separated0.0% Widowed0.0% DivorcedMarital status - American Indian / Alaska Native population 15 years and over
Males 0.0% Never married100.0% Now married0.0% Separated0.0% Widowed0.0% DivorcedFemales 100.0% Never married0.0% Now married0.0% Separated0.0% Widowed0.0% DivorcedWomen who did not give birth in the past 12 months Now married:
0.0% (0)Unmarried:
100.0% (26)
Marital status - Asian population 15 years and over
Males 17.7% Never married78.7% Now married1.5% Separated2.1% Widowed0.0% DivorcedFemales 18.5% Never married67.1% Now married3.1% Separated10.1% Widowed1.3% DivorcedWomen who gave birth in the past 12 months Now married:
100.0% (17)Unmarried:
0.0% (0)
Women who did not give birth in the past 12 months Now married:
71.2% (477)Unmarried:
28.8% (193)
Marital status - Two or more races population 15 years and over
Males 24.9% Never married75.1% Now married0.0% Separated0.0% Widowed0.0% DivorcedFemales 50.8% Never married49.2% Now married0.0% Separated0.0% Widowed0.0% DivorcedWomen who gave birth in the past 12 months Now married:
100.0% (9)Unmarried:
0.0% (0)
Women who did not give birth in the past 12 months Now married:
22.9% (67)Unmarried:
77.1% (227)
Marital status - White alone, not Hispanic / Latino population 15 years and over
Males 19.8% Never married75.5% Now married0.0% Separated0.8% Widowed3.9% DivorcedFemales 23.2% Never married68.5% Now married1.0% Separated4.6% Widowed2.6% DivorcedWomen who gave birth in the past 12 months Now married:
100.0% (45)Unmarried:
0.0% (0)
Women who did not give birth in the past 12 months Now married:
50.0% (558)Unmarried:
50.0% (557)
Marital status - Hispanic or Latino population 15 years and over
Males 62.4% Never married37.6% Now married0.0% Separated0.0% Widowed0.0% DivorcedFemales 17.6% Never married82.4% Now married0.0% Separated0.0% Widowed0.0% DivorcedWomen who did not give birth in the past 12 months Now married:
51.0% (27)Unmarried:
49.0% (26)
Ancestries in Blackwells Mills
440 8.9% Italian192 3.9% English151 3.0% Irish139 2.8% Egyptian133 2.7% Lithuanian111 2.2% Polish95 1.9% Eastern European92 1.9% American81 1.6% German77 1.6% Hungarian54 1.1% European54 1.1% Greek44 0.9% Assyrian41 0.8% Portuguese25 0.5% Russian25 0.5% Jamaican24 0.5% Swiss22 0.4% Czechoslovakian21 0.4% Dutch14 0.3% Canadian13 0.3% Carpatho Rusyn13 0.3% Croatian13 0.3% Czech13 0.3% Slovak12 0.2% Iranian11 0.2% Norwegian8 0.2% Albanian6 0.1% Lebanese4 0.08% British4 0.08% French
Children Nativity (place of birth) in Blackwells Mills
Children under 6 years - Living with two parents Both parents native 491 100.0% NativeBoth parents foreign-born 83 100.0% NativeOne native, one foreign-born parent 36 100.0% NativeChildren under 6 years - Living with one parent Native parent 15 100.0% NativeChildren 6 to 17 years - Living with two parents Both parents native 902 100.0% NativeBoth parents foreign-born 799 94.9% Native43 5.1% Foreign-bornOne native, one foreign-born parent 124 100.0% NativeChildren 6 to 17 years - Living with one parent Native parent 83 100.0% NativeForeign-born parent 9 45.9% Native11 54.1% Foreign-born
Grandparents responsible for own grandchildren in Blackwells Mills
Grandparents (30 to 59 years) Asian 10 100.0% Not responsible for grandchildrenGrandparents (60 years and over) Asian 18 12.8% Responsible for grandchildren122 87.2% Not responsible for grandchildren