Races in Bowie, Arizona (AZ) Detailed Stats
Ancestries, Foreign-born residents, place of birth
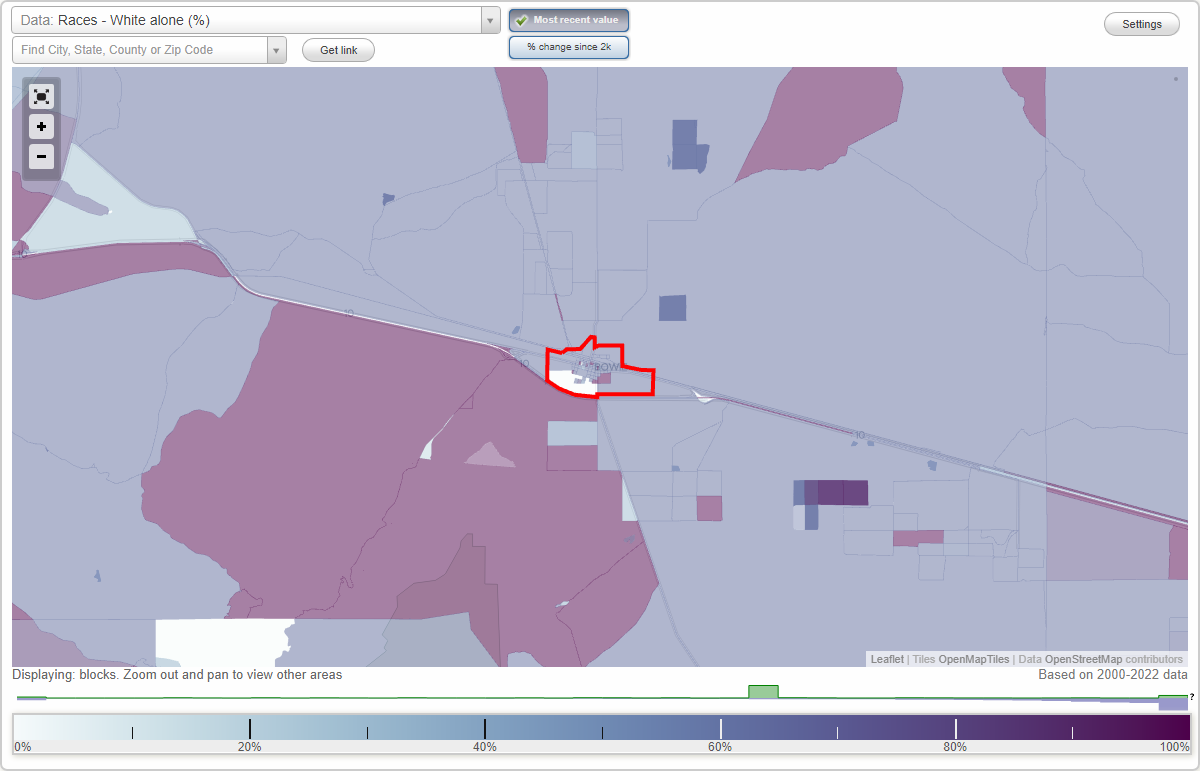
Data:
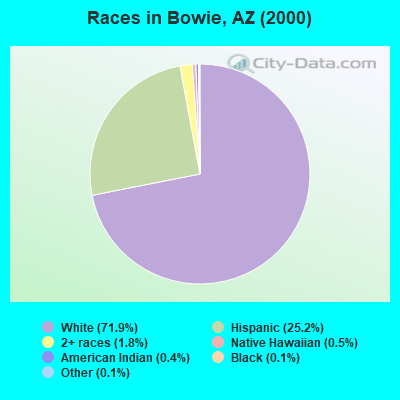
Race distribution in Bowie

- 1,63471.9%White alone
- 57225.2%Hispanic
- 401.8%Two or more races
- 110.5%Native Hawaiian and Other
Pacific Islander alone
- 90.4%American Indian alone
- 30.1%Black alone
- 30.1%Other race alone
- 20.09%Asian alone
2000
2022
-
- 3,274,25863.8%White alone
- 1,295,61725.3%Hispanic
- 233,3704.5%American Indian alone
- 149,9412.9%Black alone
- 89,3151.7%Asian alone
- 76,3721.5%Two or more races
- 6,1200.1%Other race alone
- 5,6390.1%Native Hawaiian and Other
Pacific Islander alone
-
- 3,814,58751.8%White alone
- 2,388,52032.5%Hispanic
- 322,4594.4%Black alone
- 284,9943.9%Two or more races
- 257,0203.5%Asian alone
- 241,6883.3%American Indian alone
- 36,0420.5%Other race alone
- 13,8870.2%Native Hawaiian and Other
Pacific Islander alone
Income and house value in Bowie
- Median household income in 2022
- $42,874White non-Hispanic householders
- $47,688Black householders
- $29,663American Indian and Alaska Native householders
- $15,788Asian householders
- $35,862Some other race householders
- $39,369Two or more races householders
- $37,500Hispanic or Latino race householders
- Median 2022 house value
- $220,914White Non-Hispanic householders
- $138,071Black or African American householders
- $101,252American Indian or Alaska Native householders
- $115,243Some other race householders
- $239,323Two or more races householders
- $119,661Hispanic or Latino householders