Races in Braintree Town, Massachusetts (MA) Detailed Stats
Data:
Races - White alone (%)
Races - White alone (% change since 2000)
Races - Black alone (%)
Races - Black alone (% change since 2000)
Races - American Indian alone (%)
Races - American Indian alone (% change since 2000)
Races - Asian alone (%)
Races - Asian alone (% change since 2000)
Races - Hispanic (%)
Races - Hispanic (% change since 2000)
Races - Native Hawaiian and Other Pacific Islander alone (%)
Races - Native Hawaiian and Other Pacific Islander alone (% change since 2000)
Races - Two or more races(%)
Races - Two or more races(% change since 2000)
Races - Other race alone (%)
Races - Other race alone (% change since 2000)
Racial diversity
Place of birth - Born in state of residence (%)
Place of birth - Born in state of residence (%) - White
Place of birth - Born in state of residence (%) - Black or African American
Place of birth - Born in state of residence (%) - Asian
Place of birth - Born in state of residence (%) - Hispanic or Latino
Place of birth - Born in state of residence (%) - American Indian and Alaska Native
Place of birth - Born in state of residence (%) - Multirace
Place of birth - Born in state of residence (%) - Other Race
Place of birth - Born in other state (%)
Place of birth - Born in other state (%) - White
Place of birth - Born in other state (%) - Black or African American
Place of birth - Born in other state (%) - Asian
Place of birth - Born in other state (%) - Hispanic or Latino
Place of birth - Born in other state (%) - American Indian and Alaska Native
Place of birth - Born in other state (%) - Multirace
Place of birth - Born in other state (%) - Other Race
Place of birth - Native, outside of US (%)
Place of birth - Native, outside of US (%) - White
Place of birth - Native, outside of US (%) - Black or African American
Place of birth - Native, outside of US (%) - Asian
Place of birth - Native, outside of US (%) - Hispanic or Latino
Place of birth - Native, outside of US (%) - American Indian and Alaska Native
Place of birth - Native, outside of US (%) - Multirace
Place of birth - Native, outside of US (%) - Other Race
Place of birth - Foreign born (%)
Place of birth - Foreign born (%) - White
Place of birth - Foreign born (%) - Black or African American
Place of birth - Foreign born (%) - Asian
Place of birth - Foreign born (%) - Hispanic or Latino
Place of birth - Foreign born (%) - American Indian and Alaska Native
Place of birth - Foreign born (%) - Multirace
Place of birth - Foreign born (%) - Other Race
Residents speaking English at home (%)
Residents speaking English at home - Born in the United States (%)
Residents speaking English at home - Native, born elsewhere (%)
Residents speaking English at home - Foreign born (%)
Residents speaking Spanish at home (%)
Residents speaking Spanish at home - Born in the United States (%)
Residents speaking Spanish at home - Native, born elsewhere (%)
Residents speaking Spanish at home - Foreign born (%)
Residents speaking other language at home (%)
Residents speaking other language at home - Born in the United States (%)
Residents speaking other language at home - Native, born elsewhere (%)
Residents speaking other language at home - Foreign born (%)
Marital status - Never married (%)
Marital status - Now married (%)
Marital status - Separated (%)
Marital status - Widowed (%)
Marital status - Divorced (%)
Ancestries Reported - Arab (%)
Ancestries Reported - Czech (%)
Ancestries Reported - Danish (%)
Ancestries Reported - Dutch (%)
Ancestries Reported - English (%)
Ancestries Reported - French (%)
Ancestries Reported - French Canadian (%)
Ancestries Reported - German (%)
Ancestries Reported - Greek (%)
Ancestries Reported - Hungarian (%)
Ancestries Reported - Irish (%)
Ancestries Reported - Italian (%)
Ancestries Reported - Lithuanian (%)
Ancestries Reported - Norwegian (%)
Ancestries Reported - Polish (%)
Ancestries Reported - Portuguese (%)
Ancestries Reported - Russian (%)
Ancestries Reported - Scotch-Irish (%)
Ancestries Reported - Scottish (%)
Ancestries Reported - Slovak (%)
Ancestries Reported - Subsaharan African (%)
Ancestries Reported - Swedish (%)
Ancestries Reported - Swiss (%)
Ancestries Reported - Ukrainian (%)
Ancestries Reported - United States (%)
Ancestries Reported - Welsh (%)
Ancestries Reported - West Indian (%)
Ancestries Reported - Other (%)
Geographical mobility - Same house 1 year ago (%)
Geographical mobility - Same house 1 year ago (%) - White
Geographical mobility - Same house 1 year ago (%) - Black or African American
Geographical mobility - Same house 1 year ago (%) - Asian
Geographical mobility - Same house 1 year ago (%) - Hispanic or Latino
Geographical mobility - Same house 1 year ago (%) - American Indian and Alaska Native
Geographical mobility - Same house 1 year ago (%) - Multirace
Geographical mobility - Same house 1 year ago (%) - Other Race
Geographical mobility - Moved within same county (%)
Geographical mobility - Moved within same county (%) - White
Geographical mobility - Moved within same county (%) - Black or African American
Geographical mobility - Moved within same county (%) - Asian
Geographical mobility - Moved within same county (%) - Hispanic or Latino
Geographical mobility - Moved within same county (%) - American Indian and Alaska Native
Geographical mobility - Moved within same county (%) - Multirace
Geographical mobility - Moved within same county (%) - Other Race
Geographical mobility - Moved from different county within same state (%)
Geographical mobility - Moved from different county within same state (%) - White
Geographical mobility - Moved from different county within same state (%) - Black or African American
Geographical mobility - Moved from different county within same state (%) - Asian
Geographical mobility - Moved from different county within same state (%) - Hispanic or Latino
Geographical mobility - Moved from different county within same state (%) - American Indian and Alaska Native
Geographical mobility - Moved from different county within same state (%) - Multirace
Geographical mobility - Moved from different county within same state (%) - Other Race
Geographical mobility - Moved from different state (%)
Geographical mobility - Moved from different state (%) - White
Geographical mobility - Moved from different state (%) - Black or African American
Geographical mobility - Moved from different state (%) - Asian
Geographical mobility - Moved from different state (%) - Hispanic or Latino
Geographical mobility - Moved from different state (%) - American Indian and Alaska Native
Geographical mobility - Moved from different state (%) - Multirace
Geographical mobility - Moved from different state (%) - Other Race
Geographical mobility - Moved from abroad (%)
Geographical mobility - Moved from abroad (%) - White
Geographical mobility - Moved from abroad (%) - Black or African American
Geographical mobility - Moved from abroad (%) - Asian
Geographical mobility - Moved from abroad (%) - Hispanic or Latino
Geographical mobility - Moved from abroad (%) - American Indian and Alaska Native
Geographical mobility - Moved from abroad (%) - Multirace
Geographical mobility - Moved from abroad (%) - Other Race
Place of birth for the foreign-born population - Ireland (%)
Place of birth for the foreign-born population - Denmark (%)
Place of birth for the foreign-born population - Norway (%)
Place of birth for the foreign-born population - Sweden (%)
Place of birth for the foreign-born population - United Kingdom (%)
Place of birth for the foreign-born population - England (%)
Place of birth for the foreign-born population - Scotland (%)
Place of birth for the foreign-born population - Other Northern Europe (%)
Place of birth for the foreign-born population - Austria (%)
Place of birth for the foreign-born population - Belgium (%)
Place of birth for the foreign-born population - France (%)
Place of birth for the foreign-born population - Germany (%)
Place of birth for the foreign-born population - Netherlands (%)
Place of birth for the foreign-born population - Switzerland (%)
Place of birth for the foreign-born population - Other Western Europe (%)
Place of birth for the foreign-born population - Greece (%)
Place of birth for the foreign-born population - Italy (%)
Place of birth for the foreign-born population - Portugal (%)
Place of birth for the foreign-born population - Spain (%)
Place of birth for the foreign-born population - Other Southern Europe (%)
Place of birth for the foreign-born population - Albania (%)
Place of birth for the foreign-born population - Belarus (%)
Place of birth for the foreign-born population - Bosnia and Herzegovina (%)
Place of birth for the foreign-born population - Bulgaria (%)
Place of birth for the foreign-born population - Croatia (%)
Place of birth for the foreign-born population - Czechoslovakia (%)
Place of birth for the foreign-born population - Hungary (%)
Place of birth for the foreign-born population - Latvia (%)
Place of birth for the foreign-born population - Lithuania (%)
Place of birth for the foreign-born population - North Macedonia (Macedonia) (%)
Place of birth for the foreign-born population - Moldova (%)
Place of birth for the foreign-born population - Poland (%)
Place of birth for the foreign-born population - Romania (%)
Place of birth for the foreign-born population - Russia (%)
Place of birth for the foreign-born population - Serbia (%)
Place of birth for the foreign-born population - Ukraine (%)
Place of birth for the foreign-born population - Other Eastern Europe (%)
Place of birth for the foreign-born population - China (%)
Place of birth for the foreign-born population - Hong Kong (%)
Place of birth for the foreign-born population - Taiwan (%)
Place of birth for the foreign-born population - Japan (%)
Place of birth for the foreign-born population - Korea (%)
Place of birth for the foreign-born population - Other Eastern Asia (%)
Place of birth for the foreign-born population - Afghanistan (%)
Place of birth for the foreign-born population - Bangladesh (%)
Place of birth for the foreign-born population - India (%)
Place of birth for the foreign-born population - Iran (%)
Place of birth for the foreign-born population - Kazakhstan (%)
Place of birth for the foreign-born population - Nepal (%)
Place of birth for the foreign-born population - Pakistan (%)
Place of birth for the foreign-born population - Sri Lanka (%)
Place of birth for the foreign-born population - Uzbekistan (%)
Place of birth for the foreign-born population - Other South Central Asia (%)
Place of birth for the foreign-born population - Burma (%)
Place of birth for the foreign-born population - Cambodia (%)
Place of birth for the foreign-born population - Indonesia (%)
Place of birth for the foreign-born population - Laos (%)
Place of birth for the foreign-born population - Malaysia (%)
Place of birth for the foreign-born population - Philippines (%)
Place of birth for the foreign-born population - Singapore (%)
Place of birth for the foreign-born population - Thailand (%)
Place of birth for the foreign-born population - Vietnam (%)
Place of birth for the foreign-born population - Other South Eastern Asia (%)
Place of birth for the foreign-born population - Armenia (%)
Place of birth for the foreign-born population - Iraq (%)
Place of birth for the foreign-born population - Israel (%)
Place of birth for the foreign-born population - Jordan (%)
Place of birth for the foreign-born population - Kuwait (%)
Place of birth for the foreign-born population - Lebanon (%)
Place of birth for the foreign-born population - Saudi Arabia (%)
Place of birth for the foreign-born population - Syria (%)
Place of birth for the foreign-born population - Turkey (%)
Place of birth for the foreign-born population - Yemen (%)
Place of birth for the foreign-born population - Other Western Asia (%)
Place of birth for the foreign-born population - Eritrea (%)
Place of birth for the foreign-born population - Ethiopia (%)
Place of birth for the foreign-born population - Kenya (%)
Place of birth for the foreign-born population - Somalia (%)
Place of birth for the foreign-born population - Uganda (%)
Place of birth for the foreign-born population - Zimbabwe (%)
Place of birth for the foreign-born population - Other Eastern Africa (%)
Place of birth for the foreign-born population - Cameroon (%)
Place of birth for the foreign-born population - Congo (%)
Place of birth for the foreign-born population - Democratic Republic of Congo (Zaire) (%)
Place of birth for the foreign-born population - Other Middle Africa (%)
Place of birth for the foreign-born population - Egypt (%)
Place of birth for the foreign-born population - Morocco (%)
Place of birth for the foreign-born population - Sudan (%)
Place of birth for the foreign-born population - Other Northern Africa (%)
Place of birth for the foreign-born population - South Africa (%)
Place of birth for the foreign-born population - Other Southern Africa (%)
Place of birth for the foreign-born population - Cabo Verde (%)
Place of birth for the foreign-born population - Ghana (%)
Place of birth for the foreign-born population - Liberia (%)
Place of birth for the foreign-born population - Nigeria (%)
Place of birth for the foreign-born population - Senegal (%)
Place of birth for the foreign-born population - Sierra Leone (%)
Place of birth for the foreign-born population - Other Western Africa (%)
Place of birth for the foreign-born population - Australia (%)
Place of birth for the foreign-born population - New Zealand (%)
Place of birth for the foreign-born population - Fiji (%)
Place of birth for the foreign-born population - Micronesia (%)
Place of birth for the foreign-born population - Bahamas (%)
Place of birth for the foreign-born population - Barbados (%)
Place of birth for the foreign-born population - Cuba (%)
Place of birth for the foreign-born population - Dominica (%)
Place of birth for the foreign-born population - Dominican Republic (%)
Place of birth for the foreign-born population - Grenada (%)
Place of birth for the foreign-born population - Haiti (%)
Place of birth for the foreign-born population - Jamaica (%)
Place of birth for the foreign-born population - St. Vincent and the Grenadines (%)
Place of birth for the foreign-born population - Trinidad and Tobago (%)
Place of birth for the foreign-born population - West Indies (%)
Place of birth for the foreign-born population - Other Caribbean (%)
Place of birth for the foreign-born population - Belize (%)
Place of birth for the foreign-born population - Costa Rica (%)
Place of birth for the foreign-born population - El Salvador (%)
Place of birth for the foreign-born population - Guatemala (%)
Place of birth for the foreign-born population - Honduras (%)
Place of birth for the foreign-born population - Mexico (%)
Place of birth for the foreign-born population - Nicaragua (%)
Place of birth for the foreign-born population - Panama (%)
Place of birth for the foreign-born population - Other Central America (%)
Place of birth for the foreign-born population - Argentina (%)
Place of birth for the foreign-born population - Bolivia (%)
Place of birth for the foreign-born population - Brazil (%)
Place of birth for the foreign-born population - Chile (%)
Place of birth for the foreign-born population - Colombia (%)
Place of birth for the foreign-born population - Ecuador (%)
Place of birth for the foreign-born population - Guyana (%)
Place of birth for the foreign-born population - Peru (%)
Place of birth for the foreign-born population - Uruguay (%)
Place of birth for the foreign-born population - Venezuela (%)
Place of birth for the foreign-born population - Other South America (%)
Place of birth for the foreign-born population - Canada (%)
Place of birth for the foreign-born population - Other Northern America (%)
Place of birth for the foreign-born population - Other (%)
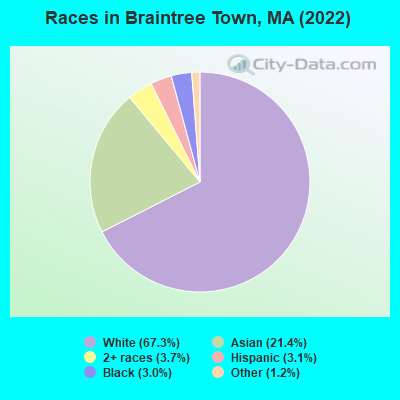
According to 2022 data, the most numerous races in Braintree Town, MA are White alone (26,199 residents), Hispanic (1,223 residents), and Asian alone (8,318 residents). 73.4% of Braintree Town residents speak English at home.
Race distribution in Braintree Town 26,199 67.3% White alone 8,318 21.4% Asian alone 1,447 3.7% Two or more races 1,223 3.1% Hispanic 1,152 3.0% Black alone 474 1.2% Other race alone 4 0.01% American Indian alone
2000 2022
5,198,359 81.9% White alone 428,729 6.8% Hispanic 318,329 5.0% Black alone 236,786 3.7% Asian alone 110,338 1.7% Two or more races 43,586 0.7% Other race alone 11,264 0.2% American Indian alone 1,706 0.03% Native Hawaiian and Other
4,676,627 67.0% White alone 911,038 13.0% Hispanic 501,463 7.2% Asian alone 459,740 6.6% Black alone 341,889 4.9% Two or more races 84,403 1.2% Other race alone 5,838 0.08% American Indian alone 976 0.01% Native Hawaiian and Other
Income and house value in Braintree Town Median household income in 2022 $106,011 White non-Hispanic householders$108,991 Black householders$176,413 Asian householders$139,055 Two or more races householders$92,502 Hispanic or Latino race householders
Median age by race in Braintree Town
47.5 Median age for White residents42.6 50.8 33.2 Median age for Black or African American residents32.7 33.9 -655,238,094.6 Median age for American Indian / Alaska Native residents-649,474,688.9 -657,223,795.4 37.3 Median age for Asian residents36.8 37.4 -514,227,641.8 Median age for Native Hawaiian / Pacific Islander residents-513,131,312.6 -508,717,948.2 36.3 Median age for Other race residents30.3 35.6 24.6 Median age for Two or more races residents22.5 26.7 47.5 Median age for White alone residents42.7 50.7 33.0 Median age for Hispanic or Latino residents34.5 31.9
Owner/renter occupied households by race in Braintree Town
House owners and renters - White residents 8,178 76.7% Owner occupied2,482 23.3% Renter occupiedHouse owners and renters - Black or African American residents 390 64.6% Owner occupied213 35.4% Renter occupiedHouse owners and renters - Asian residents 2,328 87.2% Owner occupied342 12.8% Renter occupiedHouse owners and renters - Other race residents 99 50.3% Owner occupied98 49.7% Renter occupiedHouse owners and renters - Two or more races residents 286 66.8% Owner occupied142 33.2% Renter occupiedHouse owners and renters - White alone residents 8,119 76.5% Owner occupied2,496 23.5% Renter occupiedHouse owners and renters - Hispanic or Latino residents 269 68.3% Owner occupied125 31.7% Renter occupied
Language usage in Braintree Town
English speakers - Total 73.4% of residents of Braintree Town speak English at home.
2.1% of residents speak Spanish at home 572 71.4% Speak English very well229 28.6% Speak English less than very well24.4% of residents speak other language at home 5,767 63.5% Speak English very well3,319 36.5% Speak English less than very well
English speakers - Born in the United States 86.3% of residents of Braintree Town speak English at home.
2.7% of residents speak Spanish at home 108 87.1% Speak English very well16 12.9% Speak English less than very well11.4% of residents speak other language at home 491 92.6% Speak English very well39 7.4% Speak English less than very well
English speakers - Native, born elsewhere 45.9% of residents of Braintree Town speak English at home.
22.9% of residents speak Spanish at home 83 64.8% Speak English very well45 35.2% Speak English less than very well27.0% of residents speak other language at home 151 100.0% Speak English very well
English speakers - Foreign-born 15.4% of residents of Braintree Town speak English at home.
5.2% of residents speak Spanish at home 266 65.7% Speak English very well139 34.3% Speak English less than very well78.9% of residents speak other language at home 3,088 50.4% Speak English very well3,040 49.6% Speak English less than very well
White (Caucasian) - Speak only English Native:
96.6% (23,254)Foreign-born:
42.1% (622)
White (Caucasian) - Speak another language Native:
3.4% (810)Foreign-born:
57.6% (852)
Black or African American - Speak only English Native:
85.1% (728)Foreign-born:
53.3% (169)
Black or African American - Speak another language Native:
14.6% (125)Foreign-born:
32.5% (103)
Asian - Speak only English Native:
30.8% (919)Foreign-born:
6.5% (329)
Asian - Speak another language Native:
68.5% (2,043)Foreign-born:
92.7% (4,694)
Other race - Speak another language Native:
44.2% (130)Foreign-born:
98.2% (122)
Two or more races - Speak another language Native:
17.4% (222)Foreign-born:
100.0% (782)
White alone - Speak only English Native:
96.6% (23,132)Foreign-born:
40.3% (623)
White alone - Speak another language Native:
3.4% (807)Foreign-born:
58.6% (905)
Hispanic or Latino - Speak only English Native:
49.8% (280)Foreign-born:
1.1% (5)
Hispanic or Latino - Speak another language Native:
50.2% (282)Foreign-born:
100.0% (461)
Foreign-born residents in Braintree Town
Marital status for residents in Braintree Town Marital status - White (Caucasian) population 15 years and over
Males 36.8% Never married52.8% Now married0.8% Separated4.6% Widowed5.1% DivorcedFemales 29.8% Never married46.6% Now married0.5% Separated11.2% Widowed11.9% DivorcedWomen who gave birth in the past 12 months Now married:
50.6% (122)Unmarried:
49.4% (119)
Women who did not give birth in the past 12 months Now married:
38.6% (1,934)Unmarried:
61.4% (3,072)
Marital status - Black or African American population 15 years and over
Males 39.9% Never married53.8% Now married2.3% Separated0.0% Widowed4.0% DivorcedFemales 56.1% Never married29.4% Now married3.3% Separated4.3% Widowed7.0% DivorcedWomen who gave birth in the past 12 months Now married:
100.0% (43)Unmarried:
0.0% (0)
Women who did not give birth in the past 12 months Now married:
28.5% (88)Unmarried:
71.5% (220)
Marital status - Asian population 15 years and over
Males 33.0% Never married56.0% Now married1.9% Separated0.2% Widowed8.9% DivorcedFemales 27.8% Never married61.3% Now married1.5% Separated4.2% Widowed5.2% DivorcedWomen who gave birth in the past 12 months Now married:
81.5% (46)Unmarried:
18.5% (11)
Women who did not give birth in the past 12 months Now married:
58.1% (1,296)Unmarried:
41.9% (936)
Marital status - Other race population 15 years and over
Males 37.6% Never married62.4% Now married0.0% Separated0.0% Widowed0.0% DivorcedFemales 43.4% Never married51.2% Now married5.4% Separated0.0% Widowed0.0% DivorcedWomen who did not give birth in the past 12 months Now married:
52.0% (123)Unmarried:
48.0% (114)
Marital status - Two or more races population 15 years and over
Males 58.2% Never married35.9% Now married0.0% Separated0.0% Widowed5.8% DivorcedFemales 50.9% Never married35.8% Now married0.0% Separated3.4% Widowed9.9% DivorcedWomen who gave birth in the past 12 months Now married:
100.0% (34)Unmarried:
0.0% (0)
Women who did not give birth in the past 12 months Now married:
36.6% (239)Unmarried:
63.4% (412)
Marital status - White alone, not Hispanic / Latino population 15 years and over
Males 36.9% Never married52.7% Now married0.6% Separated4.7% Widowed5.1% DivorcedFemales 29.9% Never married46.7% Now married0.5% Separated11.0% Widowed11.8% DivorcedWomen who gave birth in the past 12 months Now married:
48.4% (113)Unmarried:
51.6% (121)
Women who did not give birth in the past 12 months Now married:
38.5% (1,943)Unmarried:
61.5% (3,100)
Marital status - Hispanic or Latino population 15 years and over
Males 55.0% Never married33.9% Now married5.3% Separated0.0% Widowed5.8% DivorcedFemales 44.5% Never married38.6% Now married2.0% Separated8.6% Widowed6.1% DivorcedWomen who gave birth in the past 12 months Now married:
100.0% (23)Unmarried:
0.0% (0)
Women who did not give birth in the past 12 months Now married:
43.6% (132)Unmarried:
56.4% (171)
Ancestries in Braintree Town
5,340 26.8% Irish1,622 8.1% Italian976 4.9% American710 3.6% English302 1.5% European242 1.2% Brazilian225 1.1% German221 1.1% Portuguese198 1.0% Greek182 0.9% Egyptian163 0.8% Scottish158 0.8% Lithuanian154 0.8% Polish140 0.7% Russian136 0.7% Jamaican129 0.6% Moroccan126 0.6% Haitian110 0.6% Cape Verdean110 0.6% Canadian109 0.5% Albanian106 0.5% French Canadian97 0.5% Swedish96 0.5% Lebanese89 0.4% Scotch-Irish89 0.4% Eastern European82 0.4% Bulgarian56 0.3% African55 0.3% Syrian51 0.3% Danish46 0.2% Turkish43 0.2% French36 0.2% Armenian33 0.2% Finnish24 0.1% Iranian22 0.1% Swiss21 0.1% Macedonian17 0.09% Australian11 0.06% Slovak10 0.05% Northern European8 0.04% Norwegian6 0.03% British4 0.02% Celtic3 0.02% Dutch3 0.02% Scandinavian3 0.02% Belgian2 0.01% Trinidadian and Tobagonian
Geographical mobility in Braintree Town Same house 1 year ago 24,034 92.0% White (Caucasian)1,270 98.8% Black or African American6 100.0% American Indian / Alaska Native7,402 90.1% Asian397 96.7% Other race1,738 76.6% Two or more races23,970 91.9% White alone, not Hispanic / Latino952 80.5% Hispanic or LatinoMoved within same county 956 3.7% White / Caucasian343 4.2% Asian9 2.1% Other race131 5.8% Two or more races970 3.7% White alone, not Hispanic / Latino37 3.1% Hispanic or LatinoMoved within same state 511 2.0% White / Caucasian23 1.8% Black or African American284 3.5% Asian356 15.7% Two or more races523 2.0% White alone, not Hispanic / Latino124 10.5% Hispanic or LatinoMoved from different state 407 1.6% White / Caucasian14 0.2% Asian2 0.4% Other race395 1.5% White alone, not Hispanic / Latino15 1.3% Hispanic or LatinoMoved from abroad 120 0.5% White62 0.8% Asian129 0.5% White alone, not Hispanic / Latino
Children Nativity (place of birth) in Braintree Town
Children under 6 years - Living with two parents Both parents native 768 100.0% NativeBoth parents foreign-born 485 100.0% NativeOne native, one foreign-born parent 464 100.0% NativeChildren under 6 years - Living with one parent Native parent 207 100.0% NativeForeign-born parent 108 100.0% NativeChildren 6 to 17 years - Living with two parents Both parents native 2,458 99.6% Native9 0.4% Foreign-bornBoth parents foreign-born 1,284 92.4% Native105 7.6% Foreign-bornOne native, one foreign-born parent 381 100.0% NativeChildren 6 to 17 years - Living with one parent Native parent 759 100.0% NativeForeign-born parent 536 58.4% Native381 41.6% Foreign-born
Grandparents responsible for own grandchildren in Braintree Town
Grandparents (30 to 59 years) White / Caucasian 13 13.6% Responsible for grandchildren85 86.4% Not responsible for grandchildrenAsian 5 23.4% Responsible for grandchildren16 76.6% Not responsible for grandchildrenWhite alone, not Hispanic / Latino 94 100.0% Not responsible for grandchildrenHispanic or Latino 14 100.0% Responsible for grandchildrenGrandparents (60 years and over) White / Caucasian 19 6.3% Responsible for grandchildren291 93.7% Not responsible for grandchildrenAsian 52 15.0% Responsible for grandchildren293 85.0% Not responsible for grandchildrenWhite alone, not Hispanic / Latino 20 6.3% Responsible for grandchildren292 93.7% Not responsible for grandchildrenHispanic or Latino 41 100.0% Not responsible for grandchildren