Races in Brazosport, Texas (TX) Detailed Stats
Ancestries, Foreign-born residents, place of birth
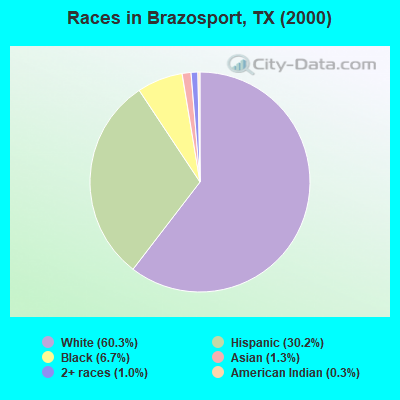
Race distribution in Brazosport

- 35,99560.3%White alone
- 18,03030.2%Hispanic
- 3,9826.7%Black alone
- 8041.3%Asian alone
- 5981.0%Two or more races
- 1880.3%American Indian alone
- 480.08%Other race alone
- 80.01%Native Hawaiian and Other
Pacific Islander alone
2000
2022
-
- 10,933,31352.4%White alone
- 6,669,66632.0%Hispanic
- 2,364,25511.3%Black alone
- 554,4452.7%Asian alone
- 230,5671.1%Two or more races
- 68,8590.3%American Indian alone
- 19,9580.10%Other race alone
- 10,7570.05%Native Hawaiian and Other
Pacific Islander alone

-
- 12,070,64240.2%Hispanic
- 11,683,43038.9%White alone
- 3,508,70611.7%Black alone
- 1,608,1735.4%Asian alone
- 956,5603.2%Two or more races
- 125,7630.4%Other race alone
- 47,0230.2%American Indian alone
- 29,2750.10%Native Hawaiian and Other
Pacific Islander alone

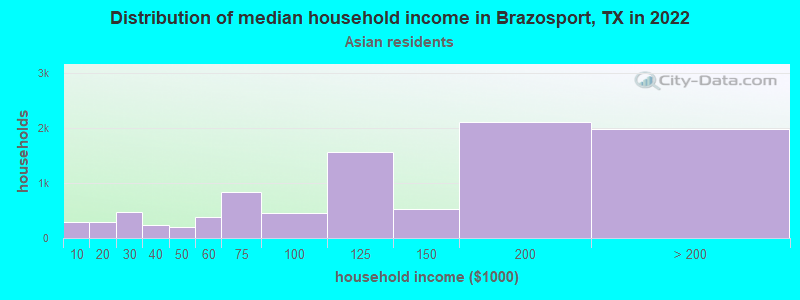
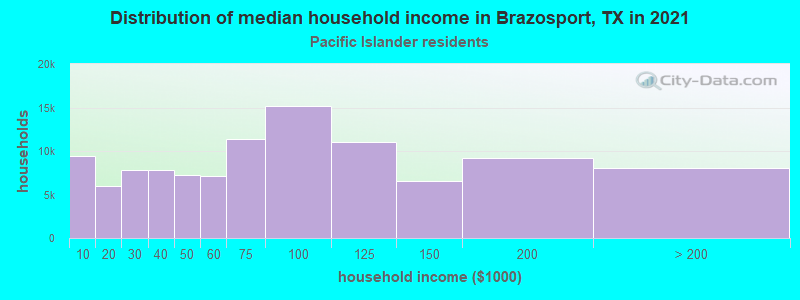
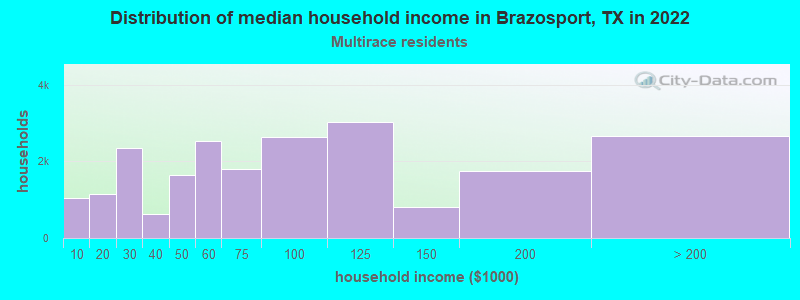
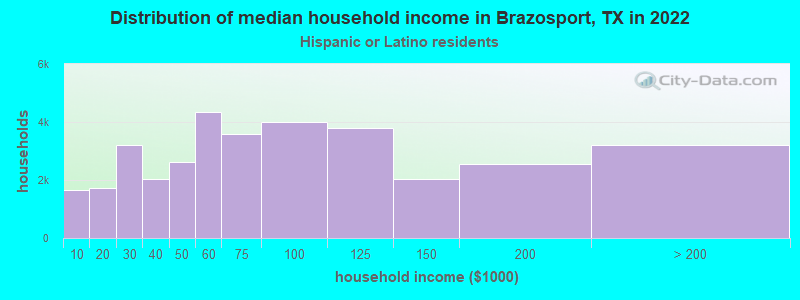
Income and house value in Brazosport
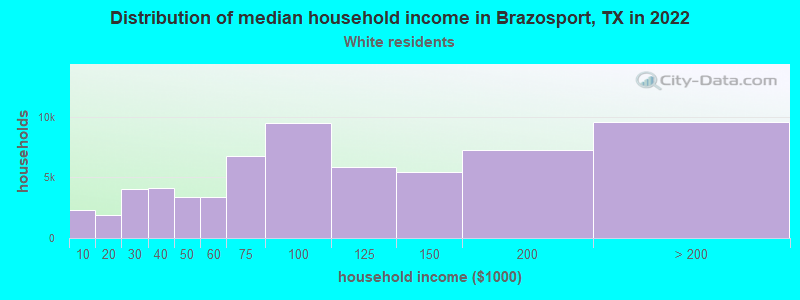
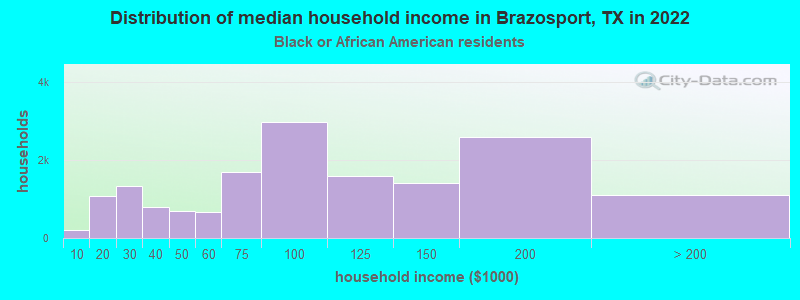
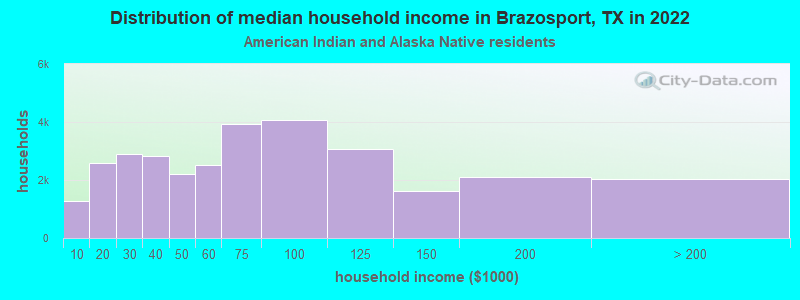
- Median household income in 2022
- $84,792White non-Hispanic householders
- $64,849Black householders
- $48,495American Indian and Alaska Native householders
- $144,242Asian householders
- $57,805Some other race householders
- $65,748Two or more races householders
- $64,995Hispanic or Latino race householders
- Median 2022 house value
- $272,270White Non-Hispanic householders
- $221,567Black or African American householders
- $314,986American Indian or Alaska Native householders
- $451,121Asian householders
- $141,691Some other race householders
- $168,085Two or more races householders
- $158,361Hispanic or Latino householders
Household income for White non-Hispanic householders
Household income for Black householders
Household income for American Indian and Alaska Native householders
Household income for Asian householders
Household income for Native Hawaiian and other Pacific Islander householders
Household income for Two or more races householders
Household income for Hispanic or Latino race householders
Zip code: 77541