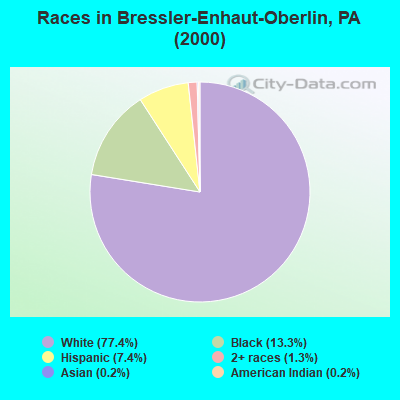
Races in Bressler-Enhaut-Oberlin, Pennsylvania (PA) Detailed Stats
Ancestries, Foreign-born residents, place of birth

Discuss Bressler-Enhaut-Oberlin, Pennsylvania races on our local forum with over 2,400,000 registered users
3.0% of Bressler-Enhaut-Oberlin, PA residents are foreign-born (2.7% born in Latin America), which is 134.1% less than the foreign-born rate of 7.0% across the entire state of Pennsylvania.
Race distribution in Bressler-Enhaut-Oberlin

- 2,17477.4%White alone
- 37313.3%Black alone
- 2097.4%Hispanic
- 371.3%Two or more races
- 70.2%Asian alone
- 60.2%American Indian alone
- 20.07%Other race alone
- 10.04%Native Hawaiian and Other
Pacific Islander alone
2000
2022
-
- 10,322,45584.1%White alone
- 1,202,4379.8%Black alone
- 394,0883.2%Hispanic
- 218,2961.8%Asian alone
- 113,0970.9%Two or more races
- 13,0860.1%Other race alone
- 14,9040.1%American Indian alone
- 2,6910.02%Native Hawaiian and Other
Pacific Islander alone

-
- 9,487,22873.1%White alone
- 1,311,58110.1%Black alone
- 1,115,9978.6%Hispanic
- 493,9423.8%Two or more races
- 487,1243.8%Asian alone
- 63,5820.5%Other race alone
- 10,1300.08%American Indian alone
- 2,4240.02%Native Hawaiian and Other
Pacific Islander alone

Income and house value in Bressler-Enhaut-Oberlin
- Median household income in 2022
- $55,724White non-Hispanic householders
- $56,652Black householders
- $100,168Some other race householders
- $72,974Hispanic or Latino race householders
- Median 2022 house value
- $173,567White Non-Hispanic householders
- $143,171Black or African American householders
- $143,171Hispanic or Latino householders
Household income for White non-Hispanic householders

Household income for Black householders

Household income for Hispanic or Latino race householders

Foreign-born residents in Bressler-Enhaut-Oberlin
84 residents are foreign born (2.7% Latin America).
| This city: | 3.0% |
| Pennsylvania: | 4.1% |
Ancestries in Bressler-Enhaut-Oberlin

- 1,02235.8%Other
- 82628.9%German
- 2267.9%Irish
- 1846.4%Italian
- 1565.5%United States
- 1093.8%Polish
- 702.4%English
- 672.3%Dutch
- 541.9%Scotch-Irish
- 391.4%Hungarian
- 270.9%French
- 270.9%Slovak
- 190.7%Lithuanian
- 170.6%Russian
- 80.3%Subsaharan African
- 70.2%Welsh

Zip codes: 17113.