Races in Bridgeton, New Jersey (NJ) Detailed Stats
Data:
Races - White alone (%)
Races - White alone (% change since 2000)
Races - Black alone (%)
Races - Black alone (% change since 2000)
Races - American Indian alone (%)
Races - American Indian alone (% change since 2000)
Races - Asian alone (%)
Races - Asian alone (% change since 2000)
Races - Hispanic (%)
Races - Hispanic (% change since 2000)
Races - Native Hawaiian and Other Pacific Islander alone (%)
Races - Native Hawaiian and Other Pacific Islander alone (% change since 2000)
Races - Two or more races(%)
Races - Two or more races(% change since 2000)
Races - Other race alone (%)
Races - Other race alone (% change since 2000)
Racial diversity
Place of birth - Born in state of residence (%)
Place of birth - Born in state of residence (%) - White
Place of birth - Born in state of residence (%) - Black or African American
Place of birth - Born in state of residence (%) - Asian
Place of birth - Born in state of residence (%) - Hispanic or Latino
Place of birth - Born in state of residence (%) - American Indian and Alaska Native
Place of birth - Born in state of residence (%) - Multirace
Place of birth - Born in state of residence (%) - Other Race
Place of birth - Born in other state (%)
Place of birth - Born in other state (%) - White
Place of birth - Born in other state (%) - Black or African American
Place of birth - Born in other state (%) - Asian
Place of birth - Born in other state (%) - Hispanic or Latino
Place of birth - Born in other state (%) - American Indian and Alaska Native
Place of birth - Born in other state (%) - Multirace
Place of birth - Born in other state (%) - Other Race
Place of birth - Native, outside of US (%)
Place of birth - Native, outside of US (%) - White
Place of birth - Native, outside of US (%) - Black or African American
Place of birth - Native, outside of US (%) - Asian
Place of birth - Native, outside of US (%) - Hispanic or Latino
Place of birth - Native, outside of US (%) - American Indian and Alaska Native
Place of birth - Native, outside of US (%) - Multirace
Place of birth - Native, outside of US (%) - Other Race
Place of birth - Foreign born (%)
Place of birth - Foreign born (%) - White
Place of birth - Foreign born (%) - Black or African American
Place of birth - Foreign born (%) - Asian
Place of birth - Foreign born (%) - Hispanic or Latino
Place of birth - Foreign born (%) - American Indian and Alaska Native
Place of birth - Foreign born (%) - Multirace
Place of birth - Foreign born (%) - Other Race
Residents speaking English at home (%)
Residents speaking English at home - Born in the United States (%)
Residents speaking English at home - Native, born elsewhere (%)
Residents speaking English at home - Foreign born (%)
Residents speaking Spanish at home (%)
Residents speaking Spanish at home - Born in the United States (%)
Residents speaking Spanish at home - Native, born elsewhere (%)
Residents speaking Spanish at home - Foreign born (%)
Residents speaking other language at home (%)
Residents speaking other language at home - Born in the United States (%)
Residents speaking other language at home - Native, born elsewhere (%)
Residents speaking other language at home - Foreign born (%)
Marital status - Never married (%)
Marital status - Now married (%)
Marital status - Separated (%)
Marital status - Widowed (%)
Marital status - Divorced (%)
Ancestries Reported - Arab (%)
Ancestries Reported - Czech (%)
Ancestries Reported - Danish (%)
Ancestries Reported - Dutch (%)
Ancestries Reported - English (%)
Ancestries Reported - French (%)
Ancestries Reported - French Canadian (%)
Ancestries Reported - German (%)
Ancestries Reported - Greek (%)
Ancestries Reported - Hungarian (%)
Ancestries Reported - Irish (%)
Ancestries Reported - Italian (%)
Ancestries Reported - Lithuanian (%)
Ancestries Reported - Norwegian (%)
Ancestries Reported - Polish (%)
Ancestries Reported - Portuguese (%)
Ancestries Reported - Russian (%)
Ancestries Reported - Scotch-Irish (%)
Ancestries Reported - Scottish (%)
Ancestries Reported - Slovak (%)
Ancestries Reported - Subsaharan African (%)
Ancestries Reported - Swedish (%)
Ancestries Reported - Swiss (%)
Ancestries Reported - Ukrainian (%)
Ancestries Reported - United States (%)
Ancestries Reported - Welsh (%)
Ancestries Reported - West Indian (%)
Ancestries Reported - Other (%)
Geographical mobility - Same house 1 year ago (%)
Geographical mobility - Same house 1 year ago (%) - White
Geographical mobility - Same house 1 year ago (%) - Black or African American
Geographical mobility - Same house 1 year ago (%) - Asian
Geographical mobility - Same house 1 year ago (%) - Hispanic or Latino
Geographical mobility - Same house 1 year ago (%) - American Indian and Alaska Native
Geographical mobility - Same house 1 year ago (%) - Multirace
Geographical mobility - Same house 1 year ago (%) - Other Race
Geographical mobility - Moved within same county (%)
Geographical mobility - Moved within same county (%) - White
Geographical mobility - Moved within same county (%) - Black or African American
Geographical mobility - Moved within same county (%) - Asian
Geographical mobility - Moved within same county (%) - Hispanic or Latino
Geographical mobility - Moved within same county (%) - American Indian and Alaska Native
Geographical mobility - Moved within same county (%) - Multirace
Geographical mobility - Moved within same county (%) - Other Race
Geographical mobility - Moved from different county within same state (%)
Geographical mobility - Moved from different county within same state (%) - White
Geographical mobility - Moved from different county within same state (%) - Black or African American
Geographical mobility - Moved from different county within same state (%) - Asian
Geographical mobility - Moved from different county within same state (%) - Hispanic or Latino
Geographical mobility - Moved from different county within same state (%) - American Indian and Alaska Native
Geographical mobility - Moved from different county within same state (%) - Multirace
Geographical mobility - Moved from different county within same state (%) - Other Race
Geographical mobility - Moved from different state (%)
Geographical mobility - Moved from different state (%) - White
Geographical mobility - Moved from different state (%) - Black or African American
Geographical mobility - Moved from different state (%) - Asian
Geographical mobility - Moved from different state (%) - Hispanic or Latino
Geographical mobility - Moved from different state (%) - American Indian and Alaska Native
Geographical mobility - Moved from different state (%) - Multirace
Geographical mobility - Moved from different state (%) - Other Race
Geographical mobility - Moved from abroad (%)
Geographical mobility - Moved from abroad (%) - White
Geographical mobility - Moved from abroad (%) - Black or African American
Geographical mobility - Moved from abroad (%) - Asian
Geographical mobility - Moved from abroad (%) - Hispanic or Latino
Geographical mobility - Moved from abroad (%) - American Indian and Alaska Native
Geographical mobility - Moved from abroad (%) - Multirace
Geographical mobility - Moved from abroad (%) - Other Race
Place of birth for the foreign-born population - Ireland (%)
Place of birth for the foreign-born population - Denmark (%)
Place of birth for the foreign-born population - Norway (%)
Place of birth for the foreign-born population - Sweden (%)
Place of birth for the foreign-born population - United Kingdom (%)
Place of birth for the foreign-born population - England (%)
Place of birth for the foreign-born population - Scotland (%)
Place of birth for the foreign-born population - Other Northern Europe (%)
Place of birth for the foreign-born population - Austria (%)
Place of birth for the foreign-born population - Belgium (%)
Place of birth for the foreign-born population - France (%)
Place of birth for the foreign-born population - Germany (%)
Place of birth for the foreign-born population - Netherlands (%)
Place of birth for the foreign-born population - Switzerland (%)
Place of birth for the foreign-born population - Other Western Europe (%)
Place of birth for the foreign-born population - Greece (%)
Place of birth for the foreign-born population - Italy (%)
Place of birth for the foreign-born population - Portugal (%)
Place of birth for the foreign-born population - Spain (%)
Place of birth for the foreign-born population - Other Southern Europe (%)
Place of birth for the foreign-born population - Albania (%)
Place of birth for the foreign-born population - Belarus (%)
Place of birth for the foreign-born population - Bosnia and Herzegovina (%)
Place of birth for the foreign-born population - Bulgaria (%)
Place of birth for the foreign-born population - Croatia (%)
Place of birth for the foreign-born population - Czechoslovakia (%)
Place of birth for the foreign-born population - Hungary (%)
Place of birth for the foreign-born population - Latvia (%)
Place of birth for the foreign-born population - Lithuania (%)
Place of birth for the foreign-born population - North Macedonia (Macedonia) (%)
Place of birth for the foreign-born population - Moldova (%)
Place of birth for the foreign-born population - Poland (%)
Place of birth for the foreign-born population - Romania (%)
Place of birth for the foreign-born population - Russia (%)
Place of birth for the foreign-born population - Serbia (%)
Place of birth for the foreign-born population - Ukraine (%)
Place of birth for the foreign-born population - Other Eastern Europe (%)
Place of birth for the foreign-born population - China (%)
Place of birth for the foreign-born population - Hong Kong (%)
Place of birth for the foreign-born population - Taiwan (%)
Place of birth for the foreign-born population - Japan (%)
Place of birth for the foreign-born population - Korea (%)
Place of birth for the foreign-born population - Other Eastern Asia (%)
Place of birth for the foreign-born population - Afghanistan (%)
Place of birth for the foreign-born population - Bangladesh (%)
Place of birth for the foreign-born population - India (%)
Place of birth for the foreign-born population - Iran (%)
Place of birth for the foreign-born population - Kazakhstan (%)
Place of birth for the foreign-born population - Nepal (%)
Place of birth for the foreign-born population - Pakistan (%)
Place of birth for the foreign-born population - Sri Lanka (%)
Place of birth for the foreign-born population - Uzbekistan (%)
Place of birth for the foreign-born population - Other South Central Asia (%)
Place of birth for the foreign-born population - Burma (%)
Place of birth for the foreign-born population - Cambodia (%)
Place of birth for the foreign-born population - Indonesia (%)
Place of birth for the foreign-born population - Laos (%)
Place of birth for the foreign-born population - Malaysia (%)
Place of birth for the foreign-born population - Philippines (%)
Place of birth for the foreign-born population - Singapore (%)
Place of birth for the foreign-born population - Thailand (%)
Place of birth for the foreign-born population - Vietnam (%)
Place of birth for the foreign-born population - Other South Eastern Asia (%)
Place of birth for the foreign-born population - Armenia (%)
Place of birth for the foreign-born population - Iraq (%)
Place of birth for the foreign-born population - Israel (%)
Place of birth for the foreign-born population - Jordan (%)
Place of birth for the foreign-born population - Kuwait (%)
Place of birth for the foreign-born population - Lebanon (%)
Place of birth for the foreign-born population - Saudi Arabia (%)
Place of birth for the foreign-born population - Syria (%)
Place of birth for the foreign-born population - Turkey (%)
Place of birth for the foreign-born population - Yemen (%)
Place of birth for the foreign-born population - Other Western Asia (%)
Place of birth for the foreign-born population - Eritrea (%)
Place of birth for the foreign-born population - Ethiopia (%)
Place of birth for the foreign-born population - Kenya (%)
Place of birth for the foreign-born population - Somalia (%)
Place of birth for the foreign-born population - Uganda (%)
Place of birth for the foreign-born population - Zimbabwe (%)
Place of birth for the foreign-born population - Other Eastern Africa (%)
Place of birth for the foreign-born population - Cameroon (%)
Place of birth for the foreign-born population - Congo (%)
Place of birth for the foreign-born population - Democratic Republic of Congo (Zaire) (%)
Place of birth for the foreign-born population - Other Middle Africa (%)
Place of birth for the foreign-born population - Egypt (%)
Place of birth for the foreign-born population - Morocco (%)
Place of birth for the foreign-born population - Sudan (%)
Place of birth for the foreign-born population - Other Northern Africa (%)
Place of birth for the foreign-born population - South Africa (%)
Place of birth for the foreign-born population - Other Southern Africa (%)
Place of birth for the foreign-born population - Cabo Verde (%)
Place of birth for the foreign-born population - Ghana (%)
Place of birth for the foreign-born population - Liberia (%)
Place of birth for the foreign-born population - Nigeria (%)
Place of birth for the foreign-born population - Senegal (%)
Place of birth for the foreign-born population - Sierra Leone (%)
Place of birth for the foreign-born population - Other Western Africa (%)
Place of birth for the foreign-born population - Australia (%)
Place of birth for the foreign-born population - New Zealand (%)
Place of birth for the foreign-born population - Fiji (%)
Place of birth for the foreign-born population - Micronesia (%)
Place of birth for the foreign-born population - Bahamas (%)
Place of birth for the foreign-born population - Barbados (%)
Place of birth for the foreign-born population - Cuba (%)
Place of birth for the foreign-born population - Dominica (%)
Place of birth for the foreign-born population - Dominican Republic (%)
Place of birth for the foreign-born population - Grenada (%)
Place of birth for the foreign-born population - Haiti (%)
Place of birth for the foreign-born population - Jamaica (%)
Place of birth for the foreign-born population - St. Vincent and the Grenadines (%)
Place of birth for the foreign-born population - Trinidad and Tobago (%)
Place of birth for the foreign-born population - West Indies (%)
Place of birth for the foreign-born population - Other Caribbean (%)
Place of birth for the foreign-born population - Belize (%)
Place of birth for the foreign-born population - Costa Rica (%)
Place of birth for the foreign-born population - El Salvador (%)
Place of birth for the foreign-born population - Guatemala (%)
Place of birth for the foreign-born population - Honduras (%)
Place of birth for the foreign-born population - Mexico (%)
Place of birth for the foreign-born population - Nicaragua (%)
Place of birth for the foreign-born population - Panama (%)
Place of birth for the foreign-born population - Other Central America (%)
Place of birth for the foreign-born population - Argentina (%)
Place of birth for the foreign-born population - Bolivia (%)
Place of birth for the foreign-born population - Brazil (%)
Place of birth for the foreign-born population - Chile (%)
Place of birth for the foreign-born population - Colombia (%)
Place of birth for the foreign-born population - Ecuador (%)
Place of birth for the foreign-born population - Guyana (%)
Place of birth for the foreign-born population - Peru (%)
Place of birth for the foreign-born population - Uruguay (%)
Place of birth for the foreign-born population - Venezuela (%)
Place of birth for the foreign-born population - Other South America (%)
Place of birth for the foreign-born population - Canada (%)
Place of birth for the foreign-born population - Other Northern America (%)
Place of birth for the foreign-born population - Other (%)
Latest news about races in Bridgeton, NJ collected exclusively by city-data.com from local newspapers, TV, and radio stations
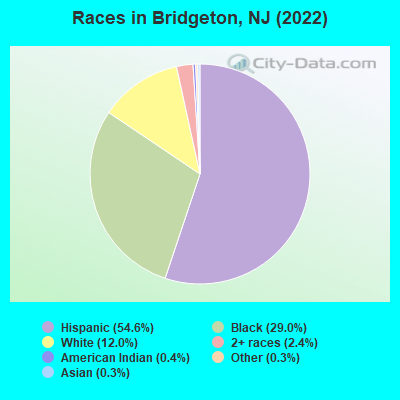
According to 2022 data, the most numerous races in Bridgeton, NJ are White alone (3,186 residents), Hispanic (14,466 residents), and Black alone (7,692 residents). 50.9% of Bridgeton residents speak English at home. 22.4% of Bridgeton, NJ residents are foreign-born (21.1% born in Latin America), which is 2.5% less than the foreign-born rate of 23.0% across the entire state of New Jersey.
Race distribution in Bridgeton
2000 2022
5,557,209 66.0% White alone 1,117,191 13.3% Hispanic 1,096,171 13.0% Black alone 477,012 5.7% Asian alone 133,689 1.6% Two or more races 19,565 0.2% Other race alone 11,338 0.1% American Indian alone 2,175 0.03% Native Hawaiian and Other
4,766,476 51.5% White alone 2,028,470 21.9% Hispanic 1,111,632 12.0% Black alone 923,546 10.0% Asian alone 332,237 3.6% Two or more races 89,847 1.0% Other race alone 8,557 0.09% American Indian alone 934 0.01% Native Hawaiian and Other
Income and house value in Bridgeton Median household income in 2022 $48,458 White non-Hispanic householders$41,132 Black householders$34,485 American Indian and Alaska Native householders$34,724 Asian householders$36,479 Some other race householders$58,950 Two or more races householders$53,460 Hispanic or Latino race householdersMedian 2022 house value $147,041 White Non-Hispanic householders$110,861 Black or African American householders $237,780 Asian householders$118,987 Some other race householders$125,758 Two or more races householders$112,796 Hispanic or Latino householders
Median age by race in Bridgeton
37.2 Median age for White residents36.6 37.0 33.6 Median age for Black or African American residents35.1 30.7 43.4 Median age for American Indian / Alaska Native residents33.2 42.3 52.9 Median age for Asian residents66.8 40.9 -804,177,544.9 Median age for Native Hawaiian / Pacific Islander residents-666,666,666.0 -666,666,666.0 26.4 Median age for Other race residents30.9 17.0 19.9 Median age for Two or more races residents22.0 20.7 50.5 Median age for White alone residents47.2 51.6 22.6 Median age for Hispanic or Latino residents26.7 18.5
Owner/renter occupied households by race in Bridgeton
House owners and renters - White residents 1,235 49.3% Owner occupied1,271 50.7% Renter occupiedHouse owners and renters - Black or African American residents 898 49.8% Owner occupied904 50.2% Renter occupiedHouse owners and renters - American Indian / Alaska Native residents 38 12.9% Owner occupied259 87.1% Renter occupiedHouse owners and renters - Asian residents 30 67.5% Owner occupied15 32.5% Renter occupiedHouse owners and renters - Other race residents 422 39.0% Owner occupied659 61.0% Renter occupiedHouse owners and renters - Two or more races residents 362 18.4% Owner occupied1,602 81.6% Renter occupiedHouse owners and renters - White alone residents 944 60.1% Owner occupied626 39.9% Renter occupiedHouse owners and renters - Hispanic or Latino residents 977 31.0% Owner occupied2,172 69.0% Renter occupied
Language usage in Bridgeton
English speakers - Total 50.9% of residents of Bridgeton speak English at home.
49.0% of residents speak Spanish at home 4,429 37.2% Speak English very well7,476 62.8% Speak English less than very well1.9% of residents speak other language at home 259 56.8% Speak English very well197 43.2% Speak English less than very well
English speakers - Born in the United States 65.3% of residents of Bridgeton speak English at home.
38.3% of residents speak Spanish at home 882 72.1% Speak English very well341 27.9% Speak English less than very well2.2% of residents speak other language at home 71 100.0% Speak English very well
English speakers - Native, born elsewhere 10.1% of residents of Bridgeton speak English at home.
85.2% of residents speak Spanish at home 327 31.3% Speak English very well719 68.7% Speak English less than very well1.6% of residents speak other language at home 20 100.0% Speak English less than very well
English speakers - Foreign-born 11.9% of residents of Bridgeton speak English at home.
77.1% of residents speak Spanish at home 437 9.1% Speak English very well4,387 90.9% Speak English less than very well3.6% of residents speak other language at home 56 24.9% Speak English very well169 75.1% Speak English less than very well
White (Caucasian) - Speak only English Native:
62.1% (3,112)Foreign-born:
8.4% (86)
White (Caucasian) - Speak another language Native:
22.8% (1,143)Foreign-born:
84.8% (873)
Black or African American - Speak only English Native:
99.0% (6,619)Foreign-born:
77.3% (340)
Black or African American - Speak another language Native:
3.6% (242)Foreign-born:
22.2% (98)
American Indian / Alaska Native - Speak another language Native:
41.8% (126)Foreign-born:
97.6% (91)
Asian - Speak another language Native:
61.9% (26)Foreign-born:
100.0% (36)
Other race - Speak only English Native:
21.3% (647)Foreign-born:
10.5% (156)
Other race - Speak another language Native:
78.2% (2,378)Foreign-born:
89.5% (1,328)
Two or more races - Speak only English Native:
21.5% (853)Foreign-born:
5.4% (206)
Two or more races - Speak another language Native:
83.8% (3,324)Foreign-born:
89.1% (3,422)
White alone - Speak only English Native:
95.4% (2,892)Foreign-born:
48.3% (45)
White alone - Speak another language Native:
4.4% (134)Foreign-born:
48.3% (45)
Hispanic or Latino - Speak only English Native:
15.1% (1,166)Foreign-born:
3.5% (181)
Hispanic or Latino - Speak another language Native:
84.4% (6,538)Foreign-born:
97.0% (4,950)
Foreign-born residents in Bridgeton 5,948 residents are foreign born (21.1% Latin America ).
This city:
22.4%New Jersey:
23.2%
Marital status for residents in Bridgeton Marital status - White (Caucasian) population 15 years and over
Males 63.5% Never married26.0% Now married0.3% Separated1.3% Widowed8.9% DivorcedFemales 44.4% Never married26.6% Now married3.7% Separated11.8% Widowed13.6% DivorcedWomen who gave birth in the past 12 months Now married:
19.2% (15)Unmarried:
80.8% (64)
Women who did not give birth in the past 12 months Now married:
36.4% (466)Unmarried:
63.6% (813)
Marital status - Black or African American population 15 years and over
Males 76.1% Never married13.3% Now married1.7% Separated2.3% Widowed6.5% DivorcedFemales 66.0% Never married18.6% Now married1.6% Separated4.1% Widowed9.8% DivorcedWomen who gave birth in the past 12 months Now married:
49.4% (134)Unmarried:
50.6% (137)
Women who did not give birth in the past 12 months Now married:
15.2% (235)Unmarried:
84.8% (1,310)
Marital status - American Indian / Alaska Native population 15 years and over
Males 70.6% Never married29.4% Now married0.0% Separated0.0% Widowed0.0% DivorcedFemales 51.3% Never married14.1% Now married0.0% Separated11.5% Widowed23.0% DivorcedWomen who did not give birth in the past 12 months Now married:
19.3% (32)Unmarried:
80.7% (136)
Marital status - Asian population 15 years and over
Males 30.4% Never married26.1% Now married0.0% Separated0.0% Widowed43.5% DivorcedFemales 35.1% Never married21.6% Now married0.0% Separated18.9% Widowed24.3% DivorcedWomen who did not give birth in the past 12 months Now married:
61.5% (8)Unmarried:
38.5% (5)
Marital status - Other race population 15 years and over
Males 69.0% Never married18.3% Now married5.2% Separated1.5% Widowed6.0% DivorcedFemales 65.0% Never married27.4% Now married2.5% Separated0.8% Widowed4.2% DivorcedWomen who gave birth in the past 12 months Now married:
25.2% (49)Unmarried:
74.8% (146)
Women who did not give birth in the past 12 months Now married:
33.7% (294)Unmarried:
66.3% (578)
Marital status - Two or more races population 15 years and over
Males 61.0% Never married35.1% Now married0.7% Separated0.0% Widowed3.3% DivorcedFemales 60.4% Never married29.6% Now married5.3% Separated2.4% Widowed2.4% DivorcedWomen who gave birth in the past 12 months Now married:
10.0% (6)Unmarried:
90.0% (51)
Women who did not give birth in the past 12 months Now married:
31.6% (701)Unmarried:
68.4% (1,516)
Marital status - White alone, not Hispanic / Latino population 15 years and over
Males 54.4% Never married25.5% Now married0.2% Separated2.7% Widowed17.3% DivorcedFemales 24.4% Never married34.5% Now married1.2% Separated18.5% Widowed21.4% DivorcedWomen who did not give birth in the past 12 months Now married:
52.8% (298)Unmarried:
47.2% (266)
Marital status - Hispanic or Latino population 15 years and over
Males 66.4% Never married28.4% Now married1.7% Separated0.4% Widowed3.1% DivorcedFemales 60.8% Never married26.1% Now married5.0% Separated3.0% Widowed5.1% DivorcedWomen who gave birth in the past 12 months Now married:
23.9% (58)Unmarried:
76.1% (183)
Women who did not give birth in the past 12 months Now married:
31.5% (1,007)Unmarried:
68.5% (2,190)
Ancestries in Bridgeton
346 1.7% American324 1.6% Italian259 1.3% Jamaican197 1.0% Haitian158 0.8% German147 0.7% English113 0.6% Irish67 0.3% Polish32 0.2% Guyanese29 0.1% African28 0.1% Russian21 0.1% Arab18 0.09% European15 0.07% West Indian9 0.04% Pennsylvania German8 0.04% Israeli8 0.04% Yugoslavian6 0.03% French6 0.03% Hungarian5 0.02% Liberian5 0.02% Ukrainian4 0.02% Scotch-Irish
Geographical mobility in Bridgeton Same house 1 year ago 6,065 89.9% White (Caucasian)6,800 89.4% Black or African American423 94.4% American Indian / Alaska Native64 83.6% Asian3,952 78.4% Other race8,136 97.5% Two or more races2,900 92.4% White alone, not Hispanic / Latino12,255 86.3% Hispanic or LatinoMoved within same county 354 5.2% White / Caucasian185 2.4% Black or African American137 2.7% Other race143 1.7% Two or more races38 1.2% White alone, not Hispanic / Latino1,136 8.0% Hispanic or LatinoMoved within same state 213 3.2% White / Caucasian731 9.6% Black or African American14 3.1% American Indian / Alaska Native6 8.2% Asian105 2.1% Other race68 0.8% Two or more races196 6.3% White alone, not Hispanic / Latino155 1.1% Hispanic or LatinoMoved from different state 50 0.7% White / Caucasian174 2.3% Black or African American6 8.4% Asian225 4.5% Other race6 0.1% Two or more races38 1.2% White alone, not Hispanic / Latino211 1.5% Hispanic or LatinoMoved from abroad 11 0.2% White13 0.2% Black or African American55 1.1% Other race62 0.4% Hispanic or Latino
Children Nativity (place of birth) in Bridgeton
Children under 6 years - Living with two parents Both parents native 517 100.0% NativeBoth parents foreign-born 180 92.8% Native14 7.2% Foreign-bornOne native, one foreign-born parent 238 100.0% NativeChildren under 6 years - Living with one parent Native parent 699 100.0% NativeForeign-born parent 587 98.7% Native8 1.3% Foreign-bornChildren 6 to 17 years - Living with two parents Both parents native 118 100.0% NativeBoth parents foreign-born 1,356 99.9% Native1 0.1% Foreign-bornOne native, one foreign-born parent 289 86.8% Native44 13.2% Foreign-bornChildren 6 to 17 years - Living with one parent Native parent 1,949 100.0% NativeForeign-born parent 1,339 54.3% Native1,126 45.7% Foreign-born
Grandparents responsible for own grandchildren in Bridgeton
Grandparents (30 to 59 years) White / Caucasian 12 21.0% Responsible for grandchildren45 79.0% Not responsible for grandchildrenBlack or African American 15 19.5% Responsible for grandchildren62 80.5% Not responsible for grandchildrenOther race 8 100.0% Responsible for grandchildrenTwo or more races 46 100.0% Not responsible for grandchildrenWhite alone, not Hispanic / Latino 7 31.4% Responsible for grandchildren15 68.6% Not responsible for grandchildrenHispanic or Latino 18 20.3% Responsible for grandchildren70 79.7% Not responsible for grandchildrenGrandparents (60 years and over) White / Caucasian 6 20.3% Responsible for grandchildren23 79.7% Not responsible for grandchildrenBlack or African American 34 34.7% Responsible for grandchildren64 65.3% Not responsible for grandchildrenOther race 2 6.0% Responsible for grandchildren31 94.0% Not responsible for grandchildrenTwo or more races 32 100.0% Not responsible for grandchildrenWhite alone, not Hispanic / Latino 1 4.3% Responsible for grandchildren22 95.7% Not responsible for grandchildrenHispanic or Latino 6 9.5% Responsible for grandchildren54 90.5% Not responsible for grandchildren