Races in Bristol, Virginia (VA) Detailed Stats
Data:
Races - White alone (%)
Races - White alone (% change since 2000)
Races - Black alone (%)
Races - Black alone (% change since 2000)
Races - American Indian alone (%)
Races - American Indian alone (% change since 2000)
Races - Asian alone (%)
Races - Asian alone (% change since 2000)
Races - Hispanic (%)
Races - Hispanic (% change since 2000)
Races - Native Hawaiian and Other Pacific Islander alone (%)
Races - Native Hawaiian and Other Pacific Islander alone (% change since 2000)
Races - Two or more races(%)
Races - Two or more races(% change since 2000)
Races - Other race alone (%)
Races - Other race alone (% change since 2000)
Racial diversity
Place of birth - Born in state of residence (%)
Place of birth - Born in state of residence (%) - White
Place of birth - Born in state of residence (%) - Black or African American
Place of birth - Born in state of residence (%) - Asian
Place of birth - Born in state of residence (%) - Hispanic or Latino
Place of birth - Born in state of residence (%) - American Indian and Alaska Native
Place of birth - Born in state of residence (%) - Multirace
Place of birth - Born in state of residence (%) - Other Race
Place of birth - Born in other state (%)
Place of birth - Born in other state (%) - White
Place of birth - Born in other state (%) - Black or African American
Place of birth - Born in other state (%) - Asian
Place of birth - Born in other state (%) - Hispanic or Latino
Place of birth - Born in other state (%) - American Indian and Alaska Native
Place of birth - Born in other state (%) - Multirace
Place of birth - Born in other state (%) - Other Race
Place of birth - Native, outside of US (%)
Place of birth - Native, outside of US (%) - White
Place of birth - Native, outside of US (%) - Black or African American
Place of birth - Native, outside of US (%) - Asian
Place of birth - Native, outside of US (%) - Hispanic or Latino
Place of birth - Native, outside of US (%) - American Indian and Alaska Native
Place of birth - Native, outside of US (%) - Multirace
Place of birth - Native, outside of US (%) - Other Race
Place of birth - Foreign born (%)
Place of birth - Foreign born (%) - White
Place of birth - Foreign born (%) - Black or African American
Place of birth - Foreign born (%) - Asian
Place of birth - Foreign born (%) - Hispanic or Latino
Place of birth - Foreign born (%) - American Indian and Alaska Native
Place of birth - Foreign born (%) - Multirace
Place of birth - Foreign born (%) - Other Race
Residents speaking English at home (%)
Residents speaking English at home - Born in the United States (%)
Residents speaking English at home - Native, born elsewhere (%)
Residents speaking English at home - Foreign born (%)
Residents speaking Spanish at home (%)
Residents speaking Spanish at home - Born in the United States (%)
Residents speaking Spanish at home - Native, born elsewhere (%)
Residents speaking Spanish at home - Foreign born (%)
Residents speaking other language at home (%)
Residents speaking other language at home - Born in the United States (%)
Residents speaking other language at home - Native, born elsewhere (%)
Residents speaking other language at home - Foreign born (%)
Marital status - Never married (%)
Marital status - Now married (%)
Marital status - Separated (%)
Marital status - Widowed (%)
Marital status - Divorced (%)
Ancestries Reported - Arab (%)
Ancestries Reported - Czech (%)
Ancestries Reported - Danish (%)
Ancestries Reported - Dutch (%)
Ancestries Reported - English (%)
Ancestries Reported - French (%)
Ancestries Reported - French Canadian (%)
Ancestries Reported - German (%)
Ancestries Reported - Greek (%)
Ancestries Reported - Hungarian (%)
Ancestries Reported - Irish (%)
Ancestries Reported - Italian (%)
Ancestries Reported - Lithuanian (%)
Ancestries Reported - Norwegian (%)
Ancestries Reported - Polish (%)
Ancestries Reported - Portuguese (%)
Ancestries Reported - Russian (%)
Ancestries Reported - Scotch-Irish (%)
Ancestries Reported - Scottish (%)
Ancestries Reported - Slovak (%)
Ancestries Reported - Subsaharan African (%)
Ancestries Reported - Swedish (%)
Ancestries Reported - Swiss (%)
Ancestries Reported - Ukrainian (%)
Ancestries Reported - United States (%)
Ancestries Reported - Welsh (%)
Ancestries Reported - West Indian (%)
Ancestries Reported - Other (%)
Geographical mobility - Same house 1 year ago (%)
Geographical mobility - Same house 1 year ago (%) - White
Geographical mobility - Same house 1 year ago (%) - Black or African American
Geographical mobility - Same house 1 year ago (%) - Asian
Geographical mobility - Same house 1 year ago (%) - Hispanic or Latino
Geographical mobility - Same house 1 year ago (%) - American Indian and Alaska Native
Geographical mobility - Same house 1 year ago (%) - Multirace
Geographical mobility - Same house 1 year ago (%) - Other Race
Geographical mobility - Moved within same county (%)
Geographical mobility - Moved within same county (%) - White
Geographical mobility - Moved within same county (%) - Black or African American
Geographical mobility - Moved within same county (%) - Asian
Geographical mobility - Moved within same county (%) - Hispanic or Latino
Geographical mobility - Moved within same county (%) - American Indian and Alaska Native
Geographical mobility - Moved within same county (%) - Multirace
Geographical mobility - Moved within same county (%) - Other Race
Geographical mobility - Moved from different county within same state (%)
Geographical mobility - Moved from different county within same state (%) - White
Geographical mobility - Moved from different county within same state (%) - Black or African American
Geographical mobility - Moved from different county within same state (%) - Asian
Geographical mobility - Moved from different county within same state (%) - Hispanic or Latino
Geographical mobility - Moved from different county within same state (%) - American Indian and Alaska Native
Geographical mobility - Moved from different county within same state (%) - Multirace
Geographical mobility - Moved from different county within same state (%) - Other Race
Geographical mobility - Moved from different state (%)
Geographical mobility - Moved from different state (%) - White
Geographical mobility - Moved from different state (%) - Black or African American
Geographical mobility - Moved from different state (%) - Asian
Geographical mobility - Moved from different state (%) - Hispanic or Latino
Geographical mobility - Moved from different state (%) - American Indian and Alaska Native
Geographical mobility - Moved from different state (%) - Multirace
Geographical mobility - Moved from different state (%) - Other Race
Geographical mobility - Moved from abroad (%)
Geographical mobility - Moved from abroad (%) - White
Geographical mobility - Moved from abroad (%) - Black or African American
Geographical mobility - Moved from abroad (%) - Asian
Geographical mobility - Moved from abroad (%) - Hispanic or Latino
Geographical mobility - Moved from abroad (%) - American Indian and Alaska Native
Geographical mobility - Moved from abroad (%) - Multirace
Geographical mobility - Moved from abroad (%) - Other Race
Place of birth for the foreign-born population - Ireland (%)
Place of birth for the foreign-born population - Denmark (%)
Place of birth for the foreign-born population - Norway (%)
Place of birth for the foreign-born population - Sweden (%)
Place of birth for the foreign-born population - United Kingdom (%)
Place of birth for the foreign-born population - England (%)
Place of birth for the foreign-born population - Scotland (%)
Place of birth for the foreign-born population - Other Northern Europe (%)
Place of birth for the foreign-born population - Austria (%)
Place of birth for the foreign-born population - Belgium (%)
Place of birth for the foreign-born population - France (%)
Place of birth for the foreign-born population - Germany (%)
Place of birth for the foreign-born population - Netherlands (%)
Place of birth for the foreign-born population - Switzerland (%)
Place of birth for the foreign-born population - Other Western Europe (%)
Place of birth for the foreign-born population - Greece (%)
Place of birth for the foreign-born population - Italy (%)
Place of birth for the foreign-born population - Portugal (%)
Place of birth for the foreign-born population - Spain (%)
Place of birth for the foreign-born population - Other Southern Europe (%)
Place of birth for the foreign-born population - Albania (%)
Place of birth for the foreign-born population - Belarus (%)
Place of birth for the foreign-born population - Bosnia and Herzegovina (%)
Place of birth for the foreign-born population - Bulgaria (%)
Place of birth for the foreign-born population - Croatia (%)
Place of birth for the foreign-born population - Czechoslovakia (%)
Place of birth for the foreign-born population - Hungary (%)
Place of birth for the foreign-born population - Latvia (%)
Place of birth for the foreign-born population - Lithuania (%)
Place of birth for the foreign-born population - North Macedonia (Macedonia) (%)
Place of birth for the foreign-born population - Moldova (%)
Place of birth for the foreign-born population - Poland (%)
Place of birth for the foreign-born population - Romania (%)
Place of birth for the foreign-born population - Russia (%)
Place of birth for the foreign-born population - Serbia (%)
Place of birth for the foreign-born population - Ukraine (%)
Place of birth for the foreign-born population - Other Eastern Europe (%)
Place of birth for the foreign-born population - China (%)
Place of birth for the foreign-born population - Hong Kong (%)
Place of birth for the foreign-born population - Taiwan (%)
Place of birth for the foreign-born population - Japan (%)
Place of birth for the foreign-born population - Korea (%)
Place of birth for the foreign-born population - Other Eastern Asia (%)
Place of birth for the foreign-born population - Afghanistan (%)
Place of birth for the foreign-born population - Bangladesh (%)
Place of birth for the foreign-born population - India (%)
Place of birth for the foreign-born population - Iran (%)
Place of birth for the foreign-born population - Kazakhstan (%)
Place of birth for the foreign-born population - Nepal (%)
Place of birth for the foreign-born population - Pakistan (%)
Place of birth for the foreign-born population - Sri Lanka (%)
Place of birth for the foreign-born population - Uzbekistan (%)
Place of birth for the foreign-born population - Other South Central Asia (%)
Place of birth for the foreign-born population - Burma (%)
Place of birth for the foreign-born population - Cambodia (%)
Place of birth for the foreign-born population - Indonesia (%)
Place of birth for the foreign-born population - Laos (%)
Place of birth for the foreign-born population - Malaysia (%)
Place of birth for the foreign-born population - Philippines (%)
Place of birth for the foreign-born population - Singapore (%)
Place of birth for the foreign-born population - Thailand (%)
Place of birth for the foreign-born population - Vietnam (%)
Place of birth for the foreign-born population - Other South Eastern Asia (%)
Place of birth for the foreign-born population - Armenia (%)
Place of birth for the foreign-born population - Iraq (%)
Place of birth for the foreign-born population - Israel (%)
Place of birth for the foreign-born population - Jordan (%)
Place of birth for the foreign-born population - Kuwait (%)
Place of birth for the foreign-born population - Lebanon (%)
Place of birth for the foreign-born population - Saudi Arabia (%)
Place of birth for the foreign-born population - Syria (%)
Place of birth for the foreign-born population - Turkey (%)
Place of birth for the foreign-born population - Yemen (%)
Place of birth for the foreign-born population - Other Western Asia (%)
Place of birth for the foreign-born population - Eritrea (%)
Place of birth for the foreign-born population - Ethiopia (%)
Place of birth for the foreign-born population - Kenya (%)
Place of birth for the foreign-born population - Somalia (%)
Place of birth for the foreign-born population - Uganda (%)
Place of birth for the foreign-born population - Zimbabwe (%)
Place of birth for the foreign-born population - Other Eastern Africa (%)
Place of birth for the foreign-born population - Cameroon (%)
Place of birth for the foreign-born population - Congo (%)
Place of birth for the foreign-born population - Democratic Republic of Congo (Zaire) (%)
Place of birth for the foreign-born population - Other Middle Africa (%)
Place of birth for the foreign-born population - Egypt (%)
Place of birth for the foreign-born population - Morocco (%)
Place of birth for the foreign-born population - Sudan (%)
Place of birth for the foreign-born population - Other Northern Africa (%)
Place of birth for the foreign-born population - South Africa (%)
Place of birth for the foreign-born population - Other Southern Africa (%)
Place of birth for the foreign-born population - Cabo Verde (%)
Place of birth for the foreign-born population - Ghana (%)
Place of birth for the foreign-born population - Liberia (%)
Place of birth for the foreign-born population - Nigeria (%)
Place of birth for the foreign-born population - Senegal (%)
Place of birth for the foreign-born population - Sierra Leone (%)
Place of birth for the foreign-born population - Other Western Africa (%)
Place of birth for the foreign-born population - Australia (%)
Place of birth for the foreign-born population - New Zealand (%)
Place of birth for the foreign-born population - Fiji (%)
Place of birth for the foreign-born population - Micronesia (%)
Place of birth for the foreign-born population - Bahamas (%)
Place of birth for the foreign-born population - Barbados (%)
Place of birth for the foreign-born population - Cuba (%)
Place of birth for the foreign-born population - Dominica (%)
Place of birth for the foreign-born population - Dominican Republic (%)
Place of birth for the foreign-born population - Grenada (%)
Place of birth for the foreign-born population - Haiti (%)
Place of birth for the foreign-born population - Jamaica (%)
Place of birth for the foreign-born population - St. Vincent and the Grenadines (%)
Place of birth for the foreign-born population - Trinidad and Tobago (%)
Place of birth for the foreign-born population - West Indies (%)
Place of birth for the foreign-born population - Other Caribbean (%)
Place of birth for the foreign-born population - Belize (%)
Place of birth for the foreign-born population - Costa Rica (%)
Place of birth for the foreign-born population - El Salvador (%)
Place of birth for the foreign-born population - Guatemala (%)
Place of birth for the foreign-born population - Honduras (%)
Place of birth for the foreign-born population - Mexico (%)
Place of birth for the foreign-born population - Nicaragua (%)
Place of birth for the foreign-born population - Panama (%)
Place of birth for the foreign-born population - Other Central America (%)
Place of birth for the foreign-born population - Argentina (%)
Place of birth for the foreign-born population - Bolivia (%)
Place of birth for the foreign-born population - Brazil (%)
Place of birth for the foreign-born population - Chile (%)
Place of birth for the foreign-born population - Colombia (%)
Place of birth for the foreign-born population - Ecuador (%)
Place of birth for the foreign-born population - Guyana (%)
Place of birth for the foreign-born population - Peru (%)
Place of birth for the foreign-born population - Uruguay (%)
Place of birth for the foreign-born population - Venezuela (%)
Place of birth for the foreign-born population - Other South America (%)
Place of birth for the foreign-born population - Canada (%)
Place of birth for the foreign-born population - Other Northern America (%)
Place of birth for the foreign-born population - Other (%)
Latest news about races in Bristol, VA collected exclusively by city-data.com from local newspapers, TV, and radio stations
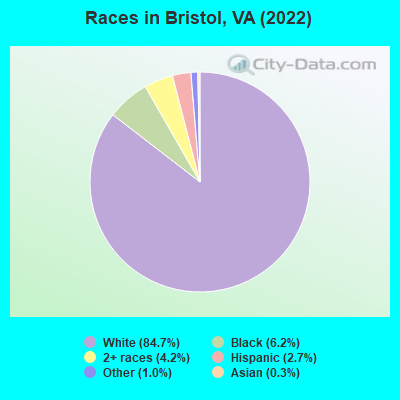
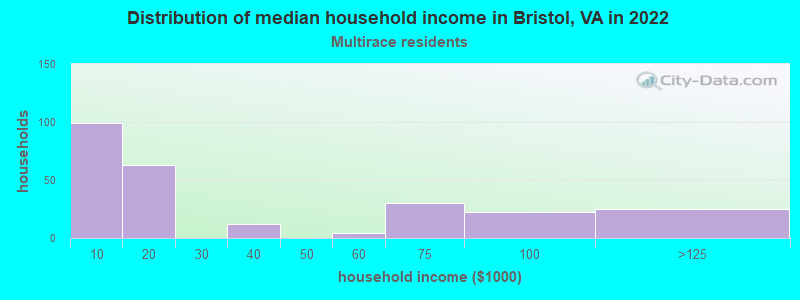
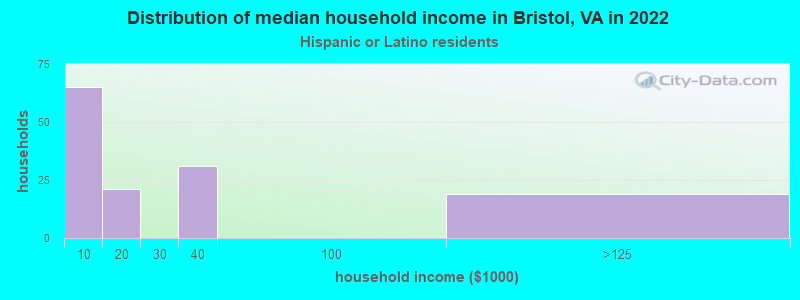
According to 2022 data, the most numerous races in Bristol, VA are White alone (14,534 residents), Black alone (1,061 residents), and Hispanic (465 residents). 96.9% of Bristol residents speak English at home. 1.2% of Bristol, VA residents are foreign-born , which is 889.6% less than the foreign-born rate of 12.0% across the entire state of Virginia.
Race distribution in Bristol
2000 2022
4,965,637 70.2% White alone 1,376,378 19.4% Black alone 329,540 4.7% Hispanic 259,277 3.7% Asian alone 114,022 1.6% Two or more races 18,596 0.3% American Indian alone 11,685 0.2% Other race alone 3,380 0.05% Native Hawaiian and Other
5,095,130 58.7% White alone 1,594,785 18.4% Black alone 905,750 10.4% Hispanic 602,881 6.9% Asian alone 406,047 4.7% Two or more races 60,419 0.7% Other race alone 11,738 0.1% American Indian alone 6,869 0.08% Native Hawaiian and Other
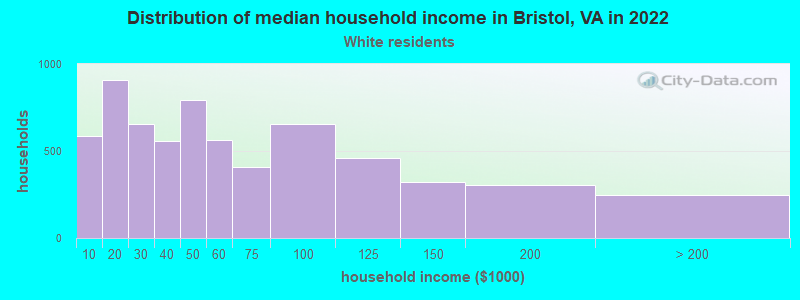
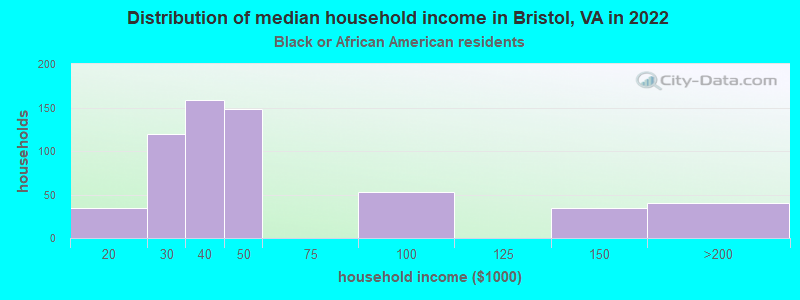
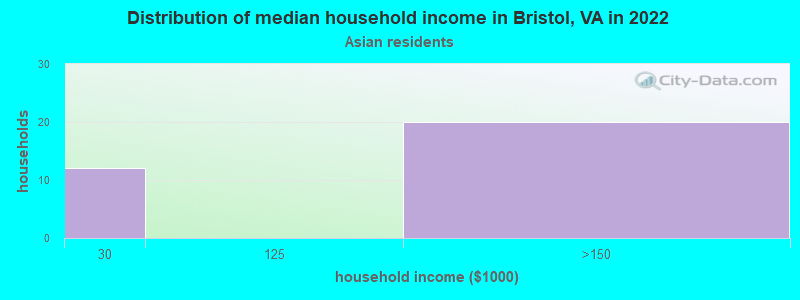
Income and house value in Bristol Median household income in 2022 $45,926 White non-Hispanic householders$39,499 Black householdersMedian 2022 house value $173,672 White Non-Hispanic householders$125,390 Black or African American householders$228,200 American Indian or Alaska Native householders $254,143 Asian householders$202,738 Some other race householders$54,047 Two or more races householders$260,148 Hispanic or Latino householders
Median age by race in Bristol
47.1 Median age for White residents45.3 48.4 35.2 Median age for Black or African American residents34.9 44.2 -682,215,742.8 Median age for American Indian / Alaska Native residents-682,352,940.5 -687,861,271.0 53.1 Median age for Asian residents-681,198,909.4 40.4 -611,955,419.9 Median age for Native Hawaiian / Pacific Islander residents-541,531,822.5 -714,150,046.8 39.3 Median age for Other race residents41.5 -687,285,222.7 19.7 Median age for Two or more races residents16.5 23.7 46.3 Median age for White alone residents44.6 47.8 30.7 Median age for Hispanic or Latino residents26.0 60.5
Owner/renter occupied households by race in Bristol
House owners and renters - White residents 4,138 65.4% Owner occupied2,185 34.6% Renter occupiedHouse owners and renters - Black or African American residents 345 55.8% Owner occupied274 44.2% Renter occupiedHouse owners and renters - Asian residents 32 100.0% Owner occupiedHouse owners and renters - Native Hawaiian / Pacific Islander residents 1 100.0% Renter occupiedHouse owners and renters - Other race residents 79 100.0% Renter occupiedHouse owners and renters - Two or more races residents 149 56.7% Owner occupied114 43.3% Renter occupiedHouse owners and renters - White alone residents 4,189 65.2% Owner occupied2,239 34.8% Renter occupiedHouse owners and renters - Hispanic or Latino residents 30 23.9% Owner occupied97 76.1% Renter occupied
Language usage in Bristol
English speakers - Total 96.9% of residents of Bristol speak English at home.
1.8% of residents speak Spanish at home 199 66.1% Speak English very well102 33.9% Speak English less than very well0.9% of residents speak other language at home 123 86.6% Speak English very well19 13.4% Speak English less than very well
English speakers - Born in the United States 97.7% of residents of Bristol speak English at home.
0.8% of residents speak Spanish at home 74 100.0% Speak English very well1.1% of residents speak other language at home 99 100.0% Speak English very well
English speakers - Native, born elsewhere 96.9% of residents of Bristol speak English at home.
English speakers - Foreign-born 21.5% of residents of Bristol speak English at home.
54.1% of residents speak Spanish at home 33 29.2% Speak English very well80 70.8% Speak English less than very well22.0% of residents speak other language at home 27 58.7% Speak English very well19 41.3% Speak English less than very well
White (Caucasian) - Speak another language Native:
0.6% (78)Foreign-born:
93.3% (40)
Black or African American - Speak only English Native:
95.3% (931)Foreign-born:
4.5% (1)
Black or African American - Speak another language Native:
4.8% (47)Foreign-born:
99.3% (21)
Asian - Speak only English Native:
92.4% (19)Foreign-born:
100.0% (32)
Other race - Speak another language Native:
20.8% (44)Foreign-born:
98.4% (22)
Two or more races - Speak only English Native:
84.5% (796)Foreign-born:
17.7% (19)
Two or more races - Speak another language Native:
14.7% (138)Foreign-born:
81.9% (90)
White alone - Speak another language Native:
0.6% (80)Foreign-born:
100.0% (31)
Hispanic or Latino - Speak only English Native:
46.5% (137)Foreign-born:
12.2% (15)
Hispanic or Latino - Speak another language Native:
53.3% (157)Foreign-born:
88.1% (106)
Foreign-born residents in Bristol 208 residents are foreign born
This city:
1.2%Virginia:
12.6%
Marital status for residents in Bristol Marital status - White (Caucasian) population 15 years and over
Males 33.3% Never married43.9% Now married2.9% Separated2.6% Widowed17.3% DivorcedFemales 26.8% Never married43.7% Now married1.8% Separated13.7% Widowed13.9% DivorcedWomen who gave birth in the past 12 months Now married:
35.9% (70)Unmarried:
64.1% (126)
Women who did not give birth in the past 12 months Now married:
42.4% (1,162)Unmarried:
57.6% (1,577)
Marital status - Black or African American population 15 years and over
Males 49.5% Never married10.4% Now married0.0% Separated8.3% Widowed31.7% DivorcedFemales 49.5% Never married17.1% Now married0.0% Separated0.3% Widowed33.0% DivorcedWomen who did not give birth in the past 12 months Now married:
27.2% (52)Unmarried:
72.8% (140)
Marital status - Asian population 15 years and over
Males 0.0% Never married100.0% Now married0.0% Separated0.0% Widowed0.0% DivorcedFemales 0.0% Never married61.3% Now married0.0% Separated38.7% Widowed0.0% DivorcedWomen who did not give birth in the past 12 months Now married:
100.0% (20)Unmarried:
0.0% (0)
Marital status - Other race population 15 years and over
Males 0.0% Never married95.6% Now married0.0% Separated0.0% Widowed4.4% DivorcedFemales 0.0% Never married100.0% Now married0.0% Separated0.0% Widowed0.0% DivorcedWomen who did not give birth in the past 12 months Now married:
100.0% (66)Unmarried:
0.0% (0)
Marital status - Two or more races population 15 years and over
Males 63.5% Never married18.6% Now married0.0% Separated0.0% Widowed17.9% DivorcedFemales 37.9% Never married33.8% Now married0.0% Separated7.1% Widowed21.2% DivorcedWomen who did not give birth in the past 12 months Now married:
31.8% (68)Unmarried:
68.2% (146)
Marital status - White alone, not Hispanic / Latino population 15 years and over
Males 32.9% Never married44.1% Now married2.9% Separated2.7% Widowed17.4% DivorcedFemales 25.9% Never married44.3% Now married1.8% Separated13.9% Widowed14.1% DivorcedWomen who gave birth in the past 12 months Now married:
35.9% (73)Unmarried:
64.1% (131)
Women who did not give birth in the past 12 months Now married:
43.1% (1,207)Unmarried:
56.9% (1,594)
Marital status - Hispanic or Latino population 15 years and over
Males 62.3% Never married35.3% Now married0.0% Separated0.0% Widowed2.3% DivorcedFemales 55.4% Never married2.4% Now married0.0% Separated8.3% Widowed33.9% DivorcedWomen who did not give birth in the past 12 months Now married:
7.0% (4)Unmarried:
93.0% (56)
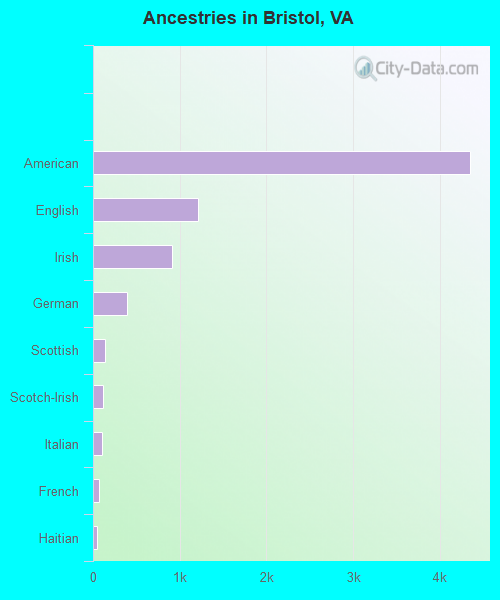
Ancestries in Bristol
4,350 43.6% American1,206 12.1% English916 9.2% Irish393 3.9% German139 1.4% Scottish115 1.2% Scotch-Irish101 1.0% Italian65 0.7% French44 0.4% Haitian37 0.4% Jamaican29 0.3% Egyptian29 0.3% Norwegian28 0.3% European27 0.3% Hungarian17 0.2% British16 0.2% French Canadian12 0.1% Russian9 0.09% Welsh8 0.08% African6 0.06% Portuguese6 0.06% Swedish5 0.05% Polish
Children Nativity (place of birth) in Bristol
Children under 6 years - Living with two parents Both parents native 431 100.0% NativeChildren under 6 years - Living with one parent Native parent 414 100.0% Native
Children 6 to 17 years - Living with two parents Both parents native 963 100.0% NativeOne native, one foreign-born parent 7 100.0% NativeChildren 6 to 17 years - Living with one parent Native parent 1,309 100.0% Native
Grandparents responsible for own grandchildren in Bristol
Grandparents (30 to 59 years) White / Caucasian 93 64.8% Responsible for grandchildren50 35.2% Not responsible for grandchildrenBlack or African American 28 100.0% Responsible for grandchildrenWhite alone, not Hispanic / Latino 94 62.7% Responsible for grandchildren56 37.3% Not responsible for grandchildrenGrandparents (60 years and over) White / Caucasian 96 89.9% Responsible for grandchildren11 10.1% Not responsible for grandchildrenBlack or African American 18 100.0% Not responsible for grandchildrenWhite alone, not Hispanic / Latino 97 89.5% Responsible for grandchildren11 10.5% Not responsible for grandchildren