Races in Brownfield, Texas (TX) Detailed Stats
Data:
Races - White alone (%)
Races - White alone (% change since 2000)
Races - Black alone (%)
Races - Black alone (% change since 2000)
Races - American Indian alone (%)
Races - American Indian alone (% change since 2000)
Races - Asian alone (%)
Races - Asian alone (% change since 2000)
Races - Hispanic (%)
Races - Hispanic (% change since 2000)
Races - Native Hawaiian and Other Pacific Islander alone (%)
Races - Native Hawaiian and Other Pacific Islander alone (% change since 2000)
Races - Two or more races(%)
Races - Two or more races(% change since 2000)
Races - Other race alone (%)
Races - Other race alone (% change since 2000)
Racial diversity
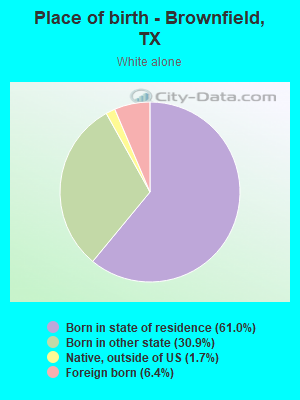
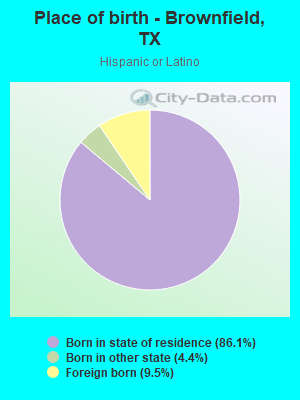
Place of birth - Born in state of residence (%)
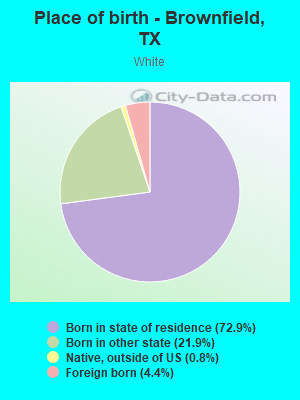
Place of birth - Born in state of residence (%) - White
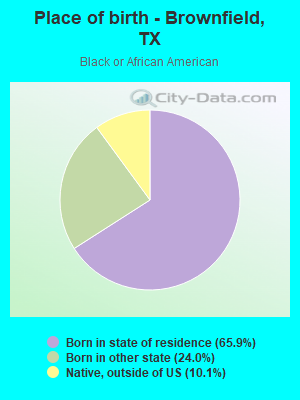
Place of birth - Born in state of residence (%) - Black or African American
Place of birth - Born in state of residence (%) - Asian
Place of birth - Born in state of residence (%) - Hispanic or Latino
Place of birth - Born in state of residence (%) - American Indian and Alaska Native
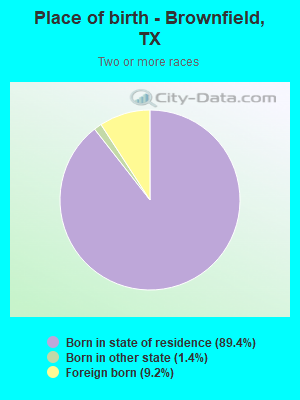
Place of birth - Born in state of residence (%) - Multirace
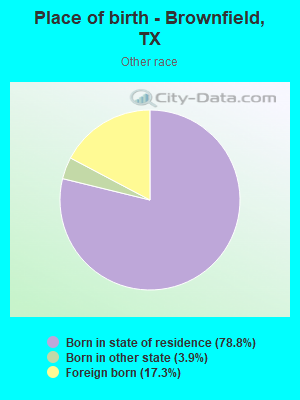
Place of birth - Born in state of residence (%) - Other Race
Place of birth - Born in other state (%)
Place of birth - Born in other state (%) - White
Place of birth - Born in other state (%) - Black or African American
Place of birth - Born in other state (%) - Asian
Place of birth - Born in other state (%) - Hispanic or Latino
Place of birth - Born in other state (%) - American Indian and Alaska Native
Place of birth - Born in other state (%) - Multirace
Place of birth - Born in other state (%) - Other Race
Place of birth - Native, outside of US (%)
Place of birth - Native, outside of US (%) - White
Place of birth - Native, outside of US (%) - Black or African American
Place of birth - Native, outside of US (%) - Asian
Place of birth - Native, outside of US (%) - Hispanic or Latino
Place of birth - Native, outside of US (%) - American Indian and Alaska Native
Place of birth - Native, outside of US (%) - Multirace
Place of birth - Native, outside of US (%) - Other Race
Place of birth - Foreign born (%)
Place of birth - Foreign born (%) - White
Place of birth - Foreign born (%) - Black or African American
Place of birth - Foreign born (%) - Asian
Place of birth - Foreign born (%) - Hispanic or Latino
Place of birth - Foreign born (%) - American Indian and Alaska Native
Place of birth - Foreign born (%) - Multirace
Place of birth - Foreign born (%) - Other Race
Residents speaking English at home (%)
Residents speaking English at home - Born in the United States (%)
Residents speaking English at home - Native, born elsewhere (%)
Residents speaking English at home - Foreign born (%)
Residents speaking Spanish at home (%)
Residents speaking Spanish at home - Born in the United States (%)
Residents speaking Spanish at home - Native, born elsewhere (%)
Residents speaking Spanish at home - Foreign born (%)
Residents speaking other language at home (%)
Residents speaking other language at home - Born in the United States (%)
Residents speaking other language at home - Native, born elsewhere (%)
Residents speaking other language at home - Foreign born (%)
Marital status - Never married (%)
Marital status - Now married (%)
Marital status - Separated (%)
Marital status - Widowed (%)
Marital status - Divorced (%)
Ancestries Reported - Arab (%)
Ancestries Reported - Czech (%)
Ancestries Reported - Danish (%)
Ancestries Reported - Dutch (%)
Ancestries Reported - English (%)
Ancestries Reported - French (%)
Ancestries Reported - French Canadian (%)
Ancestries Reported - German (%)
Ancestries Reported - Greek (%)
Ancestries Reported - Hungarian (%)
Ancestries Reported - Irish (%)
Ancestries Reported - Italian (%)
Ancestries Reported - Lithuanian (%)
Ancestries Reported - Norwegian (%)
Ancestries Reported - Polish (%)
Ancestries Reported - Portuguese (%)
Ancestries Reported - Russian (%)
Ancestries Reported - Scotch-Irish (%)
Ancestries Reported - Scottish (%)
Ancestries Reported - Slovak (%)
Ancestries Reported - Subsaharan African (%)
Ancestries Reported - Swedish (%)
Ancestries Reported - Swiss (%)
Ancestries Reported - Ukrainian (%)
Ancestries Reported - United States (%)
Ancestries Reported - Welsh (%)
Ancestries Reported - West Indian (%)
Ancestries Reported - Other (%)
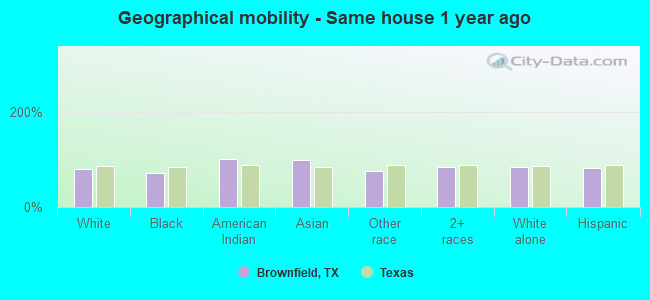
Geographical mobility - Same house 1 year ago (%)
Geographical mobility - Same house 1 year ago (%) - White
Geographical mobility - Same house 1 year ago (%) - Black or African American
Geographical mobility - Same house 1 year ago (%) - Asian
Geographical mobility - Same house 1 year ago (%) - Hispanic or Latino
Geographical mobility - Same house 1 year ago (%) - American Indian and Alaska Native
Geographical mobility - Same house 1 year ago (%) - Multirace
Geographical mobility - Same house 1 year ago (%) - Other Race
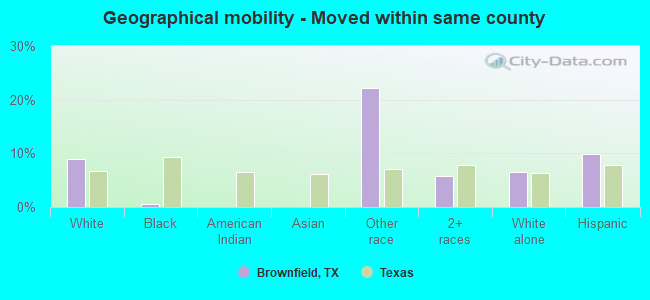
Geographical mobility - Moved within same county (%)
Geographical mobility - Moved within same county (%) - White
Geographical mobility - Moved within same county (%) - Black or African American
Geographical mobility - Moved within same county (%) - Asian
Geographical mobility - Moved within same county (%) - Hispanic or Latino
Geographical mobility - Moved within same county (%) - American Indian and Alaska Native
Geographical mobility - Moved within same county (%) - Multirace
Geographical mobility - Moved within same county (%) - Other Race
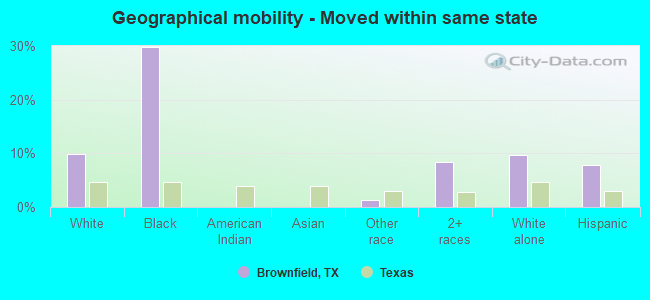
Geographical mobility - Moved from different county within same state (%)
Geographical mobility - Moved from different county within same state (%) - White
Geographical mobility - Moved from different county within same state (%) - Black or African American
Geographical mobility - Moved from different county within same state (%) - Asian
Geographical mobility - Moved from different county within same state (%) - Hispanic or Latino
Geographical mobility - Moved from different county within same state (%) - American Indian and Alaska Native
Geographical mobility - Moved from different county within same state (%) - Multirace
Geographical mobility - Moved from different county within same state (%) - Other Race
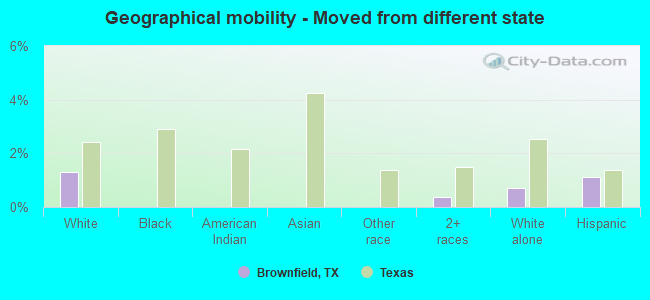
Geographical mobility - Moved from different state (%)
Geographical mobility - Moved from different state (%) - White
Geographical mobility - Moved from different state (%) - Black or African American
Geographical mobility - Moved from different state (%) - Asian
Geographical mobility - Moved from different state (%) - Hispanic or Latino
Geographical mobility - Moved from different state (%) - American Indian and Alaska Native
Geographical mobility - Moved from different state (%) - Multirace
Geographical mobility - Moved from different state (%) - Other Race
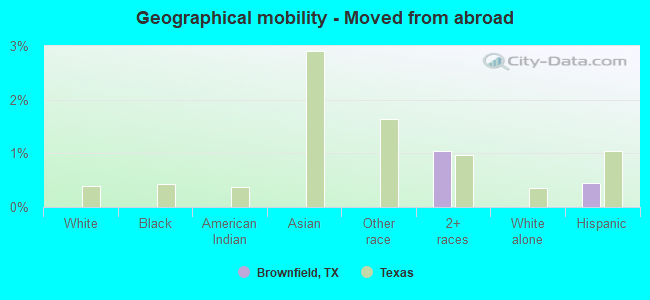
Geographical mobility - Moved from abroad (%)
Geographical mobility - Moved from abroad (%) - White
Geographical mobility - Moved from abroad (%) - Black or African American
Geographical mobility - Moved from abroad (%) - Asian
Geographical mobility - Moved from abroad (%) - Hispanic or Latino
Geographical mobility - Moved from abroad (%) - American Indian and Alaska Native
Geographical mobility - Moved from abroad (%) - Multirace
Geographical mobility - Moved from abroad (%) - Other Race
Place of birth for the foreign-born population - Ireland (%)
Place of birth for the foreign-born population - Denmark (%)
Place of birth for the foreign-born population - Norway (%)
Place of birth for the foreign-born population - Sweden (%)
Place of birth for the foreign-born population - United Kingdom (%)
Place of birth for the foreign-born population - England (%)
Place of birth for the foreign-born population - Scotland (%)
Place of birth for the foreign-born population - Other Northern Europe (%)
Place of birth for the foreign-born population - Austria (%)
Place of birth for the foreign-born population - Belgium (%)
Place of birth for the foreign-born population - France (%)
Place of birth for the foreign-born population - Germany (%)
Place of birth for the foreign-born population - Netherlands (%)
Place of birth for the foreign-born population - Switzerland (%)
Place of birth for the foreign-born population - Other Western Europe (%)
Place of birth for the foreign-born population - Greece (%)
Place of birth for the foreign-born population - Italy (%)
Place of birth for the foreign-born population - Portugal (%)
Place of birth for the foreign-born population - Spain (%)
Place of birth for the foreign-born population - Other Southern Europe (%)
Place of birth for the foreign-born population - Albania (%)
Place of birth for the foreign-born population - Belarus (%)
Place of birth for the foreign-born population - Bosnia and Herzegovina (%)
Place of birth for the foreign-born population - Bulgaria (%)
Place of birth for the foreign-born population - Croatia (%)
Place of birth for the foreign-born population - Czechoslovakia (%)
Place of birth for the foreign-born population - Hungary (%)
Place of birth for the foreign-born population - Latvia (%)
Place of birth for the foreign-born population - Lithuania (%)
Place of birth for the foreign-born population - North Macedonia (Macedonia) (%)
Place of birth for the foreign-born population - Moldova (%)
Place of birth for the foreign-born population - Poland (%)
Place of birth for the foreign-born population - Romania (%)
Place of birth for the foreign-born population - Russia (%)
Place of birth for the foreign-born population - Serbia (%)
Place of birth for the foreign-born population - Ukraine (%)
Place of birth for the foreign-born population - Other Eastern Europe (%)
Place of birth for the foreign-born population - China (%)
Place of birth for the foreign-born population - Hong Kong (%)
Place of birth for the foreign-born population - Taiwan (%)
Place of birth for the foreign-born population - Japan (%)
Place of birth for the foreign-born population - Korea (%)
Place of birth for the foreign-born population - Other Eastern Asia (%)
Place of birth for the foreign-born population - Afghanistan (%)
Place of birth for the foreign-born population - Bangladesh (%)
Place of birth for the foreign-born population - India (%)
Place of birth for the foreign-born population - Iran (%)
Place of birth for the foreign-born population - Kazakhstan (%)
Place of birth for the foreign-born population - Nepal (%)
Place of birth for the foreign-born population - Pakistan (%)
Place of birth for the foreign-born population - Sri Lanka (%)
Place of birth for the foreign-born population - Uzbekistan (%)
Place of birth for the foreign-born population - Other South Central Asia (%)
Place of birth for the foreign-born population - Burma (%)
Place of birth for the foreign-born population - Cambodia (%)
Place of birth for the foreign-born population - Indonesia (%)
Place of birth for the foreign-born population - Laos (%)
Place of birth for the foreign-born population - Malaysia (%)
Place of birth for the foreign-born population - Philippines (%)
Place of birth for the foreign-born population - Singapore (%)
Place of birth for the foreign-born population - Thailand (%)
Place of birth for the foreign-born population - Vietnam (%)
Place of birth for the foreign-born population - Other South Eastern Asia (%)
Place of birth for the foreign-born population - Armenia (%)
Place of birth for the foreign-born population - Iraq (%)
Place of birth for the foreign-born population - Israel (%)
Place of birth for the foreign-born population - Jordan (%)
Place of birth for the foreign-born population - Kuwait (%)
Place of birth for the foreign-born population - Lebanon (%)
Place of birth for the foreign-born population - Saudi Arabia (%)
Place of birth for the foreign-born population - Syria (%)
Place of birth for the foreign-born population - Turkey (%)
Place of birth for the foreign-born population - Yemen (%)
Place of birth for the foreign-born population - Other Western Asia (%)
Place of birth for the foreign-born population - Eritrea (%)
Place of birth for the foreign-born population - Ethiopia (%)
Place of birth for the foreign-born population - Kenya (%)
Place of birth for the foreign-born population - Somalia (%)
Place of birth for the foreign-born population - Uganda (%)
Place of birth for the foreign-born population - Zimbabwe (%)
Place of birth for the foreign-born population - Other Eastern Africa (%)
Place of birth for the foreign-born population - Cameroon (%)
Place of birth for the foreign-born population - Congo (%)
Place of birth for the foreign-born population - Democratic Republic of Congo (Zaire) (%)
Place of birth for the foreign-born population - Other Middle Africa (%)
Place of birth for the foreign-born population - Egypt (%)
Place of birth for the foreign-born population - Morocco (%)
Place of birth for the foreign-born population - Sudan (%)
Place of birth for the foreign-born population - Other Northern Africa (%)
Place of birth for the foreign-born population - South Africa (%)
Place of birth for the foreign-born population - Other Southern Africa (%)
Place of birth for the foreign-born population - Cabo Verde (%)
Place of birth for the foreign-born population - Ghana (%)
Place of birth for the foreign-born population - Liberia (%)
Place of birth for the foreign-born population - Nigeria (%)
Place of birth for the foreign-born population - Senegal (%)
Place of birth for the foreign-born population - Sierra Leone (%)
Place of birth for the foreign-born population - Other Western Africa (%)
Place of birth for the foreign-born population - Australia (%)
Place of birth for the foreign-born population - New Zealand (%)
Place of birth for the foreign-born population - Fiji (%)
Place of birth for the foreign-born population - Micronesia (%)
Place of birth for the foreign-born population - Bahamas (%)
Place of birth for the foreign-born population - Barbados (%)
Place of birth for the foreign-born population - Cuba (%)
Place of birth for the foreign-born population - Dominica (%)
Place of birth for the foreign-born population - Dominican Republic (%)
Place of birth for the foreign-born population - Grenada (%)
Place of birth for the foreign-born population - Haiti (%)
Place of birth for the foreign-born population - Jamaica (%)
Place of birth for the foreign-born population - St. Vincent and the Grenadines (%)
Place of birth for the foreign-born population - Trinidad and Tobago (%)
Place of birth for the foreign-born population - West Indies (%)
Place of birth for the foreign-born population - Other Caribbean (%)
Place of birth for the foreign-born population - Belize (%)
Place of birth for the foreign-born population - Costa Rica (%)
Place of birth for the foreign-born population - El Salvador (%)
Place of birth for the foreign-born population - Guatemala (%)
Place of birth for the foreign-born population - Honduras (%)
Place of birth for the foreign-born population - Mexico (%)
Place of birth for the foreign-born population - Nicaragua (%)
Place of birth for the foreign-born population - Panama (%)
Place of birth for the foreign-born population - Other Central America (%)
Place of birth for the foreign-born population - Argentina (%)
Place of birth for the foreign-born population - Bolivia (%)
Place of birth for the foreign-born population - Brazil (%)
Place of birth for the foreign-born population - Chile (%)
Place of birth for the foreign-born population - Colombia (%)
Place of birth for the foreign-born population - Ecuador (%)
Place of birth for the foreign-born population - Guyana (%)
Place of birth for the foreign-born population - Peru (%)
Place of birth for the foreign-born population - Uruguay (%)
Place of birth for the foreign-born population - Venezuela (%)
Place of birth for the foreign-born population - Other South America (%)
Place of birth for the foreign-born population - Canada (%)
Place of birth for the foreign-born population - Other Northern America (%)
Place of birth for the foreign-born population - Other (%)
Latest news about races in Brownfield, TX collected exclusively by city-data.com from local newspapers, TV, and radio stations
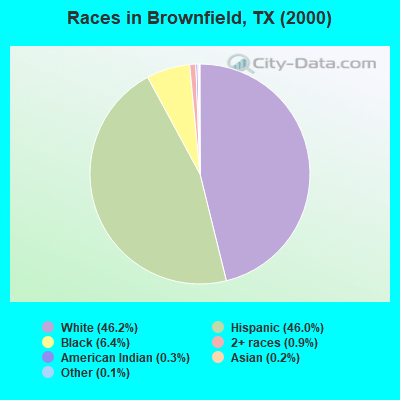
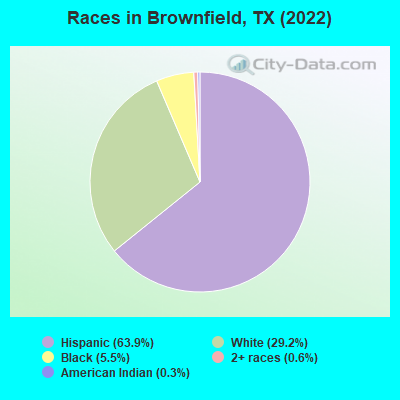
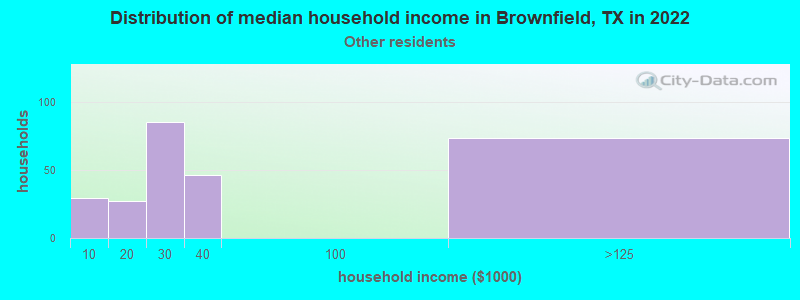
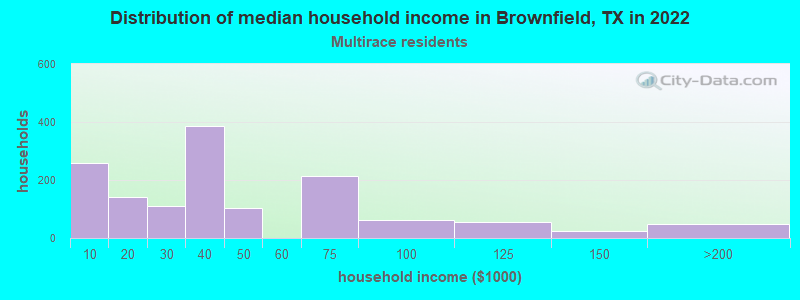
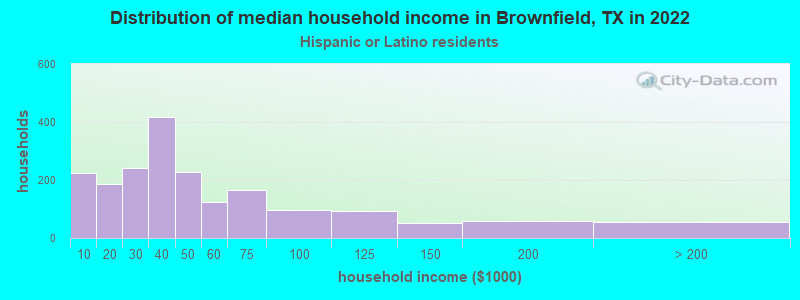
According to 2022 data, the most numerous races in Brownfield, TX are Hispanic (5,850 residents), White alone (2,673 residents), and Black alone (507 residents). 59.9% of Brownfield residents speak English at home. 8.1% of Brownfield, TX residents are foreign-born (7.8% born in Latin America), which is 110.2% less than the foreign-born rate of 17.0% across the entire state of Texas.
Race distribution in Brownfield
2000 2022
10,933,313 52.4% White alone 6,669,666 32.0% Hispanic 2,364,255 11.3% Black alone 554,445 2.7% Asian alone 230,567 1.1% Two or more races 68,859 0.3% American Indian alone 19,958 0.10% Other race alone 10,757 0.05% Native Hawaiian and Other
12,070,642 40.2% Hispanic 11,683,430 38.9% White alone 3,508,706 11.7% Black alone 1,608,173 5.4% Asian alone 956,560 3.2% Two or more races 125,763 0.4% Other race alone 47,023 0.2% American Indian alone 29,275 0.10% Native Hawaiian and Other
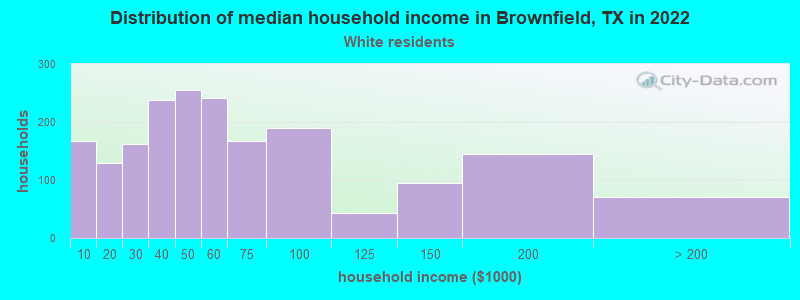
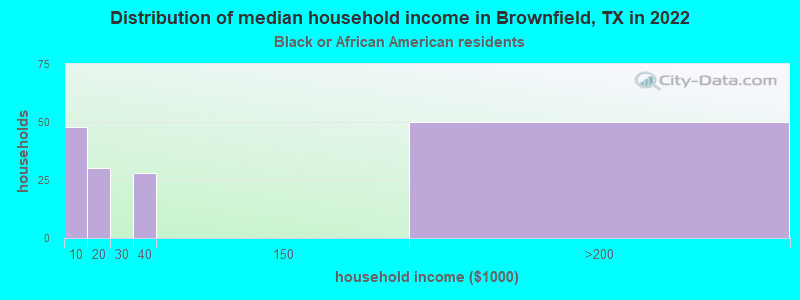
Income and house value in Brownfield Median household income in 2022 $51,850 White non-Hispanic householders$34,527 Two or more races householders$36,656 Hispanic or Latino race householdersMedian 2022 house value $167,164 White Non-Hispanic householders$68,601 Black or African American householders$182,004 American Indian or Alaska Native householders $315,007 Asian householders$57,121 Some other race householders$198,804 Two or more races householders$67,761 Hispanic or Latino householders
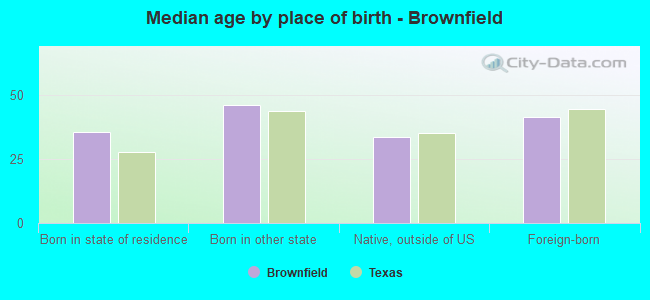
Median age by race in Brownfield
40.6 Median age for White residents41.0 39.7 41.6 Median age for Black or African American residents29.5 50.5 -684,418,145.3 Median age for American Indian / Alaska Native residents-682,445,758.7 -684,418,145.3 -681,278,538.1 Median age for Asian residents-683,426,442.5 -679,245,282.3 -581,560,283.1 Median age for Native Hawaiian / Pacific Islander residents-612,729,233.5 -577,777,777.2 39.3 Median age for Other race residents39.0 39.3 25.9 Median age for Two or more races residents17.3 33.7 50.7 Median age for White alone residents47.5 59.4 29.7 Median age for Hispanic or Latino residents26.9 33.3
Owner/renter occupied households by race in Brownfield
House owners and renters - White residents 1,394 72.3% Owner occupied535 27.7% Renter occupiedHouse owners and renters - Black or African American residents 61 40.4% Owner occupied91 59.6% Renter occupiedHouse owners and renters - American Indian / Alaska Native residents 43 100.0% Owner occupiedHouse owners and renters - Other race residents 192 71.4% Owner occupied77 28.6% Renter occupiedHouse owners and renters - Two or more races residents 680 48.9% Owner occupied711 51.1% Renter occupiedHouse owners and renters - White alone residents 1,092 77.3% Owner occupied320 22.7% Renter occupiedHouse owners and renters - Hispanic or Latino residents 1,074 55.2% Owner occupied870 44.8% Renter occupied
Language usage in Brownfield
English speakers - Total 59.9% of residents of Brownfield speak English at home.
37.6% of residents speak Spanish at home 2,464 76.0% Speak English very well777 24.0% Speak English less than very well2.2% of residents speak other language at home 91 47.9% Speak English very well99 52.1% Speak English less than very well
English speakers - Born in the United States 85.2% of residents of Brownfield speak English at home.
14.2% of residents speak Spanish at home 164 91.6% Speak English very well15 8.4% Speak English less than very well0.4% of residents speak other language at home 5 100.0% Speak English very well
English speakers - Native, born elsewhere 99.0% of residents of Brownfield speak English at home.
English speakers - Foreign-born 3.0% of residents of Brownfield speak English at home.
72.3% of residents speak Spanish at home 25 4.7% Speak English very well510 95.3% Speak English less than very well23.5% of residents speak other language at home 77 44.3% Speak English very well97 55.7% Speak English less than very well
White (Caucasian) - Speak only English Native:
73.9% (3,046)Foreign-born:
5.5% (11)
White (Caucasian) - Speak another language Native:
18.8% (775)Foreign-born:
85.6% (165)
Other race - Speak another language Native:
84.1% (343)Foreign-born:
99.5% (84)
Two or more races - Speak only English Native:
53.8% (1,806)Foreign-born:
3.8% (15)
Two or more races - Speak another language Native:
45.3% (1,520)Foreign-born:
96.3% (373)
White alone - Speak only English Native:
96.6% (2,295)Foreign-born:
7.4% (13)
White alone - Speak another language Native:
3.4% (80)Foreign-born:
92.5% (158)
Hispanic or Latino - Speak only English Native:
46.4% (2,273)Foreign-born:
1.8% (10)
Hispanic or Latino - Speak another language Native:
53.8% (2,637)Foreign-born:
97.9% (540)
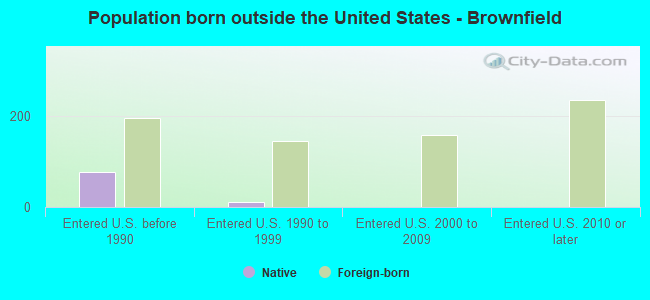
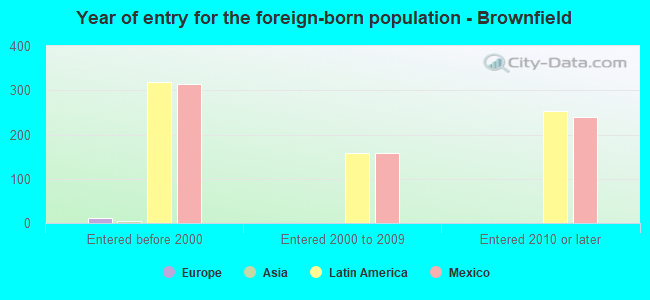
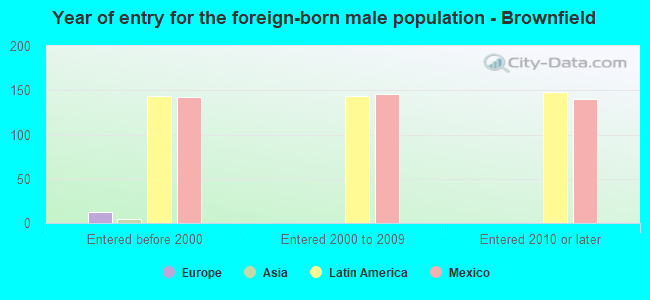
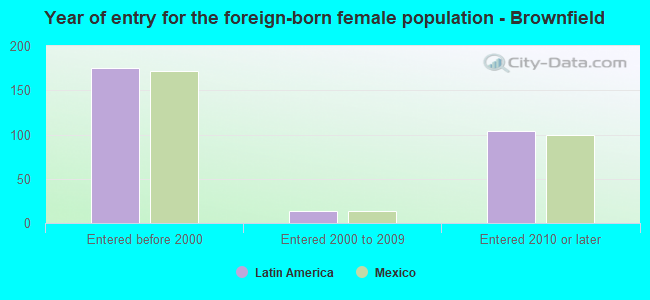
Foreign-born residents in Brownfield 740 residents are foreign born (7.8% Latin America ).
This city:
8.1%Texas:
17.1%
Marital status for residents in Brownfield Marital status - White (Caucasian) population 15 years and over
Males 25.9% Never married55.2% Now married3.1% Separated6.8% Widowed9.1% DivorcedFemales 24.8% Never married50.7% Now married7.5% Separated9.9% Widowed7.2% DivorcedWomen who gave birth in the past 12 months Now married:
100.0% (36)Unmarried:
0.0% (0)
Women who did not give birth in the past 12 months Now married:
50.5% (402)Unmarried:
49.5% (395)
Marital status - Black or African American population 15 years and over
Males 68.0% Never married17.5% Now married1.5% Separated0.6% Widowed12.4% DivorcedFemales 4.2% Never married37.3% Now married4.9% Separated0.0% Widowed53.5% DivorcedWomen who did not give birth in the past 12 months Now married:
22.1% (15)Unmarried:
77.9% (54)
Marital status - Other race population 15 years and over
Males 26.4% Never married31.6% Now married0.0% Separated12.3% Widowed29.7% DivorcedFemales 0.0% Never married50.0% Now married4.9% Separated10.7% Widowed34.4% DivorcedWomen who did not give birth in the past 12 months Now married:
31.1% (26)Unmarried:
68.9% (58)
Marital status - Two or more races population 15 years and over
Males 77.9% Never married11.4% Now married5.4% Separated4.4% Widowed1.0% DivorcedFemales 62.8% Never married15.4% Now married0.0% Separated8.3% Widowed13.5% DivorcedWomen who gave birth in the past 12 months Now married:
0.0% (0)Unmarried:
100.0% (23)
Women who did not give birth in the past 12 months Now married:
12.9% (124)Unmarried:
87.1% (836)
Marital status - White alone, not Hispanic / Latino population 15 years and over
Males 16.8% Never married56.5% Now married2.9% Separated12.0% Widowed11.8% DivorcedFemales 10.0% Never married60.4% Now married9.6% Separated13.1% Widowed6.9% DivorcedWomen who gave birth in the past 12 months Now married:
100.0% (15)Unmarried:
0.0% (0)
Women who did not give birth in the past 12 months Now married:
77.6% (334)Unmarried:
22.4% (96)
Marital status - Hispanic or Latino population 15 years and over
Males 53.7% Never married33.0% Now married4.0% Separated3.5% Widowed5.8% DivorcedFemales 48.9% Never married28.0% Now married2.6% Separated7.1% Widowed13.3% DivorcedWomen who gave birth in the past 12 months Now married:
67.4% (30)Unmarried:
32.6% (15)
Women who did not give birth in the past 12 months Now married:
20.4% (254)Unmarried:
79.6% (991)
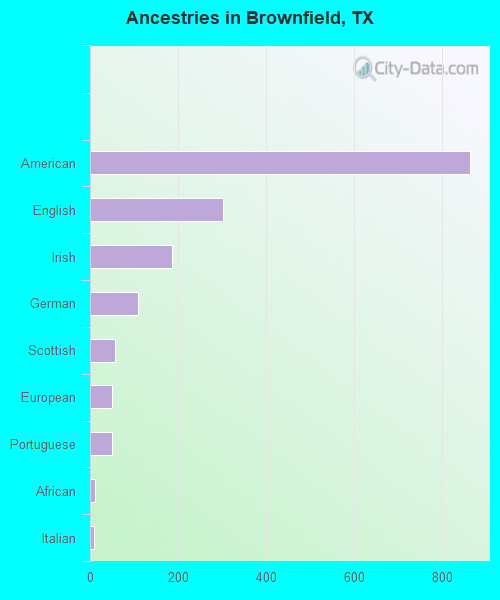
Ancestries in Brownfield
863 15.5% American303 5.4% English187 3.3% Irish109 2.0% German56 1.0% Scottish50 0.9% European50 0.9% Portuguese12 0.2% African8 0.1% Italian6 0.1% Scotch-Irish4 0.07% Norwegian2 0.04% British2 0.04% Czech
Children Nativity (place of birth) in Brownfield
Children under 6 years - Living with two parents Both parents native 131 100.0% NativeBoth parents foreign-born 82 100.0% NativeOne native, one foreign-born parent 34 100.0% NativeChildren under 6 years - Living with one parent Native parent 430 100.0% NativeForeign-born parent 11 100.0% NativeChildren 6 to 17 years - Living with two parents Both parents native 481 100.0% NativeBoth parents foreign-born 14 100.0% NativeOne native, one foreign-born parent 73 100.0% NativeChildren 6 to 17 years - Living with one parent Native parent 705 100.0% NativeForeign-born parent 12 50.5% Native12 49.5% Foreign-born
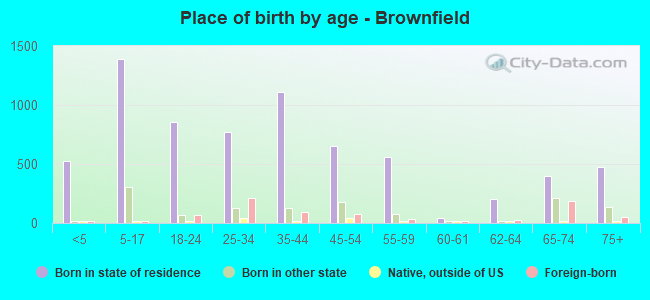
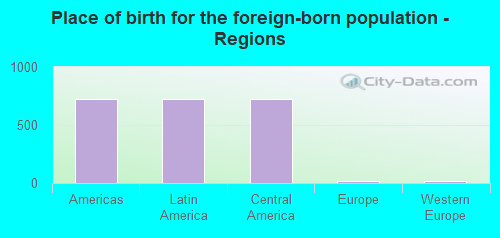
Place of birth for residents in Brownfield 723 Americas723 Latin America723 Central America13 Europe13 Western Europe4 Asia4 South Eastern Asia
Grandparents responsible for own grandchildren in Brownfield
Grandparents (30 to 59 years) White / Caucasian 49 59.7% Responsible for grandchildren33 40.3% Not responsible for grandchildrenBlack or African American 27 100.0% Responsible for grandchildrenTwo or more races 52 49.5% Responsible for grandchildren53 50.5% Not responsible for grandchildrenWhite alone, not Hispanic / Latino 52 100.0% Not responsible for grandchildrenHispanic or Latino 105 77.1% Responsible for grandchildren31 22.9% Not responsible for grandchildren
Grandparents (60 years and over)