Races in Brunswick, Maryland (MD) Detailed Stats
Data:
Races - White alone (%)
Races - White alone (% change since 2000)
Races - Black alone (%)
Races - Black alone (% change since 2000)
Races - American Indian alone (%)
Races - American Indian alone (% change since 2000)
Races - Asian alone (%)
Races - Asian alone (% change since 2000)
Races - Hispanic (%)
Races - Hispanic (% change since 2000)
Races - Native Hawaiian and Other Pacific Islander alone (%)
Races - Native Hawaiian and Other Pacific Islander alone (% change since 2000)
Races - Two or more races(%)
Races - Two or more races(% change since 2000)
Races - Other race alone (%)
Races - Other race alone (% change since 2000)
Racial diversity
Place of birth - Born in state of residence (%)
Place of birth - Born in state of residence (%) - White
Place of birth - Born in state of residence (%) - Black or African American
Place of birth - Born in state of residence (%) - Asian
Place of birth - Born in state of residence (%) - Hispanic or Latino
Place of birth - Born in state of residence (%) - American Indian and Alaska Native
Place of birth - Born in state of residence (%) - Multirace
Place of birth - Born in state of residence (%) - Other Race
Place of birth - Born in other state (%)
Place of birth - Born in other state (%) - White
Place of birth - Born in other state (%) - Black or African American
Place of birth - Born in other state (%) - Asian
Place of birth - Born in other state (%) - Hispanic or Latino
Place of birth - Born in other state (%) - American Indian and Alaska Native
Place of birth - Born in other state (%) - Multirace
Place of birth - Born in other state (%) - Other Race
Place of birth - Native, outside of US (%)
Place of birth - Native, outside of US (%) - White
Place of birth - Native, outside of US (%) - Black or African American
Place of birth - Native, outside of US (%) - Asian
Place of birth - Native, outside of US (%) - Hispanic or Latino
Place of birth - Native, outside of US (%) - American Indian and Alaska Native
Place of birth - Native, outside of US (%) - Multirace
Place of birth - Native, outside of US (%) - Other Race
Place of birth - Foreign born (%)
Place of birth - Foreign born (%) - White
Place of birth - Foreign born (%) - Black or African American
Place of birth - Foreign born (%) - Asian
Place of birth - Foreign born (%) - Hispanic or Latino
Place of birth - Foreign born (%) - American Indian and Alaska Native
Place of birth - Foreign born (%) - Multirace
Place of birth - Foreign born (%) - Other Race
Residents speaking English at home (%)
Residents speaking English at home - Born in the United States (%)
Residents speaking English at home - Native, born elsewhere (%)
Residents speaking English at home - Foreign born (%)
Residents speaking Spanish at home (%)
Residents speaking Spanish at home - Born in the United States (%)
Residents speaking Spanish at home - Native, born elsewhere (%)
Residents speaking Spanish at home - Foreign born (%)
Residents speaking other language at home (%)
Residents speaking other language at home - Born in the United States (%)
Residents speaking other language at home - Native, born elsewhere (%)
Residents speaking other language at home - Foreign born (%)
Marital status - Never married (%)
Marital status - Now married (%)
Marital status - Separated (%)
Marital status - Widowed (%)
Marital status - Divorced (%)
Ancestries Reported - Arab (%)
Ancestries Reported - Czech (%)
Ancestries Reported - Danish (%)
Ancestries Reported - Dutch (%)
Ancestries Reported - English (%)
Ancestries Reported - French (%)
Ancestries Reported - French Canadian (%)
Ancestries Reported - German (%)
Ancestries Reported - Greek (%)
Ancestries Reported - Hungarian (%)
Ancestries Reported - Irish (%)
Ancestries Reported - Italian (%)
Ancestries Reported - Lithuanian (%)
Ancestries Reported - Norwegian (%)
Ancestries Reported - Polish (%)
Ancestries Reported - Portuguese (%)
Ancestries Reported - Russian (%)
Ancestries Reported - Scotch-Irish (%)
Ancestries Reported - Scottish (%)
Ancestries Reported - Slovak (%)
Ancestries Reported - Subsaharan African (%)
Ancestries Reported - Swedish (%)
Ancestries Reported - Swiss (%)
Ancestries Reported - Ukrainian (%)
Ancestries Reported - United States (%)
Ancestries Reported - Welsh (%)
Ancestries Reported - West Indian (%)
Ancestries Reported - Other (%)
Geographical mobility - Same house 1 year ago (%)
Geographical mobility - Same house 1 year ago (%) - White
Geographical mobility - Same house 1 year ago (%) - Black or African American
Geographical mobility - Same house 1 year ago (%) - Asian
Geographical mobility - Same house 1 year ago (%) - Hispanic or Latino
Geographical mobility - Same house 1 year ago (%) - American Indian and Alaska Native
Geographical mobility - Same house 1 year ago (%) - Multirace
Geographical mobility - Same house 1 year ago (%) - Other Race
Geographical mobility - Moved within same county (%)
Geographical mobility - Moved within same county (%) - White
Geographical mobility - Moved within same county (%) - Black or African American
Geographical mobility - Moved within same county (%) - Asian
Geographical mobility - Moved within same county (%) - Hispanic or Latino
Geographical mobility - Moved within same county (%) - American Indian and Alaska Native
Geographical mobility - Moved within same county (%) - Multirace
Geographical mobility - Moved within same county (%) - Other Race
Geographical mobility - Moved from different county within same state (%)
Geographical mobility - Moved from different county within same state (%) - White
Geographical mobility - Moved from different county within same state (%) - Black or African American
Geographical mobility - Moved from different county within same state (%) - Asian
Geographical mobility - Moved from different county within same state (%) - Hispanic or Latino
Geographical mobility - Moved from different county within same state (%) - American Indian and Alaska Native
Geographical mobility - Moved from different county within same state (%) - Multirace
Geographical mobility - Moved from different county within same state (%) - Other Race
Geographical mobility - Moved from different state (%)
Geographical mobility - Moved from different state (%) - White
Geographical mobility - Moved from different state (%) - Black or African American
Geographical mobility - Moved from different state (%) - Asian
Geographical mobility - Moved from different state (%) - Hispanic or Latino
Geographical mobility - Moved from different state (%) - American Indian and Alaska Native
Geographical mobility - Moved from different state (%) - Multirace
Geographical mobility - Moved from different state (%) - Other Race
Geographical mobility - Moved from abroad (%)
Geographical mobility - Moved from abroad (%) - White
Geographical mobility - Moved from abroad (%) - Black or African American
Geographical mobility - Moved from abroad (%) - Asian
Geographical mobility - Moved from abroad (%) - Hispanic or Latino
Geographical mobility - Moved from abroad (%) - American Indian and Alaska Native
Geographical mobility - Moved from abroad (%) - Multirace
Geographical mobility - Moved from abroad (%) - Other Race
Place of birth for the foreign-born population - Ireland (%)
Place of birth for the foreign-born population - Denmark (%)
Place of birth for the foreign-born population - Norway (%)
Place of birth for the foreign-born population - Sweden (%)
Place of birth for the foreign-born population - United Kingdom (%)
Place of birth for the foreign-born population - England (%)
Place of birth for the foreign-born population - Scotland (%)
Place of birth for the foreign-born population - Other Northern Europe (%)
Place of birth for the foreign-born population - Austria (%)
Place of birth for the foreign-born population - Belgium (%)
Place of birth for the foreign-born population - France (%)
Place of birth for the foreign-born population - Germany (%)
Place of birth for the foreign-born population - Netherlands (%)
Place of birth for the foreign-born population - Switzerland (%)
Place of birth for the foreign-born population - Other Western Europe (%)
Place of birth for the foreign-born population - Greece (%)
Place of birth for the foreign-born population - Italy (%)
Place of birth for the foreign-born population - Portugal (%)
Place of birth for the foreign-born population - Spain (%)
Place of birth for the foreign-born population - Other Southern Europe (%)
Place of birth for the foreign-born population - Albania (%)
Place of birth for the foreign-born population - Belarus (%)
Place of birth for the foreign-born population - Bosnia and Herzegovina (%)
Place of birth for the foreign-born population - Bulgaria (%)
Place of birth for the foreign-born population - Croatia (%)
Place of birth for the foreign-born population - Czechoslovakia (%)
Place of birth for the foreign-born population - Hungary (%)
Place of birth for the foreign-born population - Latvia (%)
Place of birth for the foreign-born population - Lithuania (%)
Place of birth for the foreign-born population - North Macedonia (Macedonia) (%)
Place of birth for the foreign-born population - Moldova (%)
Place of birth for the foreign-born population - Poland (%)
Place of birth for the foreign-born population - Romania (%)
Place of birth for the foreign-born population - Russia (%)
Place of birth for the foreign-born population - Serbia (%)
Place of birth for the foreign-born population - Ukraine (%)
Place of birth for the foreign-born population - Other Eastern Europe (%)
Place of birth for the foreign-born population - China (%)
Place of birth for the foreign-born population - Hong Kong (%)
Place of birth for the foreign-born population - Taiwan (%)
Place of birth for the foreign-born population - Japan (%)
Place of birth for the foreign-born population - Korea (%)
Place of birth for the foreign-born population - Other Eastern Asia (%)
Place of birth for the foreign-born population - Afghanistan (%)
Place of birth for the foreign-born population - Bangladesh (%)
Place of birth for the foreign-born population - India (%)
Place of birth for the foreign-born population - Iran (%)
Place of birth for the foreign-born population - Kazakhstan (%)
Place of birth for the foreign-born population - Nepal (%)
Place of birth for the foreign-born population - Pakistan (%)
Place of birth for the foreign-born population - Sri Lanka (%)
Place of birth for the foreign-born population - Uzbekistan (%)
Place of birth for the foreign-born population - Other South Central Asia (%)
Place of birth for the foreign-born population - Burma (%)
Place of birth for the foreign-born population - Cambodia (%)
Place of birth for the foreign-born population - Indonesia (%)
Place of birth for the foreign-born population - Laos (%)
Place of birth for the foreign-born population - Malaysia (%)
Place of birth for the foreign-born population - Philippines (%)
Place of birth for the foreign-born population - Singapore (%)
Place of birth for the foreign-born population - Thailand (%)
Place of birth for the foreign-born population - Vietnam (%)
Place of birth for the foreign-born population - Other South Eastern Asia (%)
Place of birth for the foreign-born population - Armenia (%)
Place of birth for the foreign-born population - Iraq (%)
Place of birth for the foreign-born population - Israel (%)
Place of birth for the foreign-born population - Jordan (%)
Place of birth for the foreign-born population - Kuwait (%)
Place of birth for the foreign-born population - Lebanon (%)
Place of birth for the foreign-born population - Saudi Arabia (%)
Place of birth for the foreign-born population - Syria (%)
Place of birth for the foreign-born population - Turkey (%)
Place of birth for the foreign-born population - Yemen (%)
Place of birth for the foreign-born population - Other Western Asia (%)
Place of birth for the foreign-born population - Eritrea (%)
Place of birth for the foreign-born population - Ethiopia (%)
Place of birth for the foreign-born population - Kenya (%)
Place of birth for the foreign-born population - Somalia (%)
Place of birth for the foreign-born population - Uganda (%)
Place of birth for the foreign-born population - Zimbabwe (%)
Place of birth for the foreign-born population - Other Eastern Africa (%)
Place of birth for the foreign-born population - Cameroon (%)
Place of birth for the foreign-born population - Congo (%)
Place of birth for the foreign-born population - Democratic Republic of Congo (Zaire) (%)
Place of birth for the foreign-born population - Other Middle Africa (%)
Place of birth for the foreign-born population - Egypt (%)
Place of birth for the foreign-born population - Morocco (%)
Place of birth for the foreign-born population - Sudan (%)
Place of birth for the foreign-born population - Other Northern Africa (%)
Place of birth for the foreign-born population - South Africa (%)
Place of birth for the foreign-born population - Other Southern Africa (%)
Place of birth for the foreign-born population - Cabo Verde (%)
Place of birth for the foreign-born population - Ghana (%)
Place of birth for the foreign-born population - Liberia (%)
Place of birth for the foreign-born population - Nigeria (%)
Place of birth for the foreign-born population - Senegal (%)
Place of birth for the foreign-born population - Sierra Leone (%)
Place of birth for the foreign-born population - Other Western Africa (%)
Place of birth for the foreign-born population - Australia (%)
Place of birth for the foreign-born population - New Zealand (%)
Place of birth for the foreign-born population - Fiji (%)
Place of birth for the foreign-born population - Micronesia (%)
Place of birth for the foreign-born population - Bahamas (%)
Place of birth for the foreign-born population - Barbados (%)
Place of birth for the foreign-born population - Cuba (%)
Place of birth for the foreign-born population - Dominica (%)
Place of birth for the foreign-born population - Dominican Republic (%)
Place of birth for the foreign-born population - Grenada (%)
Place of birth for the foreign-born population - Haiti (%)
Place of birth for the foreign-born population - Jamaica (%)
Place of birth for the foreign-born population - St. Vincent and the Grenadines (%)
Place of birth for the foreign-born population - Trinidad and Tobago (%)
Place of birth for the foreign-born population - West Indies (%)
Place of birth for the foreign-born population - Other Caribbean (%)
Place of birth for the foreign-born population - Belize (%)
Place of birth for the foreign-born population - Costa Rica (%)
Place of birth for the foreign-born population - El Salvador (%)
Place of birth for the foreign-born population - Guatemala (%)
Place of birth for the foreign-born population - Honduras (%)
Place of birth for the foreign-born population - Mexico (%)
Place of birth for the foreign-born population - Nicaragua (%)
Place of birth for the foreign-born population - Panama (%)
Place of birth for the foreign-born population - Other Central America (%)
Place of birth for the foreign-born population - Argentina (%)
Place of birth for the foreign-born population - Bolivia (%)
Place of birth for the foreign-born population - Brazil (%)
Place of birth for the foreign-born population - Chile (%)
Place of birth for the foreign-born population - Colombia (%)
Place of birth for the foreign-born population - Ecuador (%)
Place of birth for the foreign-born population - Guyana (%)
Place of birth for the foreign-born population - Peru (%)
Place of birth for the foreign-born population - Uruguay (%)
Place of birth for the foreign-born population - Venezuela (%)
Place of birth for the foreign-born population - Other South America (%)
Place of birth for the foreign-born population - Canada (%)
Place of birth for the foreign-born population - Other Northern America (%)
Place of birth for the foreign-born population - Other (%)
Latest news about races in Brunswick, MD collected exclusively by city-data.com from local newspapers, TV, and radio stations
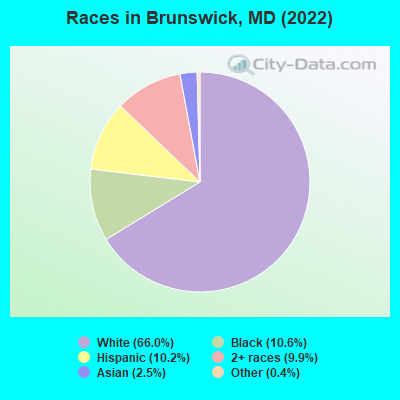
According to 2022 data, the most numerous races in Brunswick, MD are White alone (5,387 residents), Black alone (866 residents), and Hispanic (832 residents). 86.4% of Brunswick residents speak English at home. 9.4% of Brunswick, MD residents are foreign-born (4.3% born in Latin America, 1.8% born in Africa, 1.6% born in Asia, 1.2% born in Europe), which is 70.8% less than the foreign-born rate of 16.0% across the entire state of Maryland.
Race distribution in Brunswick
2000 2022
3,286,547 62.1% White alone 1,464,735 27.7% Black alone 227,916 4.3% Hispanic 209,738 4.0% Asian alone 82,946 1.6% Two or more races 13,312 0.3% American Indian alone 9,379 0.2% Other race alone 1,913 0.04% Native Hawaiian and Other
2,906,492 47.1% White alone 1,800,914 29.2% Black alone 705,842 11.4% Hispanic 401,818 6.5% Asian alone 291,317 4.7% Two or more races 46,930 0.8% Other race alone 8,930 0.1% American Indian alone 2,417 0.04% Native Hawaiian and Other
Income and house value in Brunswick Median household income in 2022 $99,654 White non-Hispanic householders$161,231 Black householders$68,752 Asian householders$136,701 Two or more races householders$161,682 Hispanic or Latino race householdersMedian 2022 house value $322,816 White Non-Hispanic householders$300,709 Black or African American householders$375,205 Hispanic or Latino householders
Median age by race in Brunswick
40.7 Median age for White residents37.5 43.2 35.9 Median age for Black or African American residents35.5 22.5 7.7 Median age for American Indian / Alaska Native residents-405,255,877.9 -532,350,531.8 32.9 Median age for Asian residents34.5 31.0 -763,333,332.6 Median age for Native Hawaiian / Pacific Islander residents-720,061,021.4 -760,942,760.2 28.0 Median age for Other race residents-619,607,842.5 24.9 29.4 Median age for Two or more races residents25.4 37.6 40.8 Median age for White alone residents37.2 42.0 25.4 Median age for Hispanic or Latino residents25.1 29.4
Owner/renter occupied households by race in Brunswick
House owners and renters - White residents 1,980 85.0% Owner occupied348 15.0% Renter occupiedHouse owners and renters - Black or African American residents 257 66.1% Owner occupied132 33.9% Renter occupiedHouse owners and renters - American Indian / Alaska Native residents 1 100.0% Owner occupiedHouse owners and renters - Asian residents 35 87.0% Owner occupied5 13.0% Renter occupiedHouse owners and renters - Other race residents 12 100.0% Owner occupiedHouse owners and renters - Two or more races residents 305 85.5% Owner occupied52 14.5% Renter occupiedHouse owners and renters - White alone residents 1,962 84.2% Owner occupied368 15.8% Renter occupiedHouse owners and renters - Hispanic or Latino residents 187 95.9% Owner occupied8 4.1% Renter occupied
Language usage in Brunswick
English speakers - Total 86.4% of residents of Brunswick speak English at home.
7.1% of residents speak Spanish at home 384 70.2% Speak English very well163 29.8% Speak English less than very well5.3% of residents speak other language at home 353 86.3% Speak English very well56 13.7% Speak English less than very well
English speakers - Born in the United States 89.3% of residents of Brunswick speak English at home.
8.7% of residents speak Spanish at home 264 92.3% Speak English very well22 7.7% Speak English less than very well2.2% of residents speak other language at home 73 100.0% Speak English very well
English speakers - Native, born elsewhere 95.2% of residents of Brunswick speak English at home.
5.5% of residents speak Spanish at home 8 100.0% Speak English less than very well3.4% of residents speak other language at home 5 100.0% Speak English very well
English speakers - Foreign-born 44.0% of residents of Brunswick speak English at home.
25.3% of residents speak Spanish at home 125 56.1% Speak English very well98 43.9% Speak English less than very well26.7% of residents speak other language at home 177 75.3% Speak English very well58 24.7% Speak English less than very well
White (Caucasian) - Speak only English Native:
98.3% (4,914)Foreign-born:
100.0% (84)
White (Caucasian) - Speak another language Native:
1.9% (97)Foreign-born:
30.2% (25)
Black or African American - Speak only English Native:
81.5% (490)Foreign-born:
59.6% (164)
Black or African American - Speak another language Native:
23.4% (141)Foreign-born:
38.8% (107)
American Indian / Alaska Native - Speak only English Native:
80.3% (4)Foreign-born:
42.1% (8)
Asian - Speak only English Native:
59.0% (28)Foreign-born:
47.4% (76)
Asian - Speak another language Native:
40.1% (19)Foreign-born:
51.6% (83)
Other race - Speak only English Native:
76.8% (44)Foreign-born:
56.4% (22)
Two or more races - Speak only English Native:
75.8% (860)Foreign-born:
9.2% (39)
Two or more races - Speak another language Native:
24.3% (276)Foreign-born:
92.0% (393)
White alone - Speak only English Native:
97.9% (4,883)Foreign-born:
75.2% (100)
White alone - Speak another language Native:
2.1% (106)Foreign-born:
27.8% (37)
Hispanic or Latino - Speak only English Native:
49.7% (232)Foreign-born:
21.6% (64)
Hispanic or Latino - Speak another language Native:
50.4% (235)Foreign-born:
76.4% (227)
Foreign-born residents in Brunswick 764 residents are foreign born (4.3% Latin America , 1.8% Africa , 1.6% Asia , 1.2% Europe ).
This city:
9.4%Maryland:
15.7%
Marital status for residents in Brunswick Marital status - White (Caucasian) population 15 years and over
Males 32.4% Never married54.3% Now married1.4% Separated3.3% Widowed8.6% DivorcedFemales 28.2% Never married48.2% Now married0.5% Separated3.7% Widowed19.3% DivorcedWomen who gave birth in the past 12 months Now married:
73.8% (45)Unmarried:
26.2% (16)
Women who did not give birth in the past 12 months Now married:
45.3% (484)Unmarried:
54.7% (583)
Marital status - Black or African American population 15 years and over
Males 39.0% Never married48.5% Now married3.5% Separated0.0% Widowed9.0% DivorcedFemales 32.0% Never married48.9% Now married13.2% Separated3.0% Widowed3.0% DivorcedWomen who gave birth in the past 12 months Now married:
0.0% (0)Unmarried:
100.0% (24)
Women who did not give birth in the past 12 months Now married:
65.6% (142)Unmarried:
34.4% (74)
Marital status - American Indian / Alaska Native population 15 years and over
Males 0.0% Never married100.0% Now married0.0% Separated0.0% Widowed0.0% DivorcedFemales 100.0% Never married0.0% Now married0.0% Separated0.0% Widowed0.0% DivorcedWomen who did not give birth in the past 12 months Now married:
0.0% (0)Unmarried:
100.0% (4)
Marital status - Asian population 15 years and over
Males 40.0% Never married51.2% Now married0.0% Separated0.0% Widowed8.8% DivorcedFemales 0.0% Never married86.0% Now married0.0% Separated0.0% Widowed14.0% DivorcedWomen who gave birth in the past 12 months Now married:
100.0% (22)Unmarried:
0.0% (0)
Women who did not give birth in the past 12 months Now married:
100.0% (30)Unmarried:
0.0% (0)
Marital status - Other race population 15 years and over
Males 0.0% Never married100.0% Now married0.0% Separated0.0% Widowed0.0% DivorcedFemales 0.0% Never married100.0% Now married0.0% Separated0.0% Widowed0.0% DivorcedWomen who did not give birth in the past 12 months Now married:
100.0% (33)Unmarried:
0.0% (0)
Marital status - Two or more races population 15 years and over
Males 45.1% Never married44.8% Now married0.0% Separated0.0% Widowed10.1% DivorcedFemales 30.1% Never married68.3% Now married0.0% Separated1.6% Widowed0.0% DivorcedWomen who gave birth in the past 12 months Now married:
100.0% (31)Unmarried:
0.0% (0)
Women who did not give birth in the past 12 months Now married:
61.8% (354)Unmarried:
38.2% (219)
Marital status - White alone, not Hispanic / Latino population 15 years and over
Males 32.6% Never married53.7% Now married1.5% Separated3.4% Widowed8.8% DivorcedFemales 28.2% Never married47.8% Now married0.5% Separated3.8% Widowed19.6% DivorcedWomen who gave birth in the past 12 months Now married:
73.8% (47)Unmarried:
26.2% (17)
Women who did not give birth in the past 12 months Now married:
45.2% (501)Unmarried:
54.8% (606)
Marital status - Hispanic or Latino population 15 years and over
Males 31.9% Never married68.1% Now married0.0% Separated0.0% Widowed0.0% DivorcedFemales 20.7% Never married76.4% Now married0.0% Separated3.0% Widowed0.0% DivorcedWomen who gave birth in the past 12 months Now married:
100.0% (26)Unmarried:
0.0% (0)
Women who did not give birth in the past 12 months Now married:
72.9% (175)Unmarried:
27.1% (65)
Ancestries in Brunswick
597 16.6% German511 14.2% English372 10.3% American288 8.0% Irish105 2.9% Polish93 2.6% Italian56 1.6% European54 1.5% African41 1.1% Scotch-Irish34 0.9% Romanian33 0.9% French30 0.8% Scottish24 0.7% Russian19 0.5% Eastern European18 0.5% Dutch13 0.4% Czech12 0.3% Armenian12 0.3% French Canadian11 0.3% Swiss11 0.3% Haitian10 0.3% Greek
Children Nativity (place of birth) in Brunswick
Children under 6 years - Living with two parents Both parents native 424 100.0% NativeBoth parents foreign-born 107 100.0% NativeOne native, one foreign-born parent 40 100.0% NativeChildren under 6 years - Living with one parent Native parent 38 100.0% NativeChildren 6 to 17 years - Living with two parents Both parents native 626 93.4% Native44 6.6% Foreign-bornBoth parents foreign-born 394 98.0% Native8 2.0% Foreign-bornOne native, one foreign-born parent 56 78.0% Native16 22.0% Foreign-bornChildren 6 to 17 years - Living with one parent Native parent 324 100.0% Native
Grandparents responsible for own grandchildren in Brunswick
Grandparents (30 to 59 years) Black or African American 32 74.2% Responsible for grandchildren11 25.8% Not responsible for grandchildren
Grandparents (60 years and over)