Races in Butte-Silver Bow, Montana (MT) Detailed Stats
Data:
Races - White alone (%)
Races - White alone (% change since 2000)
Races - Black alone (%)
Races - Black alone (% change since 2000)
Races - American Indian alone (%)
Races - American Indian alone (% change since 2000)
Races - Asian alone (%)
Races - Asian alone (% change since 2000)
Races - Hispanic (%)
Races - Hispanic (% change since 2000)
Races - Native Hawaiian and Other Pacific Islander alone (%)
Races - Native Hawaiian and Other Pacific Islander alone (% change since 2000)
Races - Two or more races(%)
Races - Two or more races(% change since 2000)
Races - Other race alone (%)
Races - Other race alone (% change since 2000)
Racial diversity
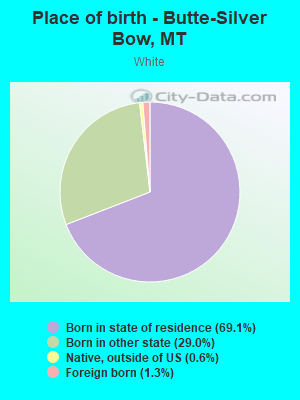
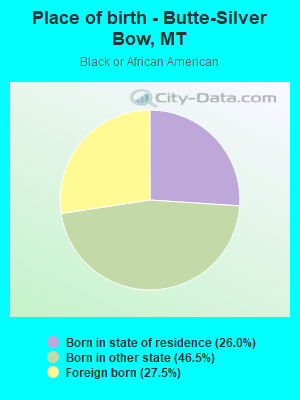
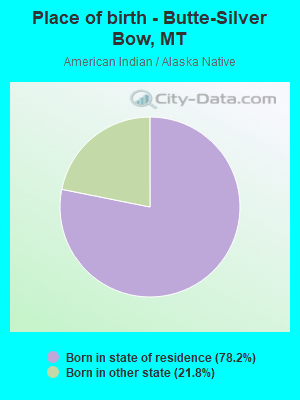
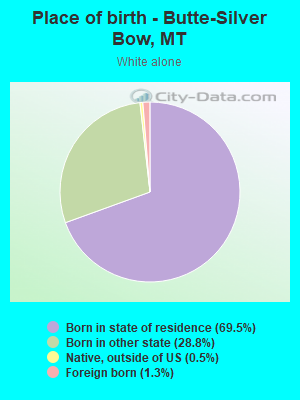
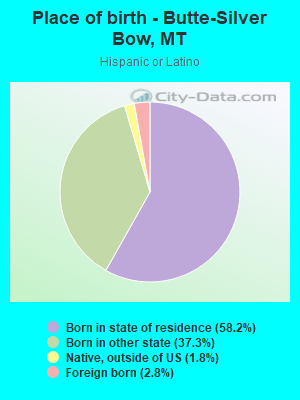
Place of birth - Born in state of residence (%)
Place of birth - Born in state of residence (%) - White
Place of birth - Born in state of residence (%) - Black or African American
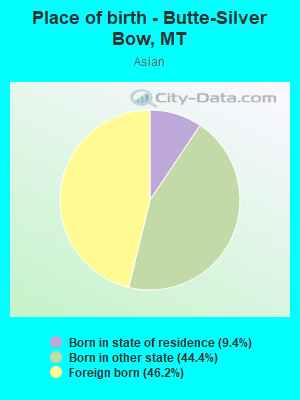
Place of birth - Born in state of residence (%) - Asian
Place of birth - Born in state of residence (%) - Hispanic or Latino
Place of birth - Born in state of residence (%) - American Indian and Alaska Native
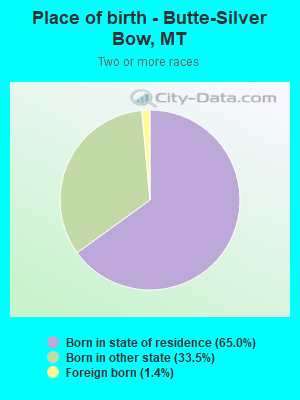
Place of birth - Born in state of residence (%) - Multirace
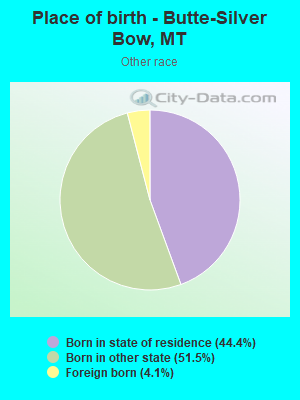
Place of birth - Born in state of residence (%) - Other Race
Place of birth - Born in other state (%)
Place of birth - Born in other state (%) - White
Place of birth - Born in other state (%) - Black or African American
Place of birth - Born in other state (%) - Asian
Place of birth - Born in other state (%) - Hispanic or Latino
Place of birth - Born in other state (%) - American Indian and Alaska Native
Place of birth - Born in other state (%) - Multirace
Place of birth - Born in other state (%) - Other Race
Place of birth - Native, outside of US (%)
Place of birth - Native, outside of US (%) - White
Place of birth - Native, outside of US (%) - Black or African American
Place of birth - Native, outside of US (%) - Asian
Place of birth - Native, outside of US (%) - Hispanic or Latino
Place of birth - Native, outside of US (%) - American Indian and Alaska Native
Place of birth - Native, outside of US (%) - Multirace
Place of birth - Native, outside of US (%) - Other Race
Place of birth - Foreign born (%)
Place of birth - Foreign born (%) - White
Place of birth - Foreign born (%) - Black or African American
Place of birth - Foreign born (%) - Asian
Place of birth - Foreign born (%) - Hispanic or Latino
Place of birth - Foreign born (%) - American Indian and Alaska Native
Place of birth - Foreign born (%) - Multirace
Place of birth - Foreign born (%) - Other Race
Residents speaking English at home (%)
Residents speaking English at home - Born in the United States (%)
Residents speaking English at home - Native, born elsewhere (%)
Residents speaking English at home - Foreign born (%)
Residents speaking Spanish at home (%)
Residents speaking Spanish at home - Born in the United States (%)
Residents speaking Spanish at home - Native, born elsewhere (%)
Residents speaking Spanish at home - Foreign born (%)
Residents speaking other language at home (%)
Residents speaking other language at home - Born in the United States (%)
Residents speaking other language at home - Native, born elsewhere (%)
Residents speaking other language at home - Foreign born (%)
Marital status - Never married (%)
Marital status - Now married (%)
Marital status - Separated (%)
Marital status - Widowed (%)
Marital status - Divorced (%)
Ancestries Reported - Arab (%)
Ancestries Reported - Czech (%)
Ancestries Reported - Danish (%)
Ancestries Reported - Dutch (%)
Ancestries Reported - English (%)
Ancestries Reported - French (%)
Ancestries Reported - French Canadian (%)
Ancestries Reported - German (%)
Ancestries Reported - Greek (%)
Ancestries Reported - Hungarian (%)
Ancestries Reported - Irish (%)
Ancestries Reported - Italian (%)
Ancestries Reported - Lithuanian (%)
Ancestries Reported - Norwegian (%)
Ancestries Reported - Polish (%)
Ancestries Reported - Portuguese (%)
Ancestries Reported - Russian (%)
Ancestries Reported - Scotch-Irish (%)
Ancestries Reported - Scottish (%)
Ancestries Reported - Slovak (%)
Ancestries Reported - Subsaharan African (%)
Ancestries Reported - Swedish (%)
Ancestries Reported - Swiss (%)
Ancestries Reported - Ukrainian (%)
Ancestries Reported - United States (%)
Ancestries Reported - Welsh (%)
Ancestries Reported - West Indian (%)
Ancestries Reported - Other (%)
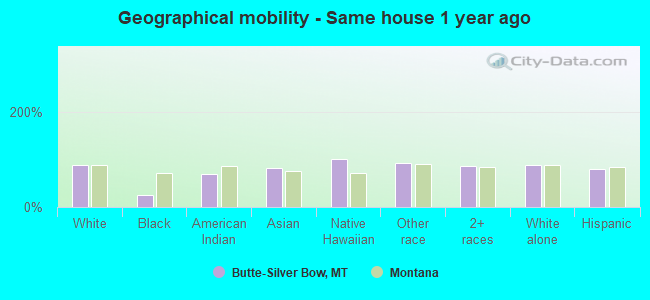
Geographical mobility - Same house 1 year ago (%)
Geographical mobility - Same house 1 year ago (%) - White
Geographical mobility - Same house 1 year ago (%) - Black or African American
Geographical mobility - Same house 1 year ago (%) - Asian
Geographical mobility - Same house 1 year ago (%) - Hispanic or Latino
Geographical mobility - Same house 1 year ago (%) - American Indian and Alaska Native
Geographical mobility - Same house 1 year ago (%) - Multirace
Geographical mobility - Same house 1 year ago (%) - Other Race
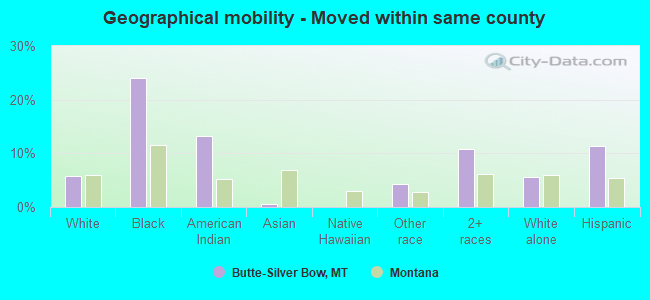
Geographical mobility - Moved within same county (%)
Geographical mobility - Moved within same county (%) - White
Geographical mobility - Moved within same county (%) - Black or African American
Geographical mobility - Moved within same county (%) - Asian
Geographical mobility - Moved within same county (%) - Hispanic or Latino
Geographical mobility - Moved within same county (%) - American Indian and Alaska Native
Geographical mobility - Moved within same county (%) - Multirace
Geographical mobility - Moved within same county (%) - Other Race
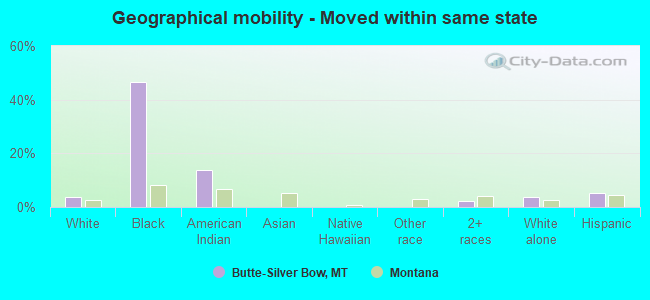
Geographical mobility - Moved from different county within same state (%)
Geographical mobility - Moved from different county within same state (%) - White
Geographical mobility - Moved from different county within same state (%) - Black or African American
Geographical mobility - Moved from different county within same state (%) - Asian
Geographical mobility - Moved from different county within same state (%) - Hispanic or Latino
Geographical mobility - Moved from different county within same state (%) - American Indian and Alaska Native
Geographical mobility - Moved from different county within same state (%) - Multirace
Geographical mobility - Moved from different county within same state (%) - Other Race
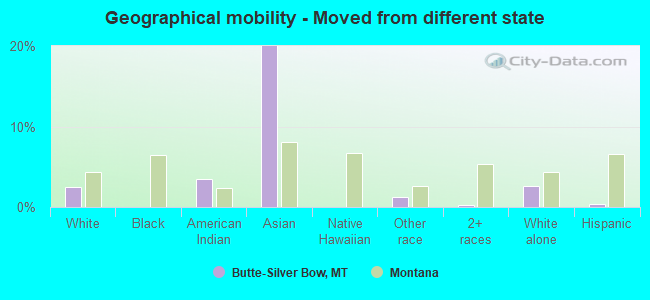
Geographical mobility - Moved from different state (%)
Geographical mobility - Moved from different state (%) - White
Geographical mobility - Moved from different state (%) - Black or African American
Geographical mobility - Moved from different state (%) - Asian
Geographical mobility - Moved from different state (%) - Hispanic or Latino
Geographical mobility - Moved from different state (%) - American Indian and Alaska Native
Geographical mobility - Moved from different state (%) - Multirace
Geographical mobility - Moved from different state (%) - Other Race
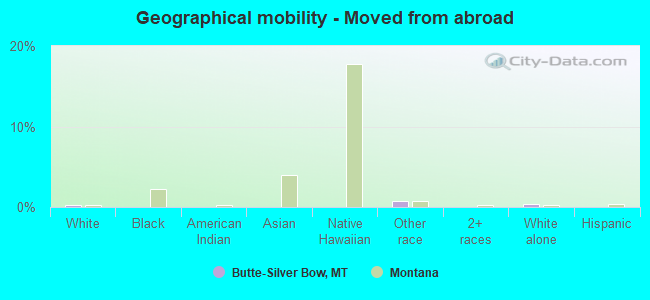
Geographical mobility - Moved from abroad (%)
Geographical mobility - Moved from abroad (%) - White
Geographical mobility - Moved from abroad (%) - Black or African American
Geographical mobility - Moved from abroad (%) - Asian
Geographical mobility - Moved from abroad (%) - Hispanic or Latino
Geographical mobility - Moved from abroad (%) - American Indian and Alaska Native
Geographical mobility - Moved from abroad (%) - Multirace
Geographical mobility - Moved from abroad (%) - Other Race
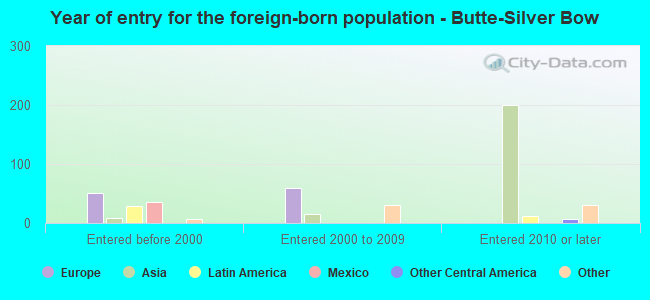
Place of birth for the foreign-born population - Ireland (%)
Place of birth for the foreign-born population - Denmark (%)
Place of birth for the foreign-born population - Norway (%)
Place of birth for the foreign-born population - Sweden (%)
Place of birth for the foreign-born population - United Kingdom (%)
Place of birth for the foreign-born population - England (%)
Place of birth for the foreign-born population - Scotland (%)
Place of birth for the foreign-born population - Other Northern Europe (%)
Place of birth for the foreign-born population - Austria (%)
Place of birth for the foreign-born population - Belgium (%)
Place of birth for the foreign-born population - France (%)
Place of birth for the foreign-born population - Germany (%)
Place of birth for the foreign-born population - Netherlands (%)
Place of birth for the foreign-born population - Switzerland (%)
Place of birth for the foreign-born population - Other Western Europe (%)
Place of birth for the foreign-born population - Greece (%)
Place of birth for the foreign-born population - Italy (%)
Place of birth for the foreign-born population - Portugal (%)
Place of birth for the foreign-born population - Spain (%)
Place of birth for the foreign-born population - Other Southern Europe (%)
Place of birth for the foreign-born population - Albania (%)
Place of birth for the foreign-born population - Belarus (%)
Place of birth for the foreign-born population - Bosnia and Herzegovina (%)
Place of birth for the foreign-born population - Bulgaria (%)
Place of birth for the foreign-born population - Croatia (%)
Place of birth for the foreign-born population - Czechoslovakia (%)
Place of birth for the foreign-born population - Hungary (%)
Place of birth for the foreign-born population - Latvia (%)
Place of birth for the foreign-born population - Lithuania (%)
Place of birth for the foreign-born population - North Macedonia (Macedonia) (%)
Place of birth for the foreign-born population - Moldova (%)
Place of birth for the foreign-born population - Poland (%)
Place of birth for the foreign-born population - Romania (%)
Place of birth for the foreign-born population - Russia (%)
Place of birth for the foreign-born population - Serbia (%)
Place of birth for the foreign-born population - Ukraine (%)
Place of birth for the foreign-born population - Other Eastern Europe (%)
Place of birth for the foreign-born population - China (%)
Place of birth for the foreign-born population - Hong Kong (%)
Place of birth for the foreign-born population - Taiwan (%)
Place of birth for the foreign-born population - Japan (%)
Place of birth for the foreign-born population - Korea (%)
Place of birth for the foreign-born population - Other Eastern Asia (%)
Place of birth for the foreign-born population - Afghanistan (%)
Place of birth for the foreign-born population - Bangladesh (%)
Place of birth for the foreign-born population - India (%)
Place of birth for the foreign-born population - Iran (%)
Place of birth for the foreign-born population - Kazakhstan (%)
Place of birth for the foreign-born population - Nepal (%)
Place of birth for the foreign-born population - Pakistan (%)
Place of birth for the foreign-born population - Sri Lanka (%)
Place of birth for the foreign-born population - Uzbekistan (%)
Place of birth for the foreign-born population - Other South Central Asia (%)
Place of birth for the foreign-born population - Burma (%)
Place of birth for the foreign-born population - Cambodia (%)
Place of birth for the foreign-born population - Indonesia (%)
Place of birth for the foreign-born population - Laos (%)
Place of birth for the foreign-born population - Malaysia (%)
Place of birth for the foreign-born population - Philippines (%)
Place of birth for the foreign-born population - Singapore (%)
Place of birth for the foreign-born population - Thailand (%)
Place of birth for the foreign-born population - Vietnam (%)
Place of birth for the foreign-born population - Other South Eastern Asia (%)
Place of birth for the foreign-born population - Armenia (%)
Place of birth for the foreign-born population - Iraq (%)
Place of birth for the foreign-born population - Israel (%)
Place of birth for the foreign-born population - Jordan (%)
Place of birth for the foreign-born population - Kuwait (%)
Place of birth for the foreign-born population - Lebanon (%)
Place of birth for the foreign-born population - Saudi Arabia (%)
Place of birth for the foreign-born population - Syria (%)
Place of birth for the foreign-born population - Turkey (%)
Place of birth for the foreign-born population - Yemen (%)
Place of birth for the foreign-born population - Other Western Asia (%)
Place of birth for the foreign-born population - Eritrea (%)
Place of birth for the foreign-born population - Ethiopia (%)
Place of birth for the foreign-born population - Kenya (%)
Place of birth for the foreign-born population - Somalia (%)
Place of birth for the foreign-born population - Uganda (%)
Place of birth for the foreign-born population - Zimbabwe (%)
Place of birth for the foreign-born population - Other Eastern Africa (%)
Place of birth for the foreign-born population - Cameroon (%)
Place of birth for the foreign-born population - Congo (%)
Place of birth for the foreign-born population - Democratic Republic of Congo (Zaire) (%)
Place of birth for the foreign-born population - Other Middle Africa (%)
Place of birth for the foreign-born population - Egypt (%)
Place of birth for the foreign-born population - Morocco (%)
Place of birth for the foreign-born population - Sudan (%)
Place of birth for the foreign-born population - Other Northern Africa (%)
Place of birth for the foreign-born population - South Africa (%)
Place of birth for the foreign-born population - Other Southern Africa (%)
Place of birth for the foreign-born population - Cabo Verde (%)
Place of birth for the foreign-born population - Ghana (%)
Place of birth for the foreign-born population - Liberia (%)
Place of birth for the foreign-born population - Nigeria (%)
Place of birth for the foreign-born population - Senegal (%)
Place of birth for the foreign-born population - Sierra Leone (%)
Place of birth for the foreign-born population - Other Western Africa (%)
Place of birth for the foreign-born population - Australia (%)
Place of birth for the foreign-born population - New Zealand (%)
Place of birth for the foreign-born population - Fiji (%)
Place of birth for the foreign-born population - Micronesia (%)
Place of birth for the foreign-born population - Bahamas (%)
Place of birth for the foreign-born population - Barbados (%)
Place of birth for the foreign-born population - Cuba (%)
Place of birth for the foreign-born population - Dominica (%)
Place of birth for the foreign-born population - Dominican Republic (%)
Place of birth for the foreign-born population - Grenada (%)
Place of birth for the foreign-born population - Haiti (%)
Place of birth for the foreign-born population - Jamaica (%)
Place of birth for the foreign-born population - St. Vincent and the Grenadines (%)
Place of birth for the foreign-born population - Trinidad and Tobago (%)
Place of birth for the foreign-born population - West Indies (%)
Place of birth for the foreign-born population - Other Caribbean (%)
Place of birth for the foreign-born population - Belize (%)
Place of birth for the foreign-born population - Costa Rica (%)
Place of birth for the foreign-born population - El Salvador (%)
Place of birth for the foreign-born population - Guatemala (%)
Place of birth for the foreign-born population - Honduras (%)
Place of birth for the foreign-born population - Mexico (%)
Place of birth for the foreign-born population - Nicaragua (%)
Place of birth for the foreign-born population - Panama (%)
Place of birth for the foreign-born population - Other Central America (%)
Place of birth for the foreign-born population - Argentina (%)
Place of birth for the foreign-born population - Bolivia (%)
Place of birth for the foreign-born population - Brazil (%)
Place of birth for the foreign-born population - Chile (%)
Place of birth for the foreign-born population - Colombia (%)
Place of birth for the foreign-born population - Ecuador (%)
Place of birth for the foreign-born population - Guyana (%)
Place of birth for the foreign-born population - Peru (%)
Place of birth for the foreign-born population - Uruguay (%)
Place of birth for the foreign-born population - Venezuela (%)
Place of birth for the foreign-born population - Other South America (%)
Place of birth for the foreign-born population - Canada (%)
Place of birth for the foreign-born population - Other Northern America (%)
Place of birth for the foreign-born population - Other (%)
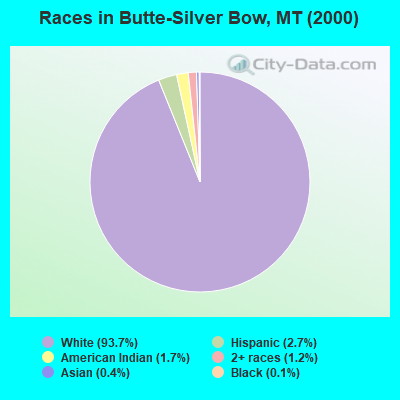
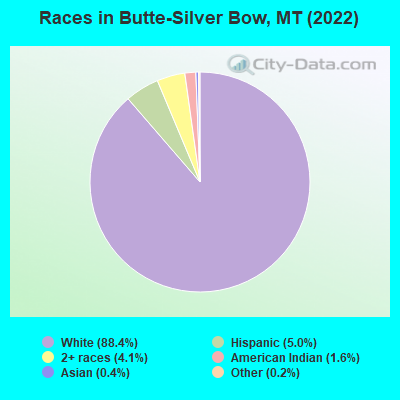
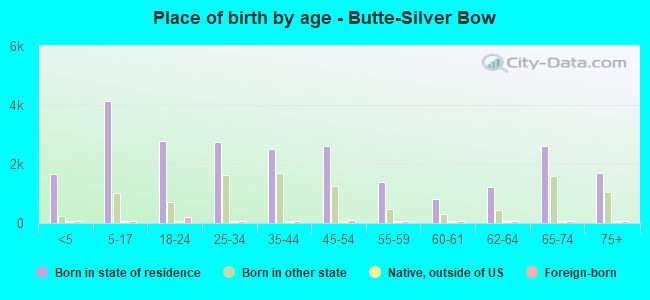
According to 2022 data, the most numerous races in Butte-Silver Bow, MT are White alone (31,489 residents), American Indian alone (569 residents), and Two or more races (1,465 residents). 97.0% of Butte-Silver Bow residents speak English at home. 1.5% of Butte-Silver Bow, MT residents are foreign-born , which is 35.4% less than the foreign-born rate of 2.0% across the entire state of Montana.
Race distribution in Butte-Silver Bow
2000 2022
807,823 89.5% White alone 54,426 6.0% American Indian alone 18,081 2.0% Hispanic 13,768 1.5% Two or more races 4,569 0.5% Asian alone 2,534 0.3% Black alone 569 0.06% Other race alone 425 0.05% Native Hawaiian and Other
937,365 83.5% White alone 58,748 5.2% American Indian alone 55,172 4.9% Two or more races 49,830 4.4% Hispanic 9,012 0.8% Other race alone 7,700 0.7% Asian alone 3,428 0.3% Black alone 1,612 0.1% Native Hawaiian and Other
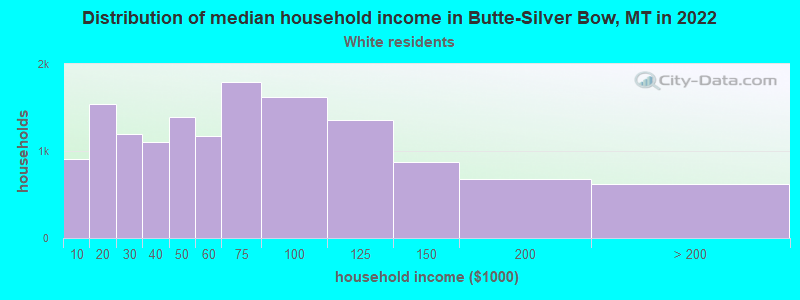
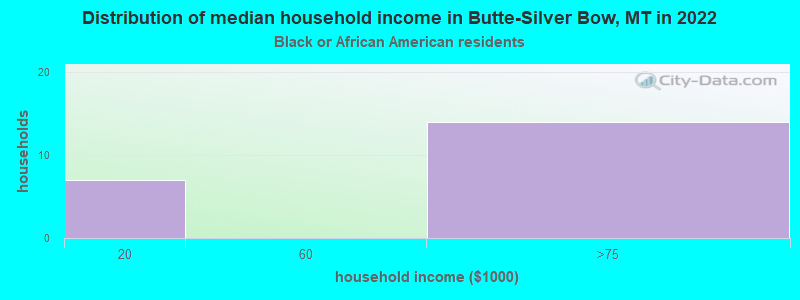
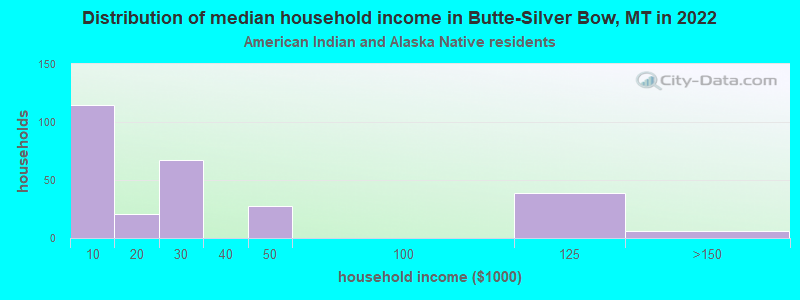
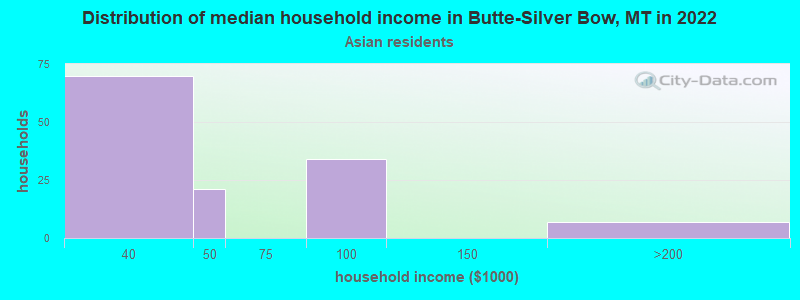
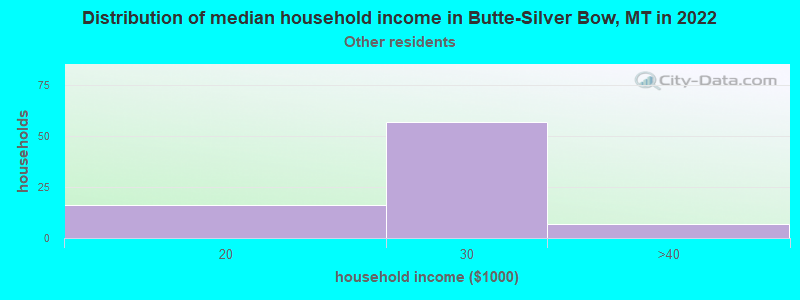
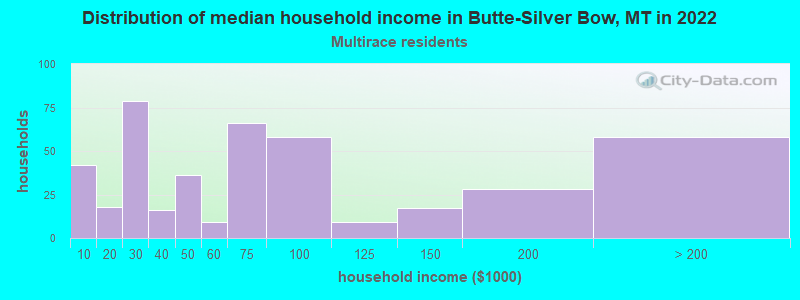
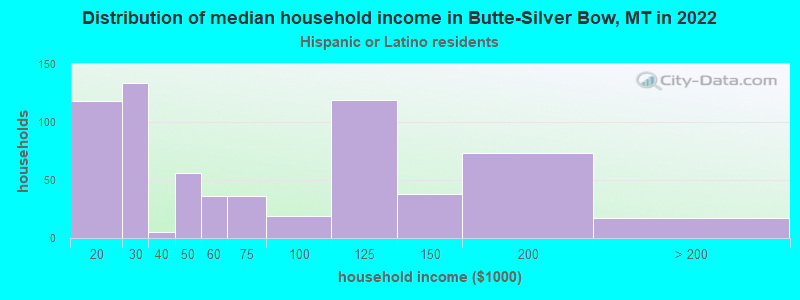
Income and house value in Butte-Silver Bow Median household income in 2022 $58,731 White non-Hispanic householders$25,081 American Indian and Alaska Native householders$35,778 Asian householders$22,312 Some other race householders$63,177 Two or more races householdersMedian 2022 house value $242,066 White Non-Hispanic householders$112,308 American Indian or Alaska Native householders $142,765 Asian householders$269,668 Native Hawaiian and other Pacific Islander householders$194,478 Some other race householders$223,348 Two or more races householders$197,650 Hispanic or Latino householders
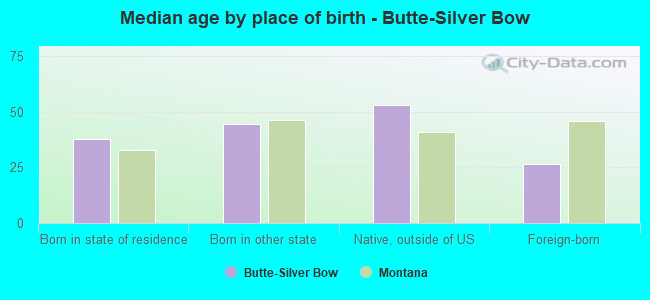
Median age by race in Butte-Silver Bow
41.4 Median age for White residents39.6 42.7 41.8 Median age for Black or African American residents43.0 36.0 30.5 Median age for American Indian / Alaska Native residents34.8 29.2 31.4 Median age for Asian residents25.5 38.7 -666,666,666.0 Median age for Native Hawaiian / Pacific Islander residents-668,724,279.2 -670,599,802.7 32.1 Median age for Other race residents33.4 30.7 22.9 Median age for Two or more races residents17.0 31.5 41.5 Median age for White alone residents39.8 43.0 31.2 Median age for Hispanic or Latino residents30.9 33.9
Owner/renter occupied households by race in Butte-Silver Bow
House owners and renters - White residents 10,242 71.5% Owner occupied4,082 28.5% Renter occupiedHouse owners and renters - Black or African American residents 18 100.0% Renter occupiedHouse owners and renters - American Indian / Alaska Native residents 63 23.2% Owner occupied210 76.8% Renter occupiedHouse owners and renters - Asian residents 59 46.7% Owner occupied67 53.3% Renter occupiedHouse owners and renters - Other race residents 41 50.4% Owner occupied40 49.6% Renter occupiedHouse owners and renters - Two or more races residents 307 65.7% Owner occupied160 34.3% Renter occupiedHouse owners and renters - White alone residents 9,948 71.3% Owner occupied4,011 28.7% Renter occupiedHouse owners and renters - Hispanic or Latino residents 446 70.5% Owner occupied187 29.5% Renter occupied
Language usage in Butte-Silver Bow
English speakers - Total 97.0% of residents of Butte-Silver Bow speak English at home.
1.1% of residents speak Spanish at home 45 12.4% Speak English very well318 87.6% Speak English less than very well2.0% of residents speak other language at home 352 51.4% Speak English very well333 48.6% Speak English less than very well
English speakers - Born in the United States 98.2% of residents of Butte-Silver Bow speak English at home.
0.9% of residents speak Spanish at home 5 5.7% Speak English very well83 94.3% Speak English less than very well0.8% of residents speak other language at home 71 87.7% Speak English very well10 12.3% Speak English less than very well
English speakers - Native, born elsewhere 77.9% of residents of Butte-Silver Bow speak English at home.
36.9% of residents speak Spanish at home 72 100.0% Speak English less than very well
English speakers - Foreign-born 31.1% of residents of Butte-Silver Bow speak English at home.
9.9% of residents speak Spanish at home 8 14.8% Speak English very well46 85.2% Speak English less than very well58.3% of residents speak other language at home 97 30.4% Speak English very well222 69.6% Speak English less than very well
White (Caucasian) - Speak only English Native:
98.2% (29,934)Foreign-born:
32.2% (130)
White (Caucasian) - Speak another language Native:
1.8% (547)Foreign-born:
56.6% (227)
Asian - Speak only English Native:
100.0% (80)Foreign-born:
32.9% (23)
Asian - Speak another language Native:
0.7% (1)Foreign-born:
65.1% (45)
Other race - Speak another language Native:
4.3% (8)Foreign-born:
94.9% (9)
Two or more races - Speak only English Native:
99.0% (1,680)Foreign-born:
53.1% (16)
Two or more races - Speak another language Native:
0.5% (9)Foreign-born:
14.7% (4)
White alone - Speak only English Native:
98.8% (29,320)Foreign-born:
34.2% (133)
White alone - Speak another language Native:
1.0% (309)Foreign-born:
57.3% (224)
Hispanic or Latino - Speak another language Native:
15.0% (233)Foreign-born:
100.0% (49)
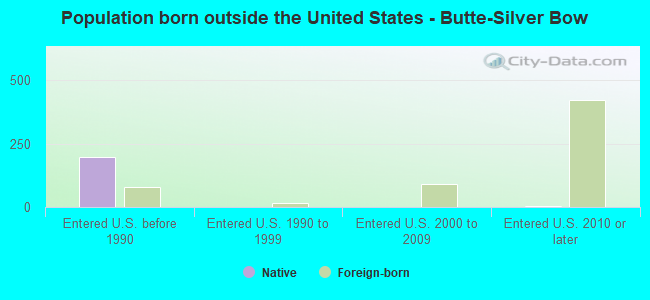
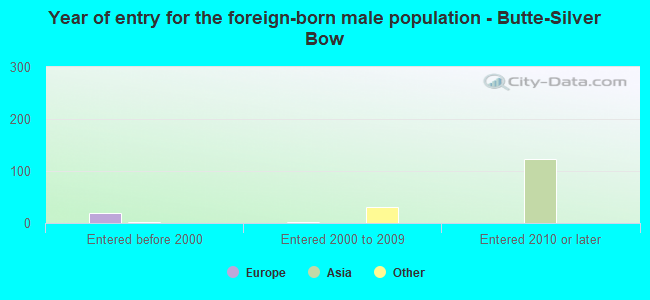
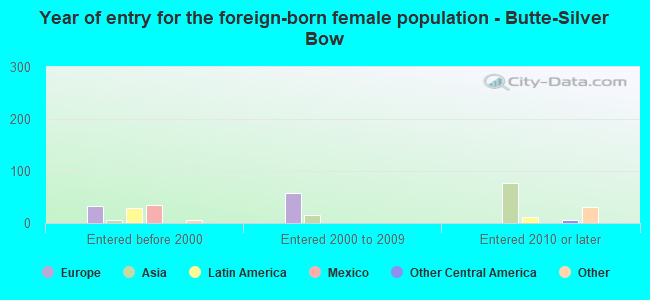
Foreign-born residents in Butte-Silver Bow 526 residents are foreign born
This city:
1.5%Montana:
2.3%
Marital status for residents in Butte-Silver Bow Marital status - White (Caucasian) population 15 years and over
Males 38.4% Never married44.6% Now married1.1% Separated2.9% Widowed13.0% DivorcedFemales 24.7% Never married46.2% Now married1.8% Separated10.4% Widowed17.0% DivorcedWomen who gave birth in the past 12 months Now married:
61.3% (116)Unmarried:
38.7% (73)
Women who did not give birth in the past 12 months Now married:
43.7% (2,961)Unmarried:
56.3% (3,817)
Marital status - Black or African American population 15 years and over
Males 100.0% Never married0.0% Now married0.0% Separated0.0% Widowed0.0% DivorcedFemales 100.0% Never married0.0% Now married0.0% Separated0.0% Widowed0.0% DivorcedWomen who did not give birth in the past 12 months Now married:
0.0% (0)Unmarried:
100.0% (17)
Marital status - American Indian / Alaska Native population 15 years and over
Males 46.9% Never married22.6% Now married1.4% Separated0.0% Widowed29.1% DivorcedFemales 40.4% Never married49.0% Now married0.0% Separated0.0% Widowed10.6% DivorcedWomen who gave birth in the past 12 months Now married:
100.0% (23)Unmarried:
0.0% (0)
Women who did not give birth in the past 12 months Now married:
19.8% (23)Unmarried:
80.2% (92)
Marital status - Asian population 15 years and over
Males 64.8% Never married35.2% Now married0.0% Separated0.0% Widowed0.0% DivorcedFemales 48.5% Never married40.9% Now married0.0% Separated0.0% Widowed10.6% DivorcedWomen who did not give birth in the past 12 months Now married:
25.6% (11)Unmarried:
74.4% (33)
Marital status - Other race population 15 years and over
Males 56.3% Never married14.1% Now married0.0% Separated0.0% Widowed29.6% DivorcedFemales 41.2% Never married48.8% Now married0.0% Separated10.0% Widowed0.0% DivorcedWomen who did not give birth in the past 12 months Now married:
54.2% (56)Unmarried:
45.8% (47)
Marital status - Two or more races population 15 years and over
Males 62.2% Never married26.4% Now married0.0% Separated0.0% Widowed11.4% DivorcedFemales 40.6% Never married38.7% Now married0.0% Separated3.9% Widowed16.8% DivorcedWomen who gave birth in the past 12 months Now married:
100.0% (10)Unmarried:
0.0% (0)
Women who did not give birth in the past 12 months Now married:
25.2% (92)Unmarried:
74.8% (272)
Marital status - White alone, not Hispanic / Latino population 15 years and over
Males 38.1% Never married44.7% Now married1.2% Separated2.9% Widowed13.1% DivorcedFemales 24.9% Never married47.0% Now married1.4% Separated10.2% Widowed16.5% DivorcedWomen who gave birth in the past 12 months Now married:
68.7% (116)Unmarried:
31.3% (53)
Women who did not give birth in the past 12 months Now married:
43.4% (2,859)Unmarried:
56.6% (3,722)
Marital status - Hispanic or Latino population 15 years and over
Males 57.3% Never married35.0% Now married0.0% Separated0.4% Widowed7.3% DivorcedFemales 21.1% Never married36.3% Now married9.3% Separated9.7% Widowed23.6% DivorcedWomen who gave birth in the past 12 months Now married:
54.5% (28)Unmarried:
45.5% (24)
Women who did not give birth in the past 12 months Now married:
54.4% (225)Unmarried:
45.6% (189)
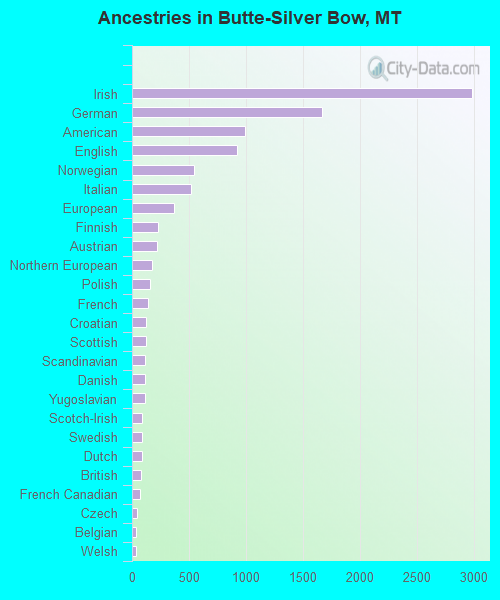
Ancestries in Butte-Silver Bow
2,986 22.9% Irish1,667 12.8% German993 7.6% American918 7.0% English548 4.2% Norwegian518 4.0% Italian370 2.8% European226 1.7% Finnish218 1.7% Austrian179 1.4% Northern European162 1.2% Polish138 1.1% French124 1.0% Croatian122 0.9% Scottish117 0.9% Scandinavian115 0.9% Danish111 0.9% Yugoslavian92 0.7% Scotch-Irish87 0.7% Swedish86 0.7% Dutch79 0.6% British67 0.5% French Canadian47 0.4% Czech36 0.3% Belgian35 0.3% Welsh33 0.3% Slovene33 0.3% Swiss29 0.2% Canadian18 0.1% Portuguese18 0.1% Russian18 0.1% Serbian16 0.1% Armenian16 0.1% Ukrainian15 0.1% Slavic13 0.10% Lebanese11 0.08% German Russian11 0.08% African6 0.05% Slovak2 0.02% Basque2 0.02% Iranian1 0.01% Hungarian
Geographical mobility in Butte-Silver Bow Same house 1 year ago 28,181 87.4% White (Caucasian)13 24.8% Black or African American452 69.2% American Indian / Alaska Native142 80.6% Asian4 100.0% Native Hawaiian / Pacific Islander201 93.3% Other race1,724 84.9% Two or more races27,444 87.6% White alone, not Hispanic / Latino1,403 80.0% Hispanic or LatinoMoved within same county 1,852 5.7% White / Caucasian13 24.1% Black or African American86 13.1% American Indian / Alaska Native1 0.5% Asian9 4.3% Other race220 10.8% Two or more races1,740 5.6% White alone, not Hispanic / Latino199 11.4% Hispanic or LatinoMoved within same state 1,193 3.7% White / Caucasian24 46.5% Black or African American91 13.9% American Indian / Alaska Native48 2.4% Two or more races1,144 3.7% White alone, not Hispanic / Latino91 5.2% Hispanic or LatinoMoved from different state 820 2.5% White / Caucasian23 3.5% American Indian / Alaska Native35 20.0% Asian3 1.3% Other race6 0.3% Two or more races824 2.6% White alone, not Hispanic / Latino6 0.4% Hispanic or LatinoMoved from abroad 98 0.3% White2 0.7% Other race1 0.0% Two or more races106 0.3% White alone, not Hispanic / Latino
Children Nativity (place of birth) in Butte-Silver Bow
Children under 6 years - Living with two parents Both parents native 1,360 100.0% NativeOne native, one foreign-born parent 12 100.0% NativeChildren under 6 years - Living with one parent Native parent 691 100.0% NativeChildren 6 to 17 years - Living with two parents Both parents native 2,861 100.0% NativeOne native, one foreign-born parent 27 54.6% Native22 45.4% Foreign-bornChildren 6 to 17 years - Living with one parent Native parent 1,632 100.0% Native
Grandparents responsible for own grandchildren in Butte-Silver Bow
Grandparents (30 to 59 years) White / Caucasian 67 31.4% Responsible for grandchildren145 68.6% Not responsible for grandchildrenWhite alone, not Hispanic / Latino 71 32.4% Responsible for grandchildren147 67.6% Not responsible for grandchildrenGrandparents (60 years and over) White / Caucasian 116 32.6% Responsible for grandchildren240 67.4% Not responsible for grandchildrenWhite alone, not Hispanic / Latino 93 28.0% Responsible for grandchildren240 72.0% Not responsible for grandchildren