Races in Calverton, Maryland (MD) Detailed Stats
Data:
Races - White alone (%)
Races - White alone (% change since 2000)
Races - Black alone (%)
Races - Black alone (% change since 2000)
Races - American Indian alone (%)
Races - American Indian alone (% change since 2000)
Races - Asian alone (%)
Races - Asian alone (% change since 2000)
Races - Hispanic (%)
Races - Hispanic (% change since 2000)
Races - Native Hawaiian and Other Pacific Islander alone (%)
Races - Native Hawaiian and Other Pacific Islander alone (% change since 2000)
Races - Two or more races(%)
Races - Two or more races(% change since 2000)
Races - Other race alone (%)
Races - Other race alone (% change since 2000)
Racial diversity
Place of birth - Born in state of residence (%)
Place of birth - Born in state of residence (%) - White
Place of birth - Born in state of residence (%) - Black or African American
Place of birth - Born in state of residence (%) - Asian
Place of birth - Born in state of residence (%) - Hispanic or Latino
Place of birth - Born in state of residence (%) - American Indian and Alaska Native
Place of birth - Born in state of residence (%) - Multirace
Place of birth - Born in state of residence (%) - Other Race
Place of birth - Born in other state (%)
Place of birth - Born in other state (%) - White
Place of birth - Born in other state (%) - Black or African American
Place of birth - Born in other state (%) - Asian
Place of birth - Born in other state (%) - Hispanic or Latino
Place of birth - Born in other state (%) - American Indian and Alaska Native
Place of birth - Born in other state (%) - Multirace
Place of birth - Born in other state (%) - Other Race
Place of birth - Native, outside of US (%)
Place of birth - Native, outside of US (%) - White
Place of birth - Native, outside of US (%) - Black or African American
Place of birth - Native, outside of US (%) - Asian
Place of birth - Native, outside of US (%) - Hispanic or Latino
Place of birth - Native, outside of US (%) - American Indian and Alaska Native
Place of birth - Native, outside of US (%) - Multirace
Place of birth - Native, outside of US (%) - Other Race
Place of birth - Foreign born (%)
Place of birth - Foreign born (%) - White
Place of birth - Foreign born (%) - Black or African American
Place of birth - Foreign born (%) - Asian
Place of birth - Foreign born (%) - Hispanic or Latino
Place of birth - Foreign born (%) - American Indian and Alaska Native
Place of birth - Foreign born (%) - Multirace
Place of birth - Foreign born (%) - Other Race
Residents speaking English at home (%)
Residents speaking English at home - Born in the United States (%)
Residents speaking English at home - Native, born elsewhere (%)
Residents speaking English at home - Foreign born (%)
Residents speaking Spanish at home (%)
Residents speaking Spanish at home - Born in the United States (%)
Residents speaking Spanish at home - Native, born elsewhere (%)
Residents speaking Spanish at home - Foreign born (%)
Residents speaking other language at home (%)
Residents speaking other language at home - Born in the United States (%)
Residents speaking other language at home - Native, born elsewhere (%)
Residents speaking other language at home - Foreign born (%)
Marital status - Never married (%)
Marital status - Now married (%)
Marital status - Separated (%)
Marital status - Widowed (%)
Marital status - Divorced (%)
Ancestries Reported - Arab (%)
Ancestries Reported - Czech (%)
Ancestries Reported - Danish (%)
Ancestries Reported - Dutch (%)
Ancestries Reported - English (%)
Ancestries Reported - French (%)
Ancestries Reported - French Canadian (%)
Ancestries Reported - German (%)
Ancestries Reported - Greek (%)
Ancestries Reported - Hungarian (%)
Ancestries Reported - Irish (%)
Ancestries Reported - Italian (%)
Ancestries Reported - Lithuanian (%)
Ancestries Reported - Norwegian (%)
Ancestries Reported - Polish (%)
Ancestries Reported - Portuguese (%)
Ancestries Reported - Russian (%)
Ancestries Reported - Scotch-Irish (%)
Ancestries Reported - Scottish (%)
Ancestries Reported - Slovak (%)
Ancestries Reported - Subsaharan African (%)
Ancestries Reported - Swedish (%)
Ancestries Reported - Swiss (%)
Ancestries Reported - Ukrainian (%)
Ancestries Reported - United States (%)
Ancestries Reported - Welsh (%)
Ancestries Reported - West Indian (%)
Ancestries Reported - Other (%)
Geographical mobility - Same house 1 year ago (%)
Geographical mobility - Same house 1 year ago (%) - White
Geographical mobility - Same house 1 year ago (%) - Black or African American
Geographical mobility - Same house 1 year ago (%) - Asian
Geographical mobility - Same house 1 year ago (%) - Hispanic or Latino
Geographical mobility - Same house 1 year ago (%) - American Indian and Alaska Native
Geographical mobility - Same house 1 year ago (%) - Multirace
Geographical mobility - Same house 1 year ago (%) - Other Race
Geographical mobility - Moved within same county (%)
Geographical mobility - Moved within same county (%) - White
Geographical mobility - Moved within same county (%) - Black or African American
Geographical mobility - Moved within same county (%) - Asian
Geographical mobility - Moved within same county (%) - Hispanic or Latino
Geographical mobility - Moved within same county (%) - American Indian and Alaska Native
Geographical mobility - Moved within same county (%) - Multirace
Geographical mobility - Moved within same county (%) - Other Race
Geographical mobility - Moved from different county within same state (%)
Geographical mobility - Moved from different county within same state (%) - White
Geographical mobility - Moved from different county within same state (%) - Black or African American
Geographical mobility - Moved from different county within same state (%) - Asian
Geographical mobility - Moved from different county within same state (%) - Hispanic or Latino
Geographical mobility - Moved from different county within same state (%) - American Indian and Alaska Native
Geographical mobility - Moved from different county within same state (%) - Multirace
Geographical mobility - Moved from different county within same state (%) - Other Race
Geographical mobility - Moved from different state (%)
Geographical mobility - Moved from different state (%) - White
Geographical mobility - Moved from different state (%) - Black or African American
Geographical mobility - Moved from different state (%) - Asian
Geographical mobility - Moved from different state (%) - Hispanic or Latino
Geographical mobility - Moved from different state (%) - American Indian and Alaska Native
Geographical mobility - Moved from different state (%) - Multirace
Geographical mobility - Moved from different state (%) - Other Race
Geographical mobility - Moved from abroad (%)
Geographical mobility - Moved from abroad (%) - White
Geographical mobility - Moved from abroad (%) - Black or African American
Geographical mobility - Moved from abroad (%) - Asian
Geographical mobility - Moved from abroad (%) - Hispanic or Latino
Geographical mobility - Moved from abroad (%) - American Indian and Alaska Native
Geographical mobility - Moved from abroad (%) - Multirace
Geographical mobility - Moved from abroad (%) - Other Race
Place of birth for the foreign-born population - Ireland (%)
Place of birth for the foreign-born population - Denmark (%)
Place of birth for the foreign-born population - Norway (%)
Place of birth for the foreign-born population - Sweden (%)
Place of birth for the foreign-born population - United Kingdom (%)
Place of birth for the foreign-born population - England (%)
Place of birth for the foreign-born population - Scotland (%)
Place of birth for the foreign-born population - Other Northern Europe (%)
Place of birth for the foreign-born population - Austria (%)
Place of birth for the foreign-born population - Belgium (%)
Place of birth for the foreign-born population - France (%)
Place of birth for the foreign-born population - Germany (%)
Place of birth for the foreign-born population - Netherlands (%)
Place of birth for the foreign-born population - Switzerland (%)
Place of birth for the foreign-born population - Other Western Europe (%)
Place of birth for the foreign-born population - Greece (%)
Place of birth for the foreign-born population - Italy (%)
Place of birth for the foreign-born population - Portugal (%)
Place of birth for the foreign-born population - Spain (%)
Place of birth for the foreign-born population - Other Southern Europe (%)
Place of birth for the foreign-born population - Albania (%)
Place of birth for the foreign-born population - Belarus (%)
Place of birth for the foreign-born population - Bosnia and Herzegovina (%)
Place of birth for the foreign-born population - Bulgaria (%)
Place of birth for the foreign-born population - Croatia (%)
Place of birth for the foreign-born population - Czechoslovakia (%)
Place of birth for the foreign-born population - Hungary (%)
Place of birth for the foreign-born population - Latvia (%)
Place of birth for the foreign-born population - Lithuania (%)
Place of birth for the foreign-born population - North Macedonia (Macedonia) (%)
Place of birth for the foreign-born population - Moldova (%)
Place of birth for the foreign-born population - Poland (%)
Place of birth for the foreign-born population - Romania (%)
Place of birth for the foreign-born population - Russia (%)
Place of birth for the foreign-born population - Serbia (%)
Place of birth for the foreign-born population - Ukraine (%)
Place of birth for the foreign-born population - Other Eastern Europe (%)
Place of birth for the foreign-born population - China (%)
Place of birth for the foreign-born population - Hong Kong (%)
Place of birth for the foreign-born population - Taiwan (%)
Place of birth for the foreign-born population - Japan (%)
Place of birth for the foreign-born population - Korea (%)
Place of birth for the foreign-born population - Other Eastern Asia (%)
Place of birth for the foreign-born population - Afghanistan (%)
Place of birth for the foreign-born population - Bangladesh (%)
Place of birth for the foreign-born population - India (%)
Place of birth for the foreign-born population - Iran (%)
Place of birth for the foreign-born population - Kazakhstan (%)
Place of birth for the foreign-born population - Nepal (%)
Place of birth for the foreign-born population - Pakistan (%)
Place of birth for the foreign-born population - Sri Lanka (%)
Place of birth for the foreign-born population - Uzbekistan (%)
Place of birth for the foreign-born population - Other South Central Asia (%)
Place of birth for the foreign-born population - Burma (%)
Place of birth for the foreign-born population - Cambodia (%)
Place of birth for the foreign-born population - Indonesia (%)
Place of birth for the foreign-born population - Laos (%)
Place of birth for the foreign-born population - Malaysia (%)
Place of birth for the foreign-born population - Philippines (%)
Place of birth for the foreign-born population - Singapore (%)
Place of birth for the foreign-born population - Thailand (%)
Place of birth for the foreign-born population - Vietnam (%)
Place of birth for the foreign-born population - Other South Eastern Asia (%)
Place of birth for the foreign-born population - Armenia (%)
Place of birth for the foreign-born population - Iraq (%)
Place of birth for the foreign-born population - Israel (%)
Place of birth for the foreign-born population - Jordan (%)
Place of birth for the foreign-born population - Kuwait (%)
Place of birth for the foreign-born population - Lebanon (%)
Place of birth for the foreign-born population - Saudi Arabia (%)
Place of birth for the foreign-born population - Syria (%)
Place of birth for the foreign-born population - Turkey (%)
Place of birth for the foreign-born population - Yemen (%)
Place of birth for the foreign-born population - Other Western Asia (%)
Place of birth for the foreign-born population - Eritrea (%)
Place of birth for the foreign-born population - Ethiopia (%)
Place of birth for the foreign-born population - Kenya (%)
Place of birth for the foreign-born population - Somalia (%)
Place of birth for the foreign-born population - Uganda (%)
Place of birth for the foreign-born population - Zimbabwe (%)
Place of birth for the foreign-born population - Other Eastern Africa (%)
Place of birth for the foreign-born population - Cameroon (%)
Place of birth for the foreign-born population - Congo (%)
Place of birth for the foreign-born population - Democratic Republic of Congo (Zaire) (%)
Place of birth for the foreign-born population - Other Middle Africa (%)
Place of birth for the foreign-born population - Egypt (%)
Place of birth for the foreign-born population - Morocco (%)
Place of birth for the foreign-born population - Sudan (%)
Place of birth for the foreign-born population - Other Northern Africa (%)
Place of birth for the foreign-born population - South Africa (%)
Place of birth for the foreign-born population - Other Southern Africa (%)
Place of birth for the foreign-born population - Cabo Verde (%)
Place of birth for the foreign-born population - Ghana (%)
Place of birth for the foreign-born population - Liberia (%)
Place of birth for the foreign-born population - Nigeria (%)
Place of birth for the foreign-born population - Senegal (%)
Place of birth for the foreign-born population - Sierra Leone (%)
Place of birth for the foreign-born population - Other Western Africa (%)
Place of birth for the foreign-born population - Australia (%)
Place of birth for the foreign-born population - New Zealand (%)
Place of birth for the foreign-born population - Fiji (%)
Place of birth for the foreign-born population - Micronesia (%)
Place of birth for the foreign-born population - Bahamas (%)
Place of birth for the foreign-born population - Barbados (%)
Place of birth for the foreign-born population - Cuba (%)
Place of birth for the foreign-born population - Dominica (%)
Place of birth for the foreign-born population - Dominican Republic (%)
Place of birth for the foreign-born population - Grenada (%)
Place of birth for the foreign-born population - Haiti (%)
Place of birth for the foreign-born population - Jamaica (%)
Place of birth for the foreign-born population - St. Vincent and the Grenadines (%)
Place of birth for the foreign-born population - Trinidad and Tobago (%)
Place of birth for the foreign-born population - West Indies (%)
Place of birth for the foreign-born population - Other Caribbean (%)
Place of birth for the foreign-born population - Belize (%)
Place of birth for the foreign-born population - Costa Rica (%)
Place of birth for the foreign-born population - El Salvador (%)
Place of birth for the foreign-born population - Guatemala (%)
Place of birth for the foreign-born population - Honduras (%)
Place of birth for the foreign-born population - Mexico (%)
Place of birth for the foreign-born population - Nicaragua (%)
Place of birth for the foreign-born population - Panama (%)
Place of birth for the foreign-born population - Other Central America (%)
Place of birth for the foreign-born population - Argentina (%)
Place of birth for the foreign-born population - Bolivia (%)
Place of birth for the foreign-born population - Brazil (%)
Place of birth for the foreign-born population - Chile (%)
Place of birth for the foreign-born population - Colombia (%)
Place of birth for the foreign-born population - Ecuador (%)
Place of birth for the foreign-born population - Guyana (%)
Place of birth for the foreign-born population - Peru (%)
Place of birth for the foreign-born population - Uruguay (%)
Place of birth for the foreign-born population - Venezuela (%)
Place of birth for the foreign-born population - Other South America (%)
Place of birth for the foreign-born population - Canada (%)
Place of birth for the foreign-born population - Other Northern America (%)
Place of birth for the foreign-born population - Other (%)
Latest news about races in Calverton, MD collected exclusively by city-data.com from local newspapers, TV, and radio stations
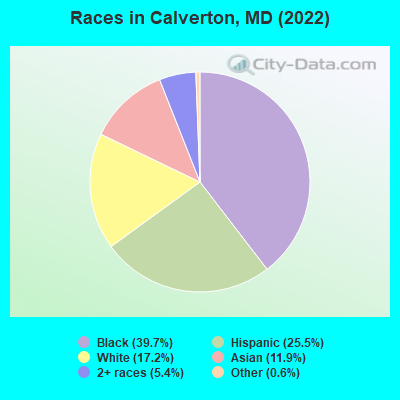
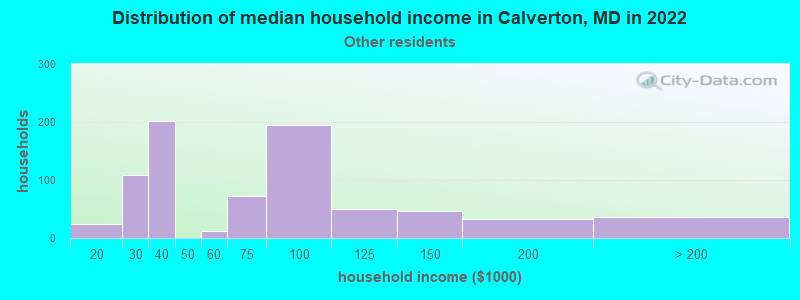
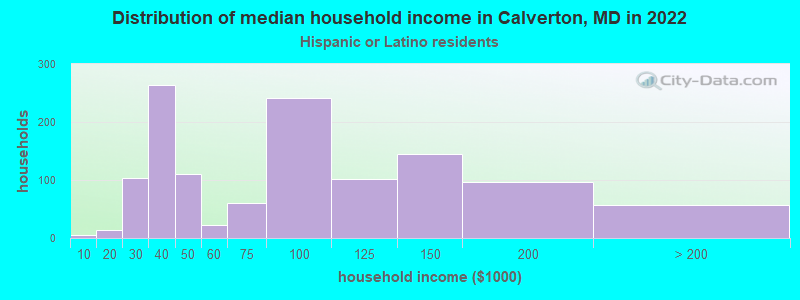
According to 2022 data, the most numerous races in Calverton, MD are White alone (3,123 residents), Black alone (7,202 residents), and Hispanic (4,623 residents). 47.9% of Calverton residents speak English at home. 45.0% of Calverton, MD residents are foreign-born (17.3% born in Latin America, 15.0% born in Africa, 8.8% born in Asia), which is 64.5% greater than the foreign-born rate of 16.0% across the entire state of Maryland.
Race distribution in Calverton
2000 2022
3,286,547 62.1% White alone 1,464,735 27.7% Black alone 227,916 4.3% Hispanic 209,738 4.0% Asian alone 82,946 1.6% Two or more races 13,312 0.3% American Indian alone 9,379 0.2% Other race alone 1,913 0.04% Native Hawaiian and Other
2,906,492 47.1% White alone 1,800,914 29.2% Black alone 705,842 11.4% Hispanic 401,818 6.5% Asian alone 291,317 4.7% Two or more races 46,930 0.8% Other race alone 8,930 0.1% American Indian alone 2,417 0.04% Native Hawaiian and Other
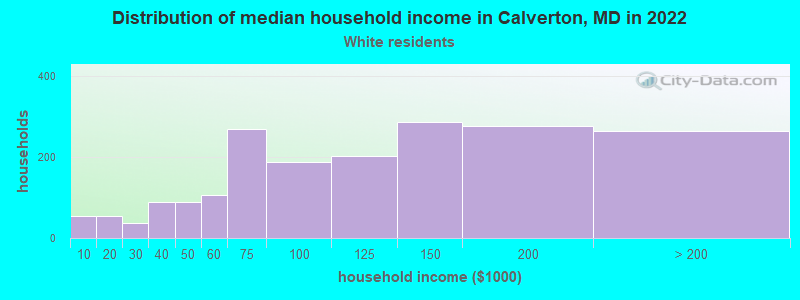
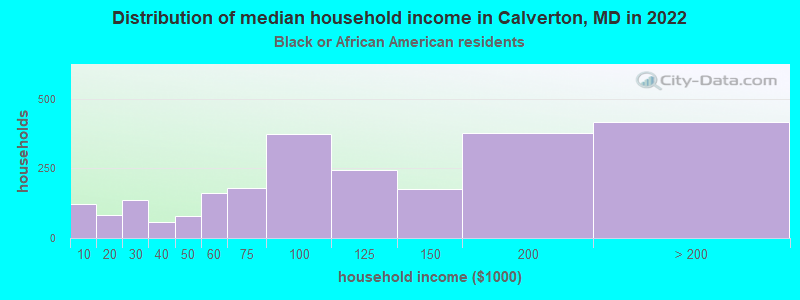
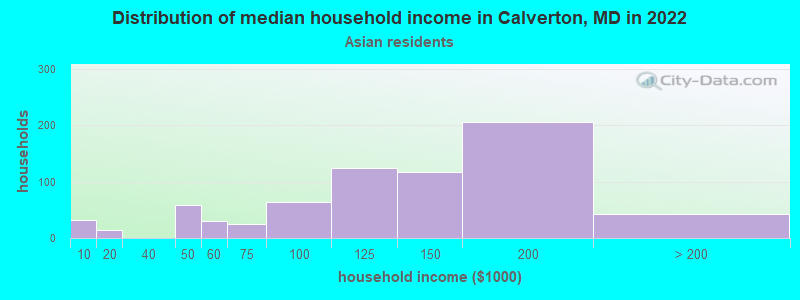
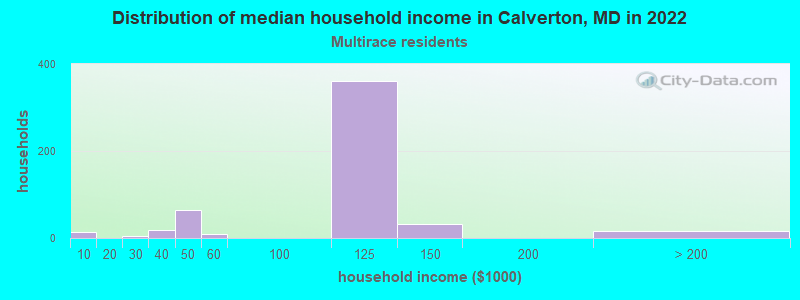
Income and house value in Calverton Median household income in 2022 $105,164 White non-Hispanic householders$95,286 Black householders$117,008 Asian householders$79,282 Some other race householders$108,600 Two or more races householders$82,671 Hispanic or Latino race householdersMedian 2022 house value $496,585 White Non-Hispanic householders$460,538 Black or African American householders $472,073 Asian householders$450,733 Some other race householders$473,226 Two or more races householders$483,608 Hispanic or Latino householders
Median age by race in Calverton
59.6 Median age for White residents58.2 60.7 44.8 Median age for Black or African American residents46.0 44.3 -780,410,741.7 Median age for American Indian / Alaska Native residents-888,297,871.5 -689,905,591.2 48.2 Median age for Asian residents48.6 46.4 -571,600,480.8 Median age for Native Hawaiian / Pacific Islander residents-720,061,021.4 -760,942,760.2 29.6 Median age for Other race residents31.4 19.1 34.1 Median age for Two or more races residents37.6 20.6 66.1 Median age for White alone residents61.6 66.7 30.0 Median age for Hispanic or Latino residents30.7 27.5
Owner/renter occupied households by race in Calverton
House owners and renters - White residents 1,130 57.1% Owner occupied850 42.9% Renter occupiedHouse owners and renters - Black or African American residents 1,719 70.0% Owner occupied737 30.0% Renter occupiedHouse owners and renters - Asian residents 673 88.2% Owner occupied90 11.8% Renter occupiedHouse owners and renters - Other race residents 495 73.8% Owner occupied175 26.2% Renter occupiedHouse owners and renters - Two or more races residents 375 87.3% Owner occupied54 12.7% Renter occupiedHouse owners and renters - White alone residents 998 55.4% Owner occupied803 44.6% Renter occupiedHouse owners and renters - Hispanic or Latino residents 827 73.1% Owner occupied303 26.9% Renter occupied
Language usage in Calverton
English speakers - Total 47.9% of residents of Calverton speak English at home.
21.5% of residents speak Spanish at home 1,648 44.7% Speak English very well2,035 55.3% Speak English less than very well34.0% of residents speak other language at home 4,164 71.4% Speak English very well1,671 28.6% Speak English less than very well
English speakers - Born in the United States 89.1% of residents of Calverton speak English at home.
5.6% of residents speak Spanish at home 242 84.0% Speak English very well46 16.0% Speak English less than very well6.3% of residents speak other language at home 327 100.0% Speak English very well
English speakers - Native, born elsewhere 21.0% of residents of Calverton speak English at home.
79.2% of residents speak other language at home 61 20.0% Speak English very well244 80.0% Speak English less than very well
English speakers - Foreign-born 14.2% of residents of Calverton speak English at home.
31.6% of residents speak Spanish at home 922 36.2% Speak English very well1,627 63.8% Speak English less than very well54.2% of residents speak other language at home 2,885 66.0% Speak English very well1,489 34.0% Speak English less than very well
White (Caucasian) - Speak only English Native:
89.1% (2,593)Foreign-born:
26.7% (168)
White (Caucasian) - Speak another language Native:
10.8% (313)Foreign-born:
74.2% (467)
Black or African American - Speak only English Native:
83.8% (3,530)Foreign-born:
14.8% (460)
Black or African American - Speak another language Native:
18.1% (762)Foreign-born:
88.2% (2,743)
Asian - Speak only English Native:
36.3% (220)Foreign-born:
14.5% (221)
Asian - Speak another language Native:
65.6% (397)Foreign-born:
85.6% (1,302)
Other race - Speak another language Native:
90.3% (543)Foreign-born:
100.0% (1,761)
Two or more races - Speak only English Native:
61.1% (769)Foreign-born:
47.1% (338)
Two or more races - Speak another language Native:
40.5% (510)Foreign-born:
46.5% (333)
White alone - Speak only English Native:
92.5% (2,500)Foreign-born:
57.7% (187)
White alone - Speak another language Native:
8.0% (216)Foreign-born:
43.8% (142)
Hispanic or Latino - Speak only English Native:
26.0% (353)Foreign-born:
2.5% (65)
Hispanic or Latino - Speak another language Native:
74.2% (1,008)Foreign-born:
97.8% (2,607)
Foreign-born residents in Calverton 8,161 residents are foreign born (17.3% Latin America , 15.0% Africa , 8.8% Asia ).
This city:
45.0%Maryland:
15.7%
Marital status for residents in Calverton Marital status - White (Caucasian) population 15 years and over
Males 24.2% Never married57.0% Now married0.9% Separated10.7% Widowed7.2% DivorcedFemales 21.9% Never married42.5% Now married0.0% Separated20.4% Widowed15.2% DivorcedWomen who gave birth in the past 12 months Now married:
100.0% (23)Unmarried:
0.0% (0)
Women who did not give birth in the past 12 months Now married:
39.1% (188)Unmarried:
60.9% (292)
Marital status - Black or African American population 15 years and over
Males 37.8% Never married50.5% Now married2.0% Separated1.7% Widowed7.9% DivorcedFemales 36.9% Never married35.3% Now married3.6% Separated10.1% Widowed14.1% DivorcedWomen who gave birth in the past 12 months Now married:
90.9% (75)Unmarried:
9.1% (8)
Women who did not give birth in the past 12 months Now married:
32.7% (545)Unmarried:
67.3% (1,120)
Marital status - Asian population 15 years and over
Males 37.5% Never married58.2% Now married1.4% Separated1.2% Widowed1.7% DivorcedFemales 10.8% Never married76.3% Now married1.0% Separated11.4% Widowed0.6% DivorcedWomen who gave birth in the past 12 months Now married:
100.0% (36)Unmarried:
0.0% (0)
Women who did not give birth in the past 12 months Now married:
81.7% (386)Unmarried:
18.3% (87)
Marital status - Other race population 15 years and over
Males 45.5% Never married54.5% Now married0.0% Separated0.0% Widowed0.0% DivorcedFemales 28.9% Never married65.4% Now married0.0% Separated0.0% Widowed5.7% DivorcedWomen who gave birth in the past 12 months Now married:
100.0% (56)Unmarried:
0.0% (0)
Women who did not give birth in the past 12 months Now married:
63.1% (364)Unmarried:
36.9% (213)
Marital status - Two or more races population 15 years and over
Males 25.4% Never married34.1% Now married0.0% Separated0.0% Widowed40.5% DivorcedFemales 36.1% Never married31.2% Now married0.0% Separated6.2% Widowed26.4% DivorcedWomen who gave birth in the past 12 months Now married:
100.0% (13)Unmarried:
0.0% (0)
Women who did not give birth in the past 12 months Now married:
42.7% (204)Unmarried:
57.3% (274)
Marital status - White alone, not Hispanic / Latino population 15 years and over
Males 23.9% Never married57.0% Now married1.2% Separated8.8% Widowed9.1% DivorcedFemales 19.9% Never married36.6% Now married0.0% Separated24.6% Widowed18.9% DivorcedWomen who gave birth in the past 12 months Now married:
100.0% (14)Unmarried:
0.0% (0)
Women who did not give birth in the past 12 months Now married:
35.3% (112)Unmarried:
64.7% (206)
Marital status - Hispanic or Latino population 15 years and over
Males 39.7% Never married53.5% Now married0.0% Separated3.9% Widowed2.9% DivorcedFemales 28.8% Never married60.5% Now married0.0% Separated4.4% Widowed6.4% DivorcedWomen who gave birth in the past 12 months Now married:
100.0% (76)Unmarried:
0.0% (0)
Women who did not give birth in the past 12 months Now married:
57.0% (533)Unmarried:
43.0% (402)
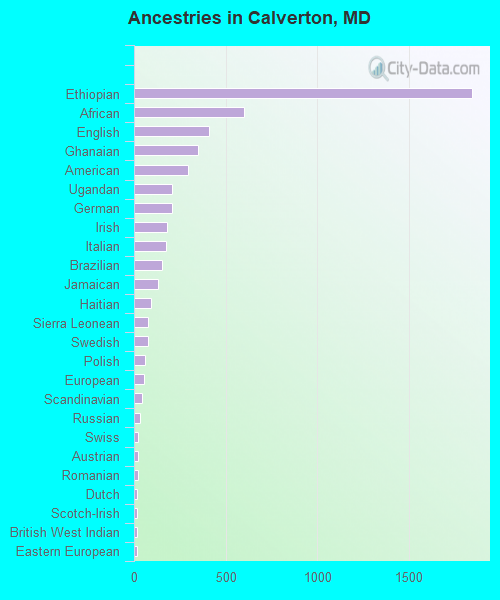
Ancestries in Calverton
1,846 15.5% Ethiopian599 5.0% African410 3.4% English349 2.9% Ghanaian296 2.5% American209 1.8% Ugandan205 1.7% German180 1.5% Irish174 1.5% Italian154 1.3% Brazilian131 1.1% Jamaican92 0.8% Haitian79 0.7% Sierra Leonean79 0.7% Swedish58 0.5% Polish55 0.5% European41 0.3% Scandinavian31 0.3% Russian24 0.2% Swiss21 0.2% Austrian21 0.2% Romanian19 0.2% Dutch18 0.2% Scotch-Irish18 0.2% British West Indian17 0.1% Eastern European11 0.09% Slovak11 0.09% Trinidadian and Tobagonian9 0.08% Nigerian8 0.07% Pennsylvania German6 0.05% Israeli
Geographical mobility in Calverton Same house 1 year ago 3,497 90.0% White (Caucasian)6,040 84.2% Black or African American2,113 98.5% Asian2,367 91.6% Other race1,930 93.1% Two or more races2,738 87.6% White alone, not Hispanic / Latino4,215 93.5% Hispanic or LatinoMoved within same county 188 4.9% White / Caucasian588 8.2% Black or African American26 1.2% Asian49 1.9% Other race23 1.1% Two or more races211 6.8% White alone, not Hispanic / Latino85 1.9% Hispanic or LatinoMoved within same state 123 3.2% White / Caucasian128 1.8% Black or African American10 0.5% Asian163 6.3% Other race130 4.2% White alone, not Hispanic / Latino166 3.7% Hispanic or LatinoMoved from different state 81 2.1% White / Caucasian131 1.8% Black or African American61 2.0% White alone, not Hispanic / Latino25 0.6% Hispanic or LatinoMoved from abroad 222 3.1% Black or African American3 0.1% Asian109 4.2% Other race133 3.0% Hispanic or Latino
Children Nativity (place of birth) in Calverton
Children under 6 years - Living with two parents Both parents native 35 100.0% NativeBoth parents foreign-born 461 73.9% Native163 26.1% Foreign-bornOne native, one foreign-born parent 103 100.0% NativeChildren under 6 years - Living with one parent Native parent 71 99.5% Native0 0.5% Foreign-bornForeign-born parent 229 72.4% Native87 27.6% Foreign-bornChildren 6 to 17 years - Living with two parents Both parents native 41 95.8% Native2 4.2% Foreign-bornBoth parents foreign-born 1,218 71.2% Native492 28.8% Foreign-bornOne native, one foreign-born parent 175 100.0% NativeChildren 6 to 17 years - Living with one parent Native parent 66 100.0% NativeForeign-born parent 770 57.2% Native575 42.8% Foreign-born
Grandparents responsible for own grandchildren in Calverton
Grandparents (30 to 59 years) White / Caucasian 3 100.0% Not responsible for grandchildrenBlack or African American 7 12.2% Responsible for grandchildren48 87.8% Not responsible for grandchildrenOther race 78 100.0% Not responsible for grandchildrenWhite alone, not Hispanic / Latino 4 100.0% Not responsible for grandchildrenHispanic or Latino 83 100.0% Not responsible for grandchildrenGrandparents (60 years and over) White / Caucasian 146 100.0% Not responsible for grandchildrenBlack or African American 35 30.4% Responsible for grandchildren81 69.6% Not responsible for grandchildrenOther race 4 30.9% Responsible for grandchildren8 69.1% Not responsible for grandchildrenWhite alone, not Hispanic / Latino 23 100.0% Not responsible for grandchildrenHispanic or Latino 3 2.1% Responsible for grandchildren154 97.9% Not responsible for grandchildren