Races in Canadice, New York (NY) Detailed Stats
Ancestries, Foreign-born residents, place of birth

Discuss Canadice, New York races on our local forum with over 2,400,000 registered users
2.5% of Canadice, NY residents are foreign-born (1.3% born in Europe, 0.8% born in Asia, 0.4% born in North America), which is 764.1% less than the foreign-born rate of 22.0% across the entire state of New York.
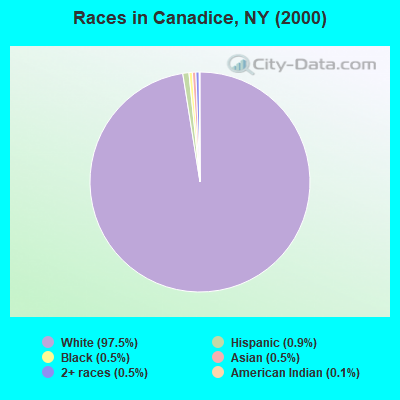
Race distribution in Canadice

- 1,80097.5%White alone
- 170.9%Hispanic
- 90.5%Black alone
- 90.5%Asian alone
- 90.5%Two or more races
- 20.1%American Indian alone
2000
2022
-
- 11,760,98162.0%White alone
- 2,867,58315.1%Hispanic
- 2,812,62314.8%Black alone
- 1,035,9265.5%Asian alone
- 366,1161.9%Two or more races
- 75,4990.4%Other race alone
- 52,4990.3%American Indian alone
- 5,2300.03%Native Hawaiian and Other
Pacific Islander alone

-
- 10,408,93352.9%White alone
- 3,867,29919.7%Hispanic
- 2,633,84013.4%Black alone
- 1,776,2869.0%Asian alone
- 732,6703.7%Two or more races
- 216,1101.1%Other race alone
- 35,0820.2%American Indian alone
- 6,9310.04%Native Hawaiian and Other
Pacific Islander alone

Income and house value in Canadice
- Median household income in 2022
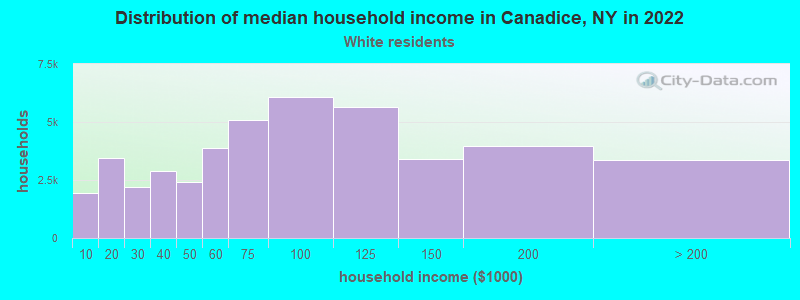
- $76,505White non-Hispanic householders
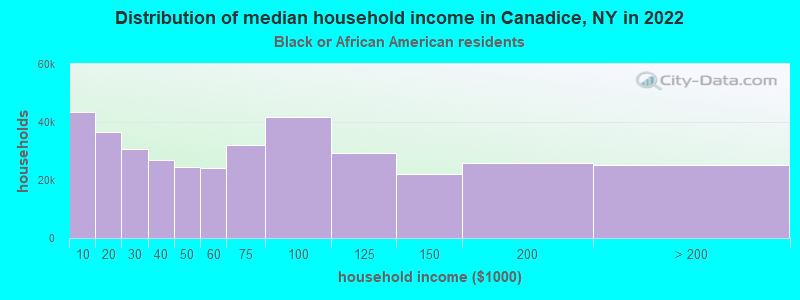
- $45,955Black householders
- $110,308Some other race householders
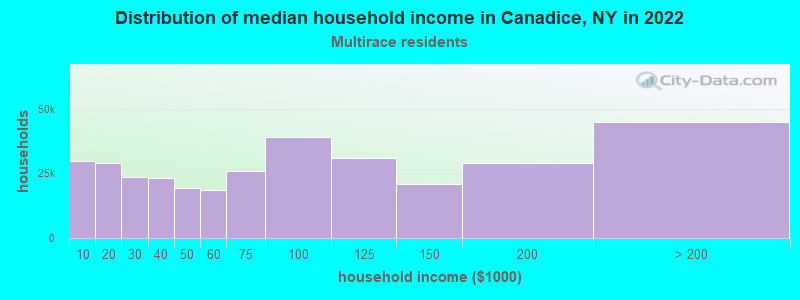
- $75,138Two or more races householders
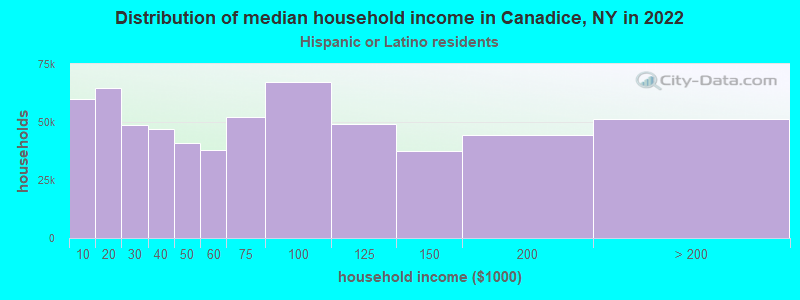
- $52,468Hispanic or Latino race householders
- Median 2022 house value
- $216,327White Non-Hispanic householders
- $208,452Hispanic or Latino householders
Household income for White non-Hispanic householders
Household income for Black householders
Household income for Two or more races householders
Household income for Hispanic or Latino race householders
Foreign-born residents in Canadice
47 residents are foreign born (1.3% Europe, 0.8% Asia, 0.4% North America).
| This city: | 2.5% |
| New York: | 20.4% |
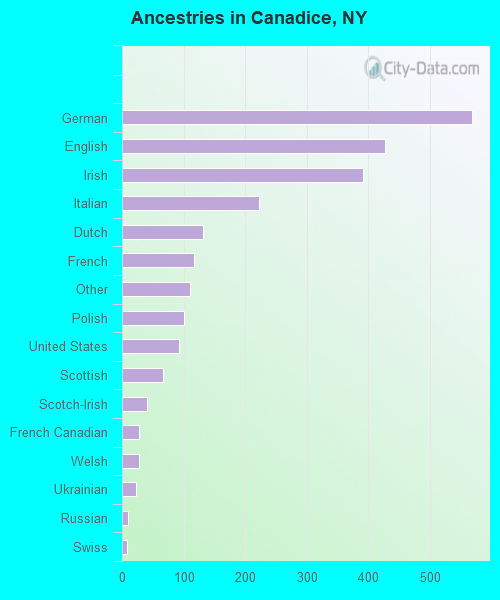
Ancestries in Canadice

- 56823.8%German
- 42717.9%English
- 39216.4%Irish
- 2239.4%Italian
- 1315.5%Dutch
- 1174.9%French
- 1104.6%Other
- 1014.2%Polish
- 933.9%United States
- 662.8%Scottish
- 401.7%Scotch-Irish
- 281.2%French Canadian
- 271.1%Welsh
- 231.0%Ukrainian
- 100.4%Russian
- 80.3%Swiss
- 50.2%Lithuanian
- 40.2%Danish
- 40.2%Norwegian
- 40.2%Swedish
- 20.08%Hungarian
- 10.04%Arab
Zip codes: 14560.