Races in Candler-McAfee, Georgia (GA) Detailed Stats
Data:
Races - White alone (%)
Races - White alone (% change since 2000)
Races - Black alone (%)
Races - Black alone (% change since 2000)
Races - American Indian alone (%)
Races - American Indian alone (% change since 2000)
Races - Asian alone (%)
Races - Asian alone (% change since 2000)
Races - Hispanic (%)
Races - Hispanic (% change since 2000)
Races - Native Hawaiian and Other Pacific Islander alone (%)
Races - Native Hawaiian and Other Pacific Islander alone (% change since 2000)
Races - Two or more races(%)
Races - Two or more races(% change since 2000)
Races - Other race alone (%)
Races - Other race alone (% change since 2000)
Racial diversity
Place of birth - Born in state of residence (%)
Place of birth - Born in state of residence (%) - White
Place of birth - Born in state of residence (%) - Black or African American
Place of birth - Born in state of residence (%) - Asian
Place of birth - Born in state of residence (%) - Hispanic or Latino
Place of birth - Born in state of residence (%) - American Indian and Alaska Native
Place of birth - Born in state of residence (%) - Multirace
Place of birth - Born in state of residence (%) - Other Race
Place of birth - Born in other state (%)
Place of birth - Born in other state (%) - White
Place of birth - Born in other state (%) - Black or African American
Place of birth - Born in other state (%) - Asian
Place of birth - Born in other state (%) - Hispanic or Latino
Place of birth - Born in other state (%) - American Indian and Alaska Native
Place of birth - Born in other state (%) - Multirace
Place of birth - Born in other state (%) - Other Race
Place of birth - Native, outside of US (%)
Place of birth - Native, outside of US (%) - White
Place of birth - Native, outside of US (%) - Black or African American
Place of birth - Native, outside of US (%) - Asian
Place of birth - Native, outside of US (%) - Hispanic or Latino
Place of birth - Native, outside of US (%) - American Indian and Alaska Native
Place of birth - Native, outside of US (%) - Multirace
Place of birth - Native, outside of US (%) - Other Race
Place of birth - Foreign born (%)
Place of birth - Foreign born (%) - White
Place of birth - Foreign born (%) - Black or African American
Place of birth - Foreign born (%) - Asian
Place of birth - Foreign born (%) - Hispanic or Latino
Place of birth - Foreign born (%) - American Indian and Alaska Native
Place of birth - Foreign born (%) - Multirace
Place of birth - Foreign born (%) - Other Race
Residents speaking English at home (%)
Residents speaking English at home - Born in the United States (%)
Residents speaking English at home - Native, born elsewhere (%)
Residents speaking English at home - Foreign born (%)
Residents speaking Spanish at home (%)
Residents speaking Spanish at home - Born in the United States (%)
Residents speaking Spanish at home - Native, born elsewhere (%)
Residents speaking Spanish at home - Foreign born (%)
Residents speaking other language at home (%)
Residents speaking other language at home - Born in the United States (%)
Residents speaking other language at home - Native, born elsewhere (%)
Residents speaking other language at home - Foreign born (%)
Marital status - Never married (%)
Marital status - Now married (%)
Marital status - Separated (%)
Marital status - Widowed (%)
Marital status - Divorced (%)
Ancestries Reported - Arab (%)
Ancestries Reported - Czech (%)
Ancestries Reported - Danish (%)
Ancestries Reported - Dutch (%)
Ancestries Reported - English (%)
Ancestries Reported - French (%)
Ancestries Reported - French Canadian (%)
Ancestries Reported - German (%)
Ancestries Reported - Greek (%)
Ancestries Reported - Hungarian (%)
Ancestries Reported - Irish (%)
Ancestries Reported - Italian (%)
Ancestries Reported - Lithuanian (%)
Ancestries Reported - Norwegian (%)
Ancestries Reported - Polish (%)
Ancestries Reported - Portuguese (%)
Ancestries Reported - Russian (%)
Ancestries Reported - Scotch-Irish (%)
Ancestries Reported - Scottish (%)
Ancestries Reported - Slovak (%)
Ancestries Reported - Subsaharan African (%)
Ancestries Reported - Swedish (%)
Ancestries Reported - Swiss (%)
Ancestries Reported - Ukrainian (%)
Ancestries Reported - United States (%)
Ancestries Reported - Welsh (%)
Ancestries Reported - West Indian (%)
Ancestries Reported - Other (%)
Geographical mobility - Same house 1 year ago (%)
Geographical mobility - Same house 1 year ago (%) - White
Geographical mobility - Same house 1 year ago (%) - Black or African American
Geographical mobility - Same house 1 year ago (%) - Asian
Geographical mobility - Same house 1 year ago (%) - Hispanic or Latino
Geographical mobility - Same house 1 year ago (%) - American Indian and Alaska Native
Geographical mobility - Same house 1 year ago (%) - Multirace
Geographical mobility - Same house 1 year ago (%) - Other Race
Geographical mobility - Moved within same county (%)
Geographical mobility - Moved within same county (%) - White
Geographical mobility - Moved within same county (%) - Black or African American
Geographical mobility - Moved within same county (%) - Asian
Geographical mobility - Moved within same county (%) - Hispanic or Latino
Geographical mobility - Moved within same county (%) - American Indian and Alaska Native
Geographical mobility - Moved within same county (%) - Multirace
Geographical mobility - Moved within same county (%) - Other Race
Geographical mobility - Moved from different county within same state (%)
Geographical mobility - Moved from different county within same state (%) - White
Geographical mobility - Moved from different county within same state (%) - Black or African American
Geographical mobility - Moved from different county within same state (%) - Asian
Geographical mobility - Moved from different county within same state (%) - Hispanic or Latino
Geographical mobility - Moved from different county within same state (%) - American Indian and Alaska Native
Geographical mobility - Moved from different county within same state (%) - Multirace
Geographical mobility - Moved from different county within same state (%) - Other Race
Geographical mobility - Moved from different state (%)
Geographical mobility - Moved from different state (%) - White
Geographical mobility - Moved from different state (%) - Black or African American
Geographical mobility - Moved from different state (%) - Asian
Geographical mobility - Moved from different state (%) - Hispanic or Latino
Geographical mobility - Moved from different state (%) - American Indian and Alaska Native
Geographical mobility - Moved from different state (%) - Multirace
Geographical mobility - Moved from different state (%) - Other Race
Geographical mobility - Moved from abroad (%)
Geographical mobility - Moved from abroad (%) - White
Geographical mobility - Moved from abroad (%) - Black or African American
Geographical mobility - Moved from abroad (%) - Asian
Geographical mobility - Moved from abroad (%) - Hispanic or Latino
Geographical mobility - Moved from abroad (%) - American Indian and Alaska Native
Geographical mobility - Moved from abroad (%) - Multirace
Geographical mobility - Moved from abroad (%) - Other Race
Place of birth for the foreign-born population - Ireland (%)
Place of birth for the foreign-born population - Denmark (%)
Place of birth for the foreign-born population - Norway (%)
Place of birth for the foreign-born population - Sweden (%)
Place of birth for the foreign-born population - United Kingdom (%)
Place of birth for the foreign-born population - England (%)
Place of birth for the foreign-born population - Scotland (%)
Place of birth for the foreign-born population - Other Northern Europe (%)
Place of birth for the foreign-born population - Austria (%)
Place of birth for the foreign-born population - Belgium (%)
Place of birth for the foreign-born population - France (%)
Place of birth for the foreign-born population - Germany (%)
Place of birth for the foreign-born population - Netherlands (%)
Place of birth for the foreign-born population - Switzerland (%)
Place of birth for the foreign-born population - Other Western Europe (%)
Place of birth for the foreign-born population - Greece (%)
Place of birth for the foreign-born population - Italy (%)
Place of birth for the foreign-born population - Portugal (%)
Place of birth for the foreign-born population - Spain (%)
Place of birth for the foreign-born population - Other Southern Europe (%)
Place of birth for the foreign-born population - Albania (%)
Place of birth for the foreign-born population - Belarus (%)
Place of birth for the foreign-born population - Bosnia and Herzegovina (%)
Place of birth for the foreign-born population - Bulgaria (%)
Place of birth for the foreign-born population - Croatia (%)
Place of birth for the foreign-born population - Czechoslovakia (%)
Place of birth for the foreign-born population - Hungary (%)
Place of birth for the foreign-born population - Latvia (%)
Place of birth for the foreign-born population - Lithuania (%)
Place of birth for the foreign-born population - North Macedonia (Macedonia) (%)
Place of birth for the foreign-born population - Moldova (%)
Place of birth for the foreign-born population - Poland (%)
Place of birth for the foreign-born population - Romania (%)
Place of birth for the foreign-born population - Russia (%)
Place of birth for the foreign-born population - Serbia (%)
Place of birth for the foreign-born population - Ukraine (%)
Place of birth for the foreign-born population - Other Eastern Europe (%)
Place of birth for the foreign-born population - China (%)
Place of birth for the foreign-born population - Hong Kong (%)
Place of birth for the foreign-born population - Taiwan (%)
Place of birth for the foreign-born population - Japan (%)
Place of birth for the foreign-born population - Korea (%)
Place of birth for the foreign-born population - Other Eastern Asia (%)
Place of birth for the foreign-born population - Afghanistan (%)
Place of birth for the foreign-born population - Bangladesh (%)
Place of birth for the foreign-born population - India (%)
Place of birth for the foreign-born population - Iran (%)
Place of birth for the foreign-born population - Kazakhstan (%)
Place of birth for the foreign-born population - Nepal (%)
Place of birth for the foreign-born population - Pakistan (%)
Place of birth for the foreign-born population - Sri Lanka (%)
Place of birth for the foreign-born population - Uzbekistan (%)
Place of birth for the foreign-born population - Other South Central Asia (%)
Place of birth for the foreign-born population - Burma (%)
Place of birth for the foreign-born population - Cambodia (%)
Place of birth for the foreign-born population - Indonesia (%)
Place of birth for the foreign-born population - Laos (%)
Place of birth for the foreign-born population - Malaysia (%)
Place of birth for the foreign-born population - Philippines (%)
Place of birth for the foreign-born population - Singapore (%)
Place of birth for the foreign-born population - Thailand (%)
Place of birth for the foreign-born population - Vietnam (%)
Place of birth for the foreign-born population - Other South Eastern Asia (%)
Place of birth for the foreign-born population - Armenia (%)
Place of birth for the foreign-born population - Iraq (%)
Place of birth for the foreign-born population - Israel (%)
Place of birth for the foreign-born population - Jordan (%)
Place of birth for the foreign-born population - Kuwait (%)
Place of birth for the foreign-born population - Lebanon (%)
Place of birth for the foreign-born population - Saudi Arabia (%)
Place of birth for the foreign-born population - Syria (%)
Place of birth for the foreign-born population - Turkey (%)
Place of birth for the foreign-born population - Yemen (%)
Place of birth for the foreign-born population - Other Western Asia (%)
Place of birth for the foreign-born population - Eritrea (%)
Place of birth for the foreign-born population - Ethiopia (%)
Place of birth for the foreign-born population - Kenya (%)
Place of birth for the foreign-born population - Somalia (%)
Place of birth for the foreign-born population - Uganda (%)
Place of birth for the foreign-born population - Zimbabwe (%)
Place of birth for the foreign-born population - Other Eastern Africa (%)
Place of birth for the foreign-born population - Cameroon (%)
Place of birth for the foreign-born population - Congo (%)
Place of birth for the foreign-born population - Democratic Republic of Congo (Zaire) (%)
Place of birth for the foreign-born population - Other Middle Africa (%)
Place of birth for the foreign-born population - Egypt (%)
Place of birth for the foreign-born population - Morocco (%)
Place of birth for the foreign-born population - Sudan (%)
Place of birth for the foreign-born population - Other Northern Africa (%)
Place of birth for the foreign-born population - South Africa (%)
Place of birth for the foreign-born population - Other Southern Africa (%)
Place of birth for the foreign-born population - Cabo Verde (%)
Place of birth for the foreign-born population - Ghana (%)
Place of birth for the foreign-born population - Liberia (%)
Place of birth for the foreign-born population - Nigeria (%)
Place of birth for the foreign-born population - Senegal (%)
Place of birth for the foreign-born population - Sierra Leone (%)
Place of birth for the foreign-born population - Other Western Africa (%)
Place of birth for the foreign-born population - Australia (%)
Place of birth for the foreign-born population - New Zealand (%)
Place of birth for the foreign-born population - Fiji (%)
Place of birth for the foreign-born population - Micronesia (%)
Place of birth for the foreign-born population - Bahamas (%)
Place of birth for the foreign-born population - Barbados (%)
Place of birth for the foreign-born population - Cuba (%)
Place of birth for the foreign-born population - Dominica (%)
Place of birth for the foreign-born population - Dominican Republic (%)
Place of birth for the foreign-born population - Grenada (%)
Place of birth for the foreign-born population - Haiti (%)
Place of birth for the foreign-born population - Jamaica (%)
Place of birth for the foreign-born population - St. Vincent and the Grenadines (%)
Place of birth for the foreign-born population - Trinidad and Tobago (%)
Place of birth for the foreign-born population - West Indies (%)
Place of birth for the foreign-born population - Other Caribbean (%)
Place of birth for the foreign-born population - Belize (%)
Place of birth for the foreign-born population - Costa Rica (%)
Place of birth for the foreign-born population - El Salvador (%)
Place of birth for the foreign-born population - Guatemala (%)
Place of birth for the foreign-born population - Honduras (%)
Place of birth for the foreign-born population - Mexico (%)
Place of birth for the foreign-born population - Nicaragua (%)
Place of birth for the foreign-born population - Panama (%)
Place of birth for the foreign-born population - Other Central America (%)
Place of birth for the foreign-born population - Argentina (%)
Place of birth for the foreign-born population - Bolivia (%)
Place of birth for the foreign-born population - Brazil (%)
Place of birth for the foreign-born population - Chile (%)
Place of birth for the foreign-born population - Colombia (%)
Place of birth for the foreign-born population - Ecuador (%)
Place of birth for the foreign-born population - Guyana (%)
Place of birth for the foreign-born population - Peru (%)
Place of birth for the foreign-born population - Uruguay (%)
Place of birth for the foreign-born population - Venezuela (%)
Place of birth for the foreign-born population - Other South America (%)
Place of birth for the foreign-born population - Canada (%)
Place of birth for the foreign-born population - Other Northern America (%)
Place of birth for the foreign-born population - Other (%)
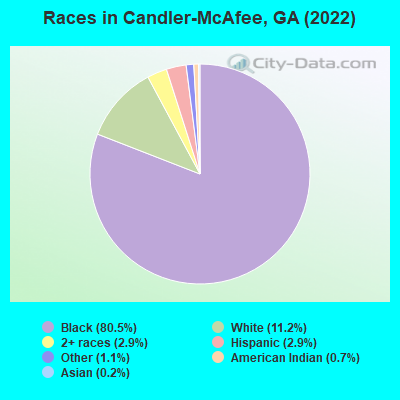
According to 2022 data, the most numerous races in Candler-McAfee, GA are White alone (2,544 residents), Black alone (18,321 residents), and Hispanic (663 residents). 95.2% of Candler-McAfee residents speak English at home. 4.1% of Candler-McAfee, GA residents are foreign-born (2.5% born in Latin America, 0.9% born in Africa), which is 144.9% less than the foreign-born rate of 10.0% across the entire state of Georgia.
Race distribution in Candler-McAfee
2000 2022
5,128,661 62.6% White alone 2,331,465 28.5% Black alone 435,227 5.3% Hispanic 171,513 2.1% Asian alone 87,364 1.1% Two or more races 17,670 0.2% American Indian alone 11,275 0.1% Other race alone 3,278 0.04% Native Hawaiian and Other
5,415,657 49.6% White alone 3,349,240 30.7% Black alone 1,132,604 10.4% Hispanic 479,156 4.4% Asian alone 462,923 4.2% Two or more races 54,416 0.5% Other race alone 11,923 0.1% American Indian alone 6,957 0.06% Native Hawaiian and Other
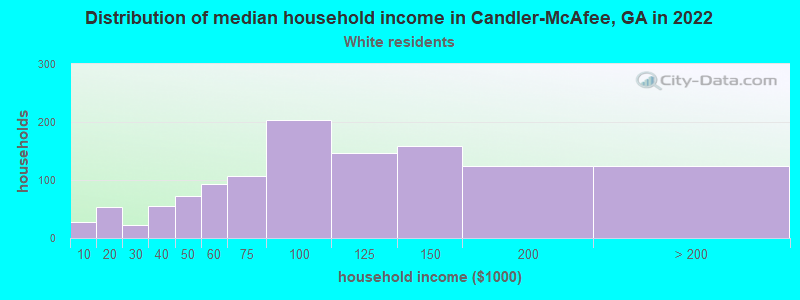
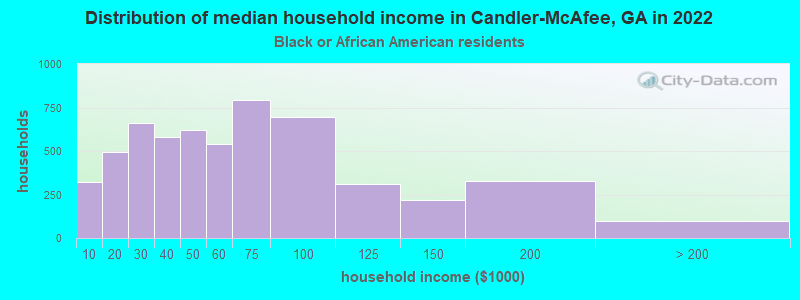
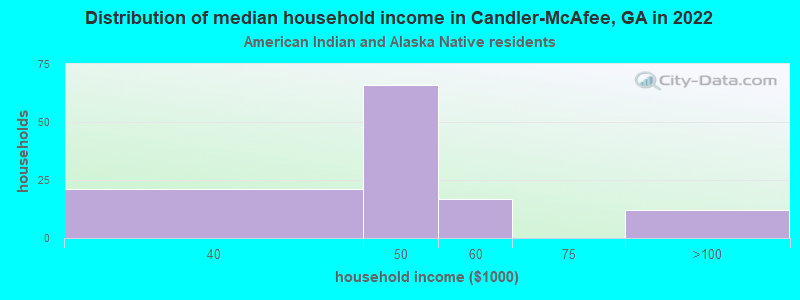
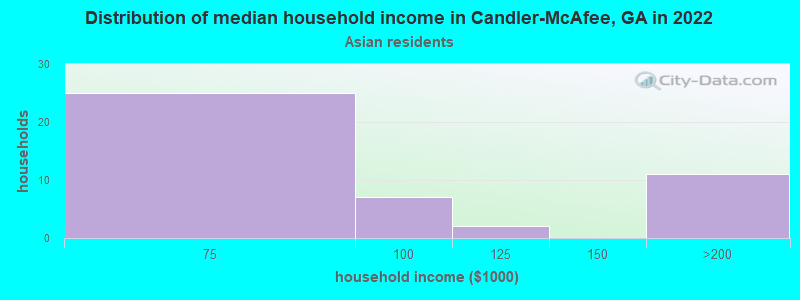
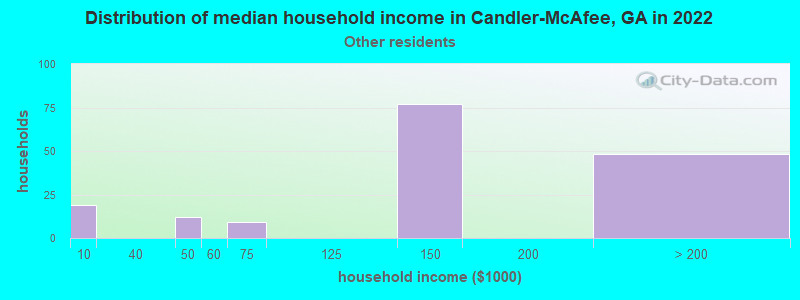
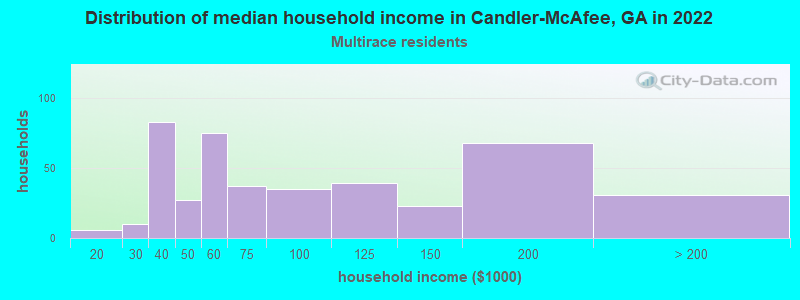
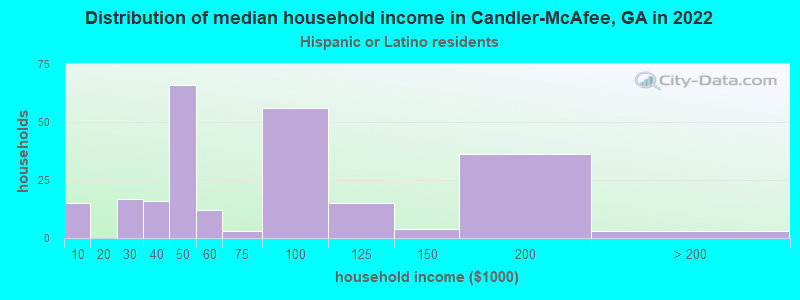
Income and house value in Candler-McAfee Median household income in 2022 $91,658 White non-Hispanic householders$52,752 Black householders$44,148 American Indian and Alaska Native householders$132,487 Some other race householders$71,508 Two or more races householders$78,078 Hispanic or Latino race householdersMedian 2022 house value $296,614 White Non-Hispanic householders$247,570 Black or African American householders$231,711 American Indian or Alaska Native householders over $1,000,000 Asian householders$220,258 Some other race householders$267,247 Two or more races householders$298,376 Hispanic or Latino householders
Median age by race in Candler-McAfee
36.2 Median age for White residents37.2 36.0 40.9 Median age for Black or African American residents43.9 39.7 81.4 Median age for American Indian / Alaska Native residents-658,914,728.0 73.0 45.7 Median age for Asian residents-672,601,384.1 46.7 -657,243,815.6 Median age for Native Hawaiian / Pacific Islander residents-693,227,090.9 -776,776,776.0 59.2 Median age for Other race residents41.2 55.2 35.0 Median age for Two or more races residents27.5 37.6 35.6 Median age for White alone residents36.9 34.6 41.2 Median age for Hispanic or Latino residents44.2 36.3
Owner/renter occupied households by race in Candler-McAfee
House owners and renters - White residents 788 65.4% Owner occupied416 34.6% Renter occupiedHouse owners and renters - Black or African American residents 3,758 64.9% Owner occupied2,031 35.1% Renter occupiedHouse owners and renters - American Indian / Alaska Native residents 93 89.6% Owner occupied11 10.4% Renter occupiedHouse owners and renters - Asian residents 48 100.0% Owner occupiedHouse owners and renters - Other race residents 74 32.5% Owner occupied154 67.5% Renter occupiedHouse owners and renters - Two or more races residents 210 54.7% Owner occupied174 45.3% Renter occupiedHouse owners and renters - White alone residents 742 62.7% Owner occupied441 37.3% Renter occupiedHouse owners and renters - Hispanic or Latino residents 209 79.9% Owner occupied53 20.1% Renter occupied
Language usage in Candler-McAfee
English speakers - Total 95.2% of residents of Candler-McAfee speak English at home.
2.0% of residents speak Spanish at home 282 65.4% Speak English very well149 34.6% Speak English less than very well3.2% of residents speak other language at home 602 87.5% Speak English very well86 12.5% Speak English less than very well
English speakers - Born in the United States 96.0% of residents of Candler-McAfee speak English at home.
1.3% of residents speak Spanish at home 70 100.0% Speak English very well2.8% of residents speak other language at home 107 70.9% Speak English very well44 29.1% Speak English less than very well
English speakers - Native, born elsewhere 81.0% of residents of Candler-McAfee speak English at home.
8.7% of residents speak other language at home 11 100.0% Speak English very well
English speakers - Foreign-born 30.8% of residents of Candler-McAfee speak English at home.
30.4% of residents speak Spanish at home 138 52.5% Speak English very well125 47.5% Speak English less than very well43.2% of residents speak other language at home 335 89.6% Speak English very well39 10.4% Speak English less than very well
White (Caucasian) - Speak only English Native:
99.2% (2,475)Foreign-born:
49.2% (13)
White (Caucasian) - Speak another language Native:
2.0% (50)Foreign-born:
57.3% (15)
Black or African American - Speak only English Native:
98.0% (16,039)Foreign-born:
43.7% (259)
Black or African American - Speak another language Native:
1.8% (289)Foreign-born:
56.4% (334)
Asian - Speak only English Native:
100.0% (22)Foreign-born:
14.4% (5)
Other race - Speak another language Native:
7.5% (44)Foreign-born:
100.0% (130)
Two or more races - Speak only English Native:
93.2% (673)Foreign-born:
4.7% (8)
Two or more races - Speak another language Native:
10.4% (75)Foreign-born:
92.5% (169)
White alone - Speak only English Native:
98.3% (2,452)Foreign-born:
81.6% (8)
White alone - Speak another language Native:
1.9% (49)Foreign-born:
8.9% (1)
Hispanic or Latino - Speak only English Native:
80.6% (290)Foreign-born:
2.9% (7)
Hispanic or Latino - Speak another language Native:
31.7% (114)Foreign-born:
96.4% (248)
Foreign-born residents in Candler-McAfee 929 residents are foreign born (2.5% Latin America , 0.9% Africa ).
This city:
4.1%Georgia:
10.4%
Marital status for residents in Candler-McAfee Marital status - White (Caucasian) population 15 years and over
Males 50.0% Never married29.8% Now married0.1% Separated5.4% Widowed14.7% DivorcedFemales 45.3% Never married32.7% Now married0.4% Separated3.7% Widowed17.9% DivorcedWomen who gave birth in the past 12 months Now married:
54.5% (11)Unmarried:
45.5% (9)
Women who did not give birth in the past 12 months Now married:
36.6% (314)Unmarried:
63.4% (545)
Marital status - Black or African American population 15 years and over
Males 48.9% Never married28.4% Now married1.8% Separated3.9% Widowed17.0% DivorcedFemales 49.5% Never married21.2% Now married3.5% Separated10.9% Widowed15.0% DivorcedWomen who gave birth in the past 12 months Now married:
5.4% (22)Unmarried:
94.6% (385)
Women who did not give birth in the past 12 months Now married:
18.2% (735)Unmarried:
81.8% (3,308)
Marital status - American Indian / Alaska Native population 15 years and over
Males 0.0% Never married0.0% Now married0.0% Separated0.0% Widowed100.0% DivorcedFemales 95.8% Never married4.2% Now married0.0% Separated0.0% Widowed0.0% DivorcedWomen who did not give birth in the past 12 months Now married:
0.0% (0)Unmarried:
100.0% (158)
Marital status - Asian population 15 years and over
Males 0.0% Never married100.0% Now married0.0% Separated0.0% Widowed0.0% DivorcedFemales 11.4% Never married45.5% Now married0.0% Separated2.3% Widowed40.9% DivorcedWomen who did not give birth in the past 12 months Now married:
43.9% (18)Unmarried:
56.1% (23)
Marital status - Other race population 15 years and over
Males 53.2% Never married41.6% Now married0.0% Separated0.0% Widowed5.2% DivorcedFemales 7.1% Never married50.0% Now married0.0% Separated0.0% Widowed42.9% DivorcedWomen who gave birth in the past 12 months Now married:
100.0% (3)Unmarried:
0.0% (0)
Women who did not give birth in the past 12 months Now married:
79.4% (40)Unmarried:
20.6% (10)
Marital status - Two or more races population 15 years and over
Males 37.9% Never married40.6% Now married2.2% Separated1.1% Widowed18.3% DivorcedFemales 46.2% Never married34.8% Now married1.6% Separated5.7% Widowed11.7% DivorcedWomen who gave birth in the past 12 months Now married:
100.0% (36)Unmarried:
0.0% (0)
Women who did not give birth in the past 12 months Now married:
17.0% (40)Unmarried:
83.0% (197)
Marital status - White alone, not Hispanic / Latino population 15 years and over
Males 51.0% Never married28.3% Now married0.1% Separated5.6% Widowed15.0% DivorcedFemales 47.0% Never married33.0% Now married0.5% Separated3.8% Widowed15.7% DivorcedWomen who gave birth in the past 12 months Now married:
54.5% (12)Unmarried:
45.5% (10)
Women who did not give birth in the past 12 months Now married:
35.9% (319)Unmarried:
64.1% (571)
Marital status - Hispanic or Latino population 15 years and over
Males 26.2% Never married68.6% Now married0.0% Separated0.0% Widowed5.2% DivorcedFemales 37.3% Never married26.9% Now married0.0% Separated0.0% Widowed35.9% DivorcedWomen who gave birth in the past 12 months Now married:
100.0% (5)Unmarried:
0.0% (0)
Women who did not give birth in the past 12 months Now married:
20.9% (34)Unmarried:
79.1% (130)
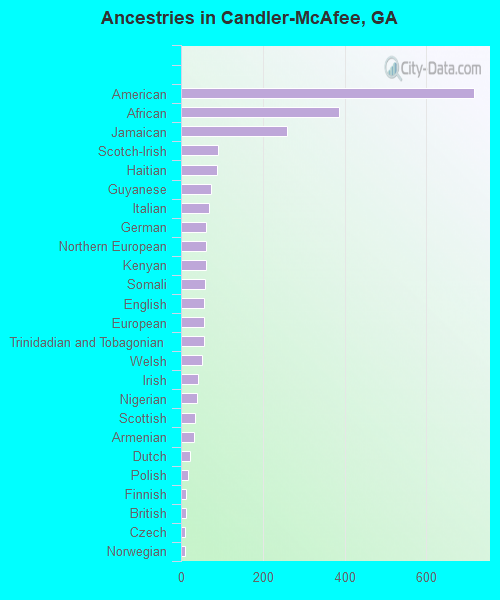
Ancestries in Candler-McAfee
717 4.8% American385 2.6% African258 1.7% Jamaican91 0.6% Scotch-Irish89 0.6% Haitian73 0.5% Guyanese69 0.5% Italian62 0.4% German62 0.4% Northern European61 0.4% Kenyan59 0.4% Somali57 0.4% English57 0.4% European56 0.4% Trinidadian and Tobagonian52 0.3% Welsh41 0.3% Irish40 0.3% Nigerian33 0.2% Scottish31 0.2% Armenian21 0.1% Dutch17 0.1% Polish12 0.08% Finnish11 0.07% British9 0.06% Czech9 0.06% Norwegian9 0.06% Liberian7 0.05% Barbadian5 0.03% Brazilian5 0.03% Canadian4 0.03% Ukrainian1 0.01% Swedish
Children Nativity (place of birth) in Candler-McAfee
Children under 6 years - Living with two parents Both parents native 202 100.0% NativeBoth parents foreign-born 110 100.0% NativeOne native, one foreign-born parent 10 100.0% NativeChildren under 6 years - Living with one parent Native parent 1,012 100.0% NativeChildren 6 to 17 years - Living with two parents Both parents native 449 99.4% Native3 0.6% Foreign-bornBoth parents foreign-born 36 100.0% NativeOne native, one foreign-born parent 32 93.8% Native2 6.2% Foreign-bornChildren 6 to 17 years - Living with one parent Native parent 1,576 100.0% NativeForeign-born parent 37 46.0% Native44 54.0% Foreign-born
Grandparents responsible for own grandchildren in Candler-McAfee
Grandparents (30 to 59 years) White / Caucasian 4 100.0% Responsible for grandchildrenBlack or African American 160 54.3% Responsible for grandchildren135 45.7% Not responsible for grandchildrenTwo or more races 28 100.0% Not responsible for grandchildrenWhite alone, not Hispanic / Latino 4 100.0% Responsible for grandchildrenGrandparents (60 years and over) Black or African American 186 44.5% Responsible for grandchildren232 55.5% Not responsible for grandchildrenTwo or more races 144 100.0% Not responsible for grandchildren