Races in Canterbury, New Hampshire (NH) Detailed Stats
Ancestries, Foreign-born residents, place of birth

Recent posts about races in Canterbury, New Hampshire on our local forum with over 2,400,000 registered users:
 | Canterbury?? (2 replies) |
| Plow Guy Suggestions - Canterbury/Gilmanton (4 replies) |
| Thinking of moving to New Hampshire from WA (40 replies) |
| Loudon and other towns in the North Concord area (12 replies) |
| LA to New England-Looking at New Hampshire (47 replies) |
| Moving to Concord Area (25 replies) |
Latest news about races in Canterbury, NH collected exclusively by city-data.com from local newspapers, TV, and radio stations
2.0% of Canterbury, NH residents are foreign-born (1.1% born in North America, 0.4% born in Europe, 0.4% born in Asia), which is 147.4% less than the foreign-born rate of 5.0% across the entire state of New Hampshire.
Race distribution in Canterbury

- 1,94398.2%White alone
- 140.7%Two or more races
- 100.5%Hispanic
- 50.3%Asian alone
- 50.3%Black alone
- 10.05%Other race alone
- 10.05%Native Hawaiian and Other
Pacific Islander alone

2000
2022
-
- 1,175,25295.1%White alone
- 20,4891.7%Hispanic
- 15,8031.3%Asian alone
- 11,6060.9%Two or more races
- 8,3540.7%Black alone
- 2,6980.2%American Indian alone
- 1,2540.1%Other race alone
- 3300.03%Native Hawaiian and Other
Pacific Islander alone

-
- 1,208,10186.6%White alone
- 63,4794.5%Hispanic
- 60,7244.4%Two or more races
- 36,5192.6%Asian alone
- 17,9311.3%Black alone
- 6,6150.5%Other race alone
- 1,0140.07%American Indian alone
- 8480.06%Native Hawaiian and Other
Pacific Islander alone

Income and house value in Canterbury
- Median household income in 2022
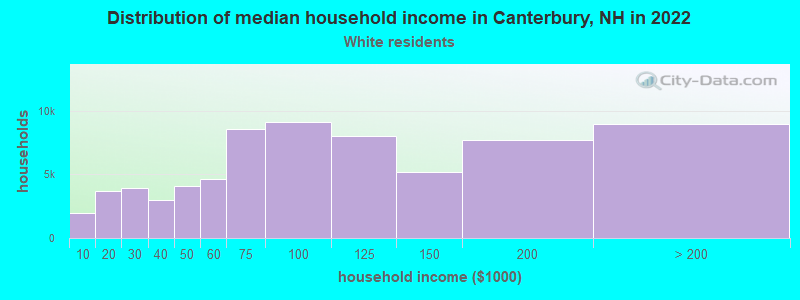
- $100,439White non-Hispanic householders
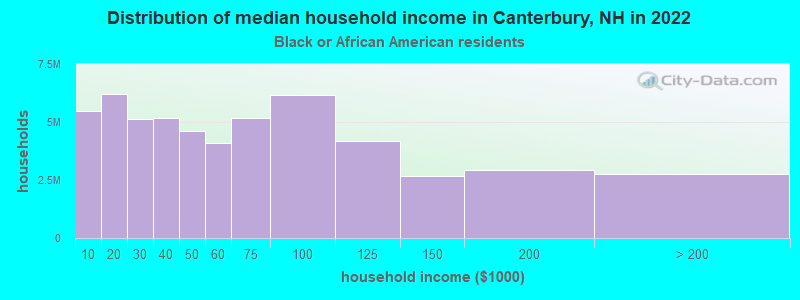
- $170,900Black householders
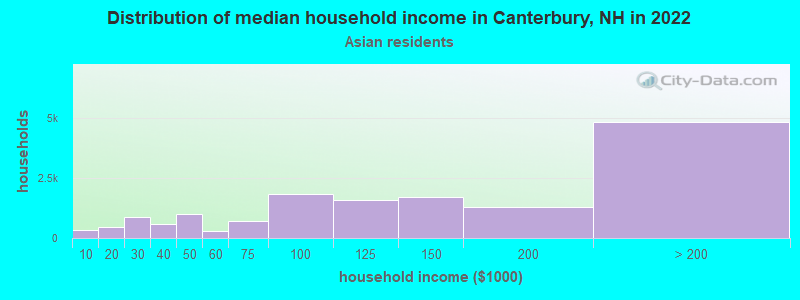
- $196,850Asian householders
- $81,986Two or more races householders
- $92,466Hispanic or Latino race householders
- Median 2022 house value
- $414,652White Non-Hispanic householders
- $430,299Asian householders
- $704,126Hispanic or Latino householders
Household income for White non-Hispanic householders
Household income for Black householders
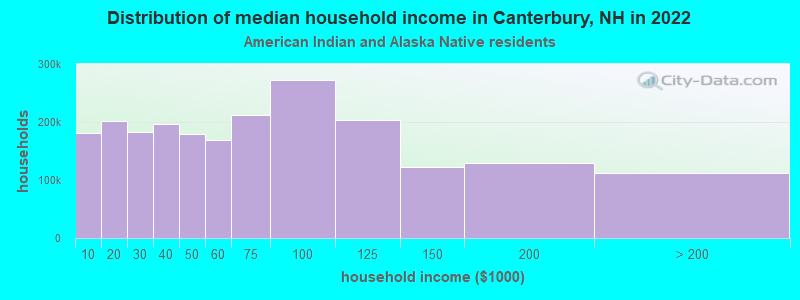
Household income for American Indian and Alaska Native householders
Household income for Asian householders
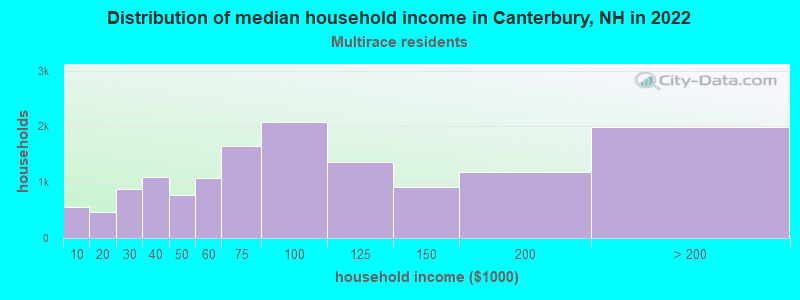
Household income for Two or more races householders
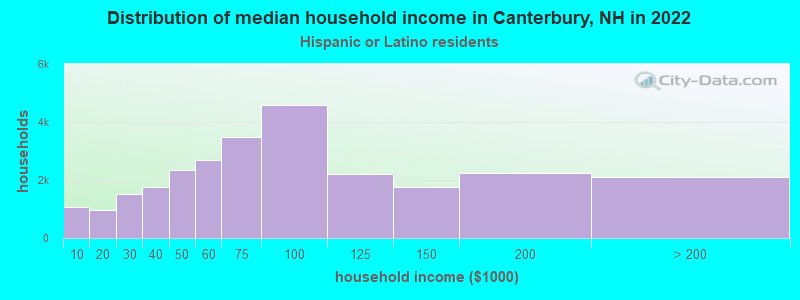
Household income for Hispanic or Latino race householders
Foreign-born residents in Canterbury
40 residents are foreign born (1.1% North America, 0.4% Europe, 0.4% Asia).
| This city: | 2.0% |
| New Hampshire: | 4.4% |
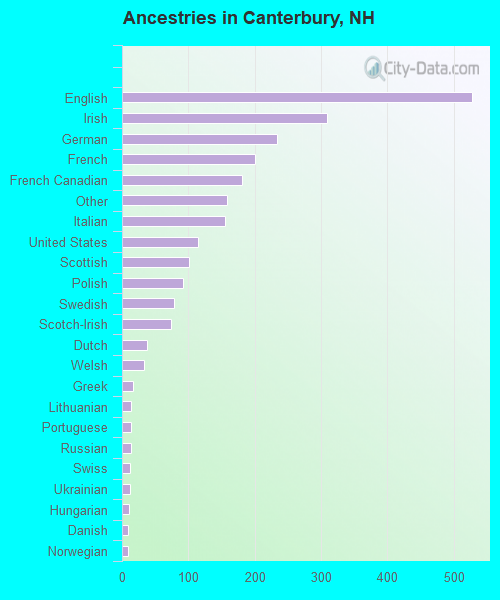
Ancestries in Canterbury

- 52721.9%English
- 30912.8%Irish
- 2349.7%German
- 2018.3%French
- 1817.5%French Canadian
- 1586.6%Other
- 1556.4%Italian
- 1144.7%United States
- 1014.2%Scottish
- 923.8%Polish
- 783.2%Swedish
- 743.1%Scotch-Irish
- 371.5%Dutch
- 331.4%Welsh
- 170.7%Greek
- 140.6%Lithuanian
- 140.6%Portuguese
- 140.6%Russian
- 120.5%Swiss
- 120.5%Ukrainian
- 100.4%Hungarian
- 90.4%Danish
- 90.4%Norwegian
- 20.08%Arab
- 20.08%Czech
- 20.08%West Indian
Zip codes: 03224.