Races in Canton, Georgia (GA) Detailed Stats
Data:
Races - White alone (%)
Races - White alone (% change since 2000)
Races - Black alone (%)
Races - Black alone (% change since 2000)
Races - American Indian alone (%)
Races - American Indian alone (% change since 2000)
Races - Asian alone (%)
Races - Asian alone (% change since 2000)
Races - Hispanic (%)
Races - Hispanic (% change since 2000)
Races - Native Hawaiian and Other Pacific Islander alone (%)
Races - Native Hawaiian and Other Pacific Islander alone (% change since 2000)
Races - Two or more races(%)
Races - Two or more races(% change since 2000)
Races - Other race alone (%)
Races - Other race alone (% change since 2000)
Racial diversity
Place of birth - Born in state of residence (%)
Place of birth - Born in state of residence (%) - White
Place of birth - Born in state of residence (%) - Black or African American
Place of birth - Born in state of residence (%) - Asian
Place of birth - Born in state of residence (%) - Hispanic or Latino
Place of birth - Born in state of residence (%) - American Indian and Alaska Native
Place of birth - Born in state of residence (%) - Multirace
Place of birth - Born in state of residence (%) - Other Race
Place of birth - Born in other state (%)
Place of birth - Born in other state (%) - White
Place of birth - Born in other state (%) - Black or African American
Place of birth - Born in other state (%) - Asian
Place of birth - Born in other state (%) - Hispanic or Latino
Place of birth - Born in other state (%) - American Indian and Alaska Native
Place of birth - Born in other state (%) - Multirace
Place of birth - Born in other state (%) - Other Race
Place of birth - Native, outside of US (%)
Place of birth - Native, outside of US (%) - White
Place of birth - Native, outside of US (%) - Black or African American
Place of birth - Native, outside of US (%) - Asian
Place of birth - Native, outside of US (%) - Hispanic or Latino
Place of birth - Native, outside of US (%) - American Indian and Alaska Native
Place of birth - Native, outside of US (%) - Multirace
Place of birth - Native, outside of US (%) - Other Race
Place of birth - Foreign born (%)
Place of birth - Foreign born (%) - White
Place of birth - Foreign born (%) - Black or African American
Place of birth - Foreign born (%) - Asian
Place of birth - Foreign born (%) - Hispanic or Latino
Place of birth - Foreign born (%) - American Indian and Alaska Native
Place of birth - Foreign born (%) - Multirace
Place of birth - Foreign born (%) - Other Race
Residents speaking English at home (%)
Residents speaking English at home - Born in the United States (%)
Residents speaking English at home - Native, born elsewhere (%)
Residents speaking English at home - Foreign born (%)
Residents speaking Spanish at home (%)
Residents speaking Spanish at home - Born in the United States (%)
Residents speaking Spanish at home - Native, born elsewhere (%)
Residents speaking Spanish at home - Foreign born (%)
Residents speaking other language at home (%)
Residents speaking other language at home - Born in the United States (%)
Residents speaking other language at home - Native, born elsewhere (%)
Residents speaking other language at home - Foreign born (%)
Marital status - Never married (%)
Marital status - Now married (%)
Marital status - Separated (%)
Marital status - Widowed (%)
Marital status - Divorced (%)
Ancestries Reported - Arab (%)
Ancestries Reported - Czech (%)
Ancestries Reported - Danish (%)
Ancestries Reported - Dutch (%)
Ancestries Reported - English (%)
Ancestries Reported - French (%)
Ancestries Reported - French Canadian (%)
Ancestries Reported - German (%)
Ancestries Reported - Greek (%)
Ancestries Reported - Hungarian (%)
Ancestries Reported - Irish (%)
Ancestries Reported - Italian (%)
Ancestries Reported - Lithuanian (%)
Ancestries Reported - Norwegian (%)
Ancestries Reported - Polish (%)
Ancestries Reported - Portuguese (%)
Ancestries Reported - Russian (%)
Ancestries Reported - Scotch-Irish (%)
Ancestries Reported - Scottish (%)
Ancestries Reported - Slovak (%)
Ancestries Reported - Subsaharan African (%)
Ancestries Reported - Swedish (%)
Ancestries Reported - Swiss (%)
Ancestries Reported - Ukrainian (%)
Ancestries Reported - United States (%)
Ancestries Reported - Welsh (%)
Ancestries Reported - West Indian (%)
Ancestries Reported - Other (%)
Geographical mobility - Same house 1 year ago (%)
Geographical mobility - Same house 1 year ago (%) - White
Geographical mobility - Same house 1 year ago (%) - Black or African American
Geographical mobility - Same house 1 year ago (%) - Asian
Geographical mobility - Same house 1 year ago (%) - Hispanic or Latino
Geographical mobility - Same house 1 year ago (%) - American Indian and Alaska Native
Geographical mobility - Same house 1 year ago (%) - Multirace
Geographical mobility - Same house 1 year ago (%) - Other Race
Geographical mobility - Moved within same county (%)
Geographical mobility - Moved within same county (%) - White
Geographical mobility - Moved within same county (%) - Black or African American
Geographical mobility - Moved within same county (%) - Asian
Geographical mobility - Moved within same county (%) - Hispanic or Latino
Geographical mobility - Moved within same county (%) - American Indian and Alaska Native
Geographical mobility - Moved within same county (%) - Multirace
Geographical mobility - Moved within same county (%) - Other Race
Geographical mobility - Moved from different county within same state (%)
Geographical mobility - Moved from different county within same state (%) - White
Geographical mobility - Moved from different county within same state (%) - Black or African American
Geographical mobility - Moved from different county within same state (%) - Asian
Geographical mobility - Moved from different county within same state (%) - Hispanic or Latino
Geographical mobility - Moved from different county within same state (%) - American Indian and Alaska Native
Geographical mobility - Moved from different county within same state (%) - Multirace
Geographical mobility - Moved from different county within same state (%) - Other Race
Geographical mobility - Moved from different state (%)
Geographical mobility - Moved from different state (%) - White
Geographical mobility - Moved from different state (%) - Black or African American
Geographical mobility - Moved from different state (%) - Asian
Geographical mobility - Moved from different state (%) - Hispanic or Latino
Geographical mobility - Moved from different state (%) - American Indian and Alaska Native
Geographical mobility - Moved from different state (%) - Multirace
Geographical mobility - Moved from different state (%) - Other Race
Geographical mobility - Moved from abroad (%)
Geographical mobility - Moved from abroad (%) - White
Geographical mobility - Moved from abroad (%) - Black or African American
Geographical mobility - Moved from abroad (%) - Asian
Geographical mobility - Moved from abroad (%) - Hispanic or Latino
Geographical mobility - Moved from abroad (%) - American Indian and Alaska Native
Geographical mobility - Moved from abroad (%) - Multirace
Geographical mobility - Moved from abroad (%) - Other Race
Place of birth for the foreign-born population - Ireland (%)
Place of birth for the foreign-born population - Denmark (%)
Place of birth for the foreign-born population - Norway (%)
Place of birth for the foreign-born population - Sweden (%)
Place of birth for the foreign-born population - United Kingdom (%)
Place of birth for the foreign-born population - England (%)
Place of birth for the foreign-born population - Scotland (%)
Place of birth for the foreign-born population - Other Northern Europe (%)
Place of birth for the foreign-born population - Austria (%)
Place of birth for the foreign-born population - Belgium (%)
Place of birth for the foreign-born population - France (%)
Place of birth for the foreign-born population - Germany (%)
Place of birth for the foreign-born population - Netherlands (%)
Place of birth for the foreign-born population - Switzerland (%)
Place of birth for the foreign-born population - Other Western Europe (%)
Place of birth for the foreign-born population - Greece (%)
Place of birth for the foreign-born population - Italy (%)
Place of birth for the foreign-born population - Portugal (%)
Place of birth for the foreign-born population - Spain (%)
Place of birth for the foreign-born population - Other Southern Europe (%)
Place of birth for the foreign-born population - Albania (%)
Place of birth for the foreign-born population - Belarus (%)
Place of birth for the foreign-born population - Bosnia and Herzegovina (%)
Place of birth for the foreign-born population - Bulgaria (%)
Place of birth for the foreign-born population - Croatia (%)
Place of birth for the foreign-born population - Czechoslovakia (%)
Place of birth for the foreign-born population - Hungary (%)
Place of birth for the foreign-born population - Latvia (%)
Place of birth for the foreign-born population - Lithuania (%)
Place of birth for the foreign-born population - North Macedonia (Macedonia) (%)
Place of birth for the foreign-born population - Moldova (%)
Place of birth for the foreign-born population - Poland (%)
Place of birth for the foreign-born population - Romania (%)
Place of birth for the foreign-born population - Russia (%)
Place of birth for the foreign-born population - Serbia (%)
Place of birth for the foreign-born population - Ukraine (%)
Place of birth for the foreign-born population - Other Eastern Europe (%)
Place of birth for the foreign-born population - China (%)
Place of birth for the foreign-born population - Hong Kong (%)
Place of birth for the foreign-born population - Taiwan (%)
Place of birth for the foreign-born population - Japan (%)
Place of birth for the foreign-born population - Korea (%)
Place of birth for the foreign-born population - Other Eastern Asia (%)
Place of birth for the foreign-born population - Afghanistan (%)
Place of birth for the foreign-born population - Bangladesh (%)
Place of birth for the foreign-born population - India (%)
Place of birth for the foreign-born population - Iran (%)
Place of birth for the foreign-born population - Kazakhstan (%)
Place of birth for the foreign-born population - Nepal (%)
Place of birth for the foreign-born population - Pakistan (%)
Place of birth for the foreign-born population - Sri Lanka (%)
Place of birth for the foreign-born population - Uzbekistan (%)
Place of birth for the foreign-born population - Other South Central Asia (%)
Place of birth for the foreign-born population - Burma (%)
Place of birth for the foreign-born population - Cambodia (%)
Place of birth for the foreign-born population - Indonesia (%)
Place of birth for the foreign-born population - Laos (%)
Place of birth for the foreign-born population - Malaysia (%)
Place of birth for the foreign-born population - Philippines (%)
Place of birth for the foreign-born population - Singapore (%)
Place of birth for the foreign-born population - Thailand (%)
Place of birth for the foreign-born population - Vietnam (%)
Place of birth for the foreign-born population - Other South Eastern Asia (%)
Place of birth for the foreign-born population - Armenia (%)
Place of birth for the foreign-born population - Iraq (%)
Place of birth for the foreign-born population - Israel (%)
Place of birth for the foreign-born population - Jordan (%)
Place of birth for the foreign-born population - Kuwait (%)
Place of birth for the foreign-born population - Lebanon (%)
Place of birth for the foreign-born population - Saudi Arabia (%)
Place of birth for the foreign-born population - Syria (%)
Place of birth for the foreign-born population - Turkey (%)
Place of birth for the foreign-born population - Yemen (%)
Place of birth for the foreign-born population - Other Western Asia (%)
Place of birth for the foreign-born population - Eritrea (%)
Place of birth for the foreign-born population - Ethiopia (%)
Place of birth for the foreign-born population - Kenya (%)
Place of birth for the foreign-born population - Somalia (%)
Place of birth for the foreign-born population - Uganda (%)
Place of birth for the foreign-born population - Zimbabwe (%)
Place of birth for the foreign-born population - Other Eastern Africa (%)
Place of birth for the foreign-born population - Cameroon (%)
Place of birth for the foreign-born population - Congo (%)
Place of birth for the foreign-born population - Democratic Republic of Congo (Zaire) (%)
Place of birth for the foreign-born population - Other Middle Africa (%)
Place of birth for the foreign-born population - Egypt (%)
Place of birth for the foreign-born population - Morocco (%)
Place of birth for the foreign-born population - Sudan (%)
Place of birth for the foreign-born population - Other Northern Africa (%)
Place of birth for the foreign-born population - South Africa (%)
Place of birth for the foreign-born population - Other Southern Africa (%)
Place of birth for the foreign-born population - Cabo Verde (%)
Place of birth for the foreign-born population - Ghana (%)
Place of birth for the foreign-born population - Liberia (%)
Place of birth for the foreign-born population - Nigeria (%)
Place of birth for the foreign-born population - Senegal (%)
Place of birth for the foreign-born population - Sierra Leone (%)
Place of birth for the foreign-born population - Other Western Africa (%)
Place of birth for the foreign-born population - Australia (%)
Place of birth for the foreign-born population - New Zealand (%)
Place of birth for the foreign-born population - Fiji (%)
Place of birth for the foreign-born population - Micronesia (%)
Place of birth for the foreign-born population - Bahamas (%)
Place of birth for the foreign-born population - Barbados (%)
Place of birth for the foreign-born population - Cuba (%)
Place of birth for the foreign-born population - Dominica (%)
Place of birth for the foreign-born population - Dominican Republic (%)
Place of birth for the foreign-born population - Grenada (%)
Place of birth for the foreign-born population - Haiti (%)
Place of birth for the foreign-born population - Jamaica (%)
Place of birth for the foreign-born population - St. Vincent and the Grenadines (%)
Place of birth for the foreign-born population - Trinidad and Tobago (%)
Place of birth for the foreign-born population - West Indies (%)
Place of birth for the foreign-born population - Other Caribbean (%)
Place of birth for the foreign-born population - Belize (%)
Place of birth for the foreign-born population - Costa Rica (%)
Place of birth for the foreign-born population - El Salvador (%)
Place of birth for the foreign-born population - Guatemala (%)
Place of birth for the foreign-born population - Honduras (%)
Place of birth for the foreign-born population - Mexico (%)
Place of birth for the foreign-born population - Nicaragua (%)
Place of birth for the foreign-born population - Panama (%)
Place of birth for the foreign-born population - Other Central America (%)
Place of birth for the foreign-born population - Argentina (%)
Place of birth for the foreign-born population - Bolivia (%)
Place of birth for the foreign-born population - Brazil (%)
Place of birth for the foreign-born population - Chile (%)
Place of birth for the foreign-born population - Colombia (%)
Place of birth for the foreign-born population - Ecuador (%)
Place of birth for the foreign-born population - Guyana (%)
Place of birth for the foreign-born population - Peru (%)
Place of birth for the foreign-born population - Uruguay (%)
Place of birth for the foreign-born population - Venezuela (%)
Place of birth for the foreign-born population - Other South America (%)
Place of birth for the foreign-born population - Canada (%)
Place of birth for the foreign-born population - Other Northern America (%)
Place of birth for the foreign-born population - Other (%)
Latest news about races in Canton, GA collected exclusively by city-data.com from local newspapers, TV, and radio stations
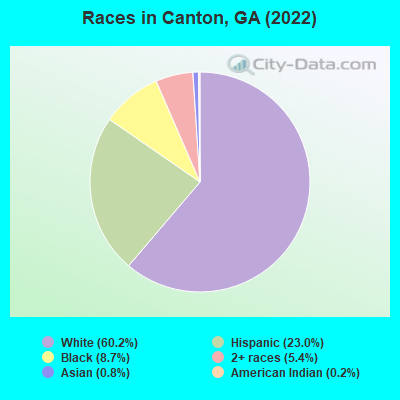
According to 2022 data, the most numerous races in Canton, GA are White alone (21,133 residents), Black alone (3,043 residents), and Hispanic (8,061 residents). 78.9% of Canton residents speak English at home. 12.7% of Canton, GA residents are foreign-born (10.5% born in Latin America), which is 21.4% greater than the foreign-born rate of 10.0% across the entire state of Georgia.
Race distribution in Canton
2000 2022
5,128,661 62.6% White alone 2,331,465 28.5% Black alone 435,227 5.3% Hispanic 171,513 2.1% Asian alone 87,364 1.1% Two or more races 17,670 0.2% American Indian alone 11,275 0.1% Other race alone 3,278 0.04% Native Hawaiian and Other
5,415,657 49.6% White alone 3,349,240 30.7% Black alone 1,132,604 10.4% Hispanic 479,156 4.4% Asian alone 462,923 4.2% Two or more races 54,416 0.5% Other race alone 11,923 0.1% American Indian alone 6,957 0.06% Native Hawaiian and Other
Income and house value in Canton Median household income in 2022 $80,208 White non-Hispanic householders$123,314 Black householders$65,102 Two or more races householders$60,789 Hispanic or Latino race householdersMedian 2022 house value $406,400 White Non-Hispanic householders$222,578 Black or African American householders$239,927 American Indian or Alaska Native householders$415,258 Some other race householders$599,818 Two or more races householders$387,944 Hispanic or Latino householders
Median age by race in Canton
38.5 Median age for White residents35.1 41.3 38.2 Median age for Black or African American residents32.5 47.2 21.8 Median age for American Indian / Alaska Native residents14.8 21.0 53.2 Median age for Asian residents56.3 45.9 -657,243,815.6 Median age for Native Hawaiian / Pacific Islander residents-693,227,090.9 -776,776,776.0 19.4 Median age for Other race residents20.8 17.6 31.0 Median age for Two or more races residents24.9 38.0 39.1 Median age for White alone residents37.9 42.8 22.6 Median age for Hispanic or Latino residents21.2 26.3
Owner/renter occupied households by race in Canton
House owners and renters - White residents 5,679 59.9% Owner occupied3,807 40.1% Renter occupiedHouse owners and renters - Black or African American residents 534 50.0% Owner occupied533 50.0% Renter occupiedHouse owners and renters - American Indian / Alaska Native residents 14 3.8% Owner occupied344 96.2% Renter occupiedHouse owners and renters - Asian residents 71 71.2% Owner occupied29 28.8% Renter occupiedHouse owners and renters - Other race residents 581 65.8% Owner occupied303 34.2% Renter occupiedHouse owners and renters - Two or more races residents 478 30.9% Owner occupied1,067 69.1% Renter occupiedHouse owners and renters - White alone residents 5,608 61.3% Owner occupied3,546 38.7% Renter occupiedHouse owners and renters - Hispanic or Latino residents 579 33.9% Owner occupied1,128 66.1% Renter occupied
Language usage in Canton
English speakers - Total 78.9% of residents of Canton speak English at home.
16.1% of residents speak Spanish at home 2,557 48.4% Speak English very well2,723 51.6% Speak English less than very well5.1% of residents speak other language at home 674 40.1% Speak English very well1,008 59.9% Speak English less than very well
English speakers - Born in the United States 94.5% of residents of Canton speak English at home.
3.0% of residents speak Spanish at home 418 100.0% Speak English very well1.8% of residents speak other language at home 228 91.2% Speak English very well22 8.8% Speak English less than very well
English speakers - Native, born elsewhere 63.3% of residents of Canton speak English at home.
20.7% of residents speak Spanish at home 57 100.0% Speak English very well4.4% of residents speak other language at home 12 100.0% Speak English less than very well
English speakers - Foreign-born 11.6% of residents of Canton speak English at home.
66.5% of residents speak Spanish at home 430 15.7% Speak English very well2,307 84.3% Speak English less than very well28.2% of residents speak other language at home 240 20.6% Speak English very well923 79.4% Speak English less than very well
White (Caucasian) - Speak only English Native:
97.4% (19,976)Foreign-born:
12.4% (87)
White (Caucasian) - Speak another language Native:
2.2% (456)Foreign-born:
90.3% (633)
Black or African American - Speak only English Native:
85.5% (2,478)Foreign-born:
78.2% (268)
Black or African American - Speak another language Native:
15.3% (442)Foreign-born:
33.6% (116)
American Indian / Alaska Native - Speak only English Native:
16.8% (34)Foreign-born:
8.3% (96)
American Indian / Alaska Native - Speak another language Native:
87.6% (175)Foreign-born:
91.7% (1,051)
Asian - Speak only English Native:
93.2% (60)Foreign-born:
6.4% (14)
Asian - Speak another language Native:
14.9% (10)Foreign-born:
100.0% (212)
Other race - Speak another language Native:
75.9% (1,658)Foreign-born:
92.1% (766)
Two or more races - Speak only English Native:
70.2% (2,052)Foreign-born:
8.4% (120)
Two or more races - Speak another language Native:
28.5% (833)Foreign-born:
97.2% (1,378)
White alone - Speak only English Native:
98.9% (19,744)Foreign-born:
37.6% (85)
White alone - Speak another language Native:
1.2% (236)Foreign-born:
66.4% (150)
Hispanic or Latino - Speak only English Native:
31.4% (1,206)Foreign-born:
3.0% (98)
Hispanic or Latino - Speak another language Native:
66.4% (2,552)Foreign-born:
98.7% (3,215)
Foreign-born residents in Canton 4,462 residents are foreign born (10.5% Latin America ).
This city:
12.7%Georgia:
10.4%
Marital status for residents in Canton Marital status - White (Caucasian) population 15 years and over
Males 29.9% Never married57.7% Now married1.2% Separated3.1% Widowed8.1% DivorcedFemales 18.0% Never married57.2% Now married2.2% Separated8.8% Widowed13.7% DivorcedWomen who gave birth in the past 12 months Now married:
90.7% (378)Unmarried:
9.3% (39)
Women who did not give birth in the past 12 months Now married:
58.7% (2,734)Unmarried:
41.3% (1,920)
Marital status - Black or African American population 15 years and over
Males 41.7% Never married41.2% Now married0.0% Separated0.2% Widowed16.8% DivorcedFemales 41.0% Never married28.9% Now married11.2% Separated10.2% Widowed8.8% DivorcedWomen who did not give birth in the past 12 months Now married:
47.3% (548)Unmarried:
52.7% (611)
Marital status - American Indian / Alaska Native population 15 years and over
Males 71.4% Never married27.7% Now married0.0% Separated0.0% Widowed0.9% DivorcedFemales 33.3% Never married37.6% Now married29.1% Separated0.0% Widowed0.0% DivorcedWomen who gave birth in the past 12 months Now married:
14.7% (8)Unmarried:
85.3% (46)
Women who did not give birth in the past 12 months Now married:
63.8% (95)Unmarried:
36.2% (54)
Marital status - Asian population 15 years and over
Males 30.8% Never married69.2% Now married0.0% Separated0.0% Widowed0.0% DivorcedFemales 50.5% Never married37.1% Now married0.0% Separated12.4% Widowed0.0% DivorcedWomen who did not give birth in the past 12 months Now married:
19.0% (8)Unmarried:
81.0% (35)
Marital status - Other race population 15 years and over
Males 43.0% Never married51.0% Now married0.0% Separated6.0% Widowed0.0% DivorcedFemales 35.9% Never married57.5% Now married0.0% Separated4.0% Widowed2.6% DivorcedWomen who did not give birth in the past 12 months Now married:
59.1% (407)Unmarried:
40.9% (281)
Marital status - Two or more races population 15 years and over
Males 34.3% Never married55.4% Now married0.0% Separated5.3% Widowed5.0% DivorcedFemales 36.9% Never married33.3% Now married1.1% Separated3.7% Widowed25.1% DivorcedWomen who gave birth in the past 12 months Now married:
0.0% (0)Unmarried:
100.0% (26)
Women who did not give birth in the past 12 months Now married:
33.9% (615)Unmarried:
66.1% (1,199)
Marital status - White alone, not Hispanic / Latino population 15 years and over
Males 30.2% Never married57.0% Now married1.3% Separated3.3% Widowed8.3% DivorcedFemales 17.8% Never married58.0% Now married2.4% Separated8.8% Widowed13.0% DivorcedWomen who gave birth in the past 12 months Now married:
100.0% (393)Unmarried:
0.0% (0)
Women who did not give birth in the past 12 months Now married:
56.8% (2,492)Unmarried:
43.2% (1,892)
Marital status - Hispanic or Latino population 15 years and over
Males 44.3% Never married52.8% Now married0.0% Separated1.5% Widowed1.4% DivorcedFemales 34.8% Never married43.6% Now married2.8% Separated4.0% Widowed14.9% DivorcedWomen who gave birth in the past 12 months Now married:
6.8% (5)Unmarried:
93.2% (75)
Women who did not give birth in the past 12 months Now married:
51.2% (983)Unmarried:
48.8% (935)
Ancestries in Canton
1,664 11.0% English1,589 10.5% American1,089 7.2% Irish732 4.8% European725 4.8% German351 2.3% Italian259 1.7% Haitian137 0.9% Scotch-Irish136 0.9% Scottish131 0.9% Bahamian99 0.7% African70 0.5% British64 0.4% Dutch56 0.4% Polish51 0.3% French49 0.3% Russian46 0.3% Norwegian36 0.2% South African33 0.2% Swedish29 0.2% Lebanese19 0.1% Eastern European16 0.1% Northern European12 0.08% Canadian12 0.08% Welsh11 0.07% Danish
Geographical mobility in Canton Same house 1 year ago 19,858 88.9% White (Caucasian)2,176 67.4% Black or African American1,102 80.3% American Indian / Alaska Native136 60.3% Asian2,700 98.5% Other race3,791 74.0% Two or more races18,763 89.7% White alone, not Hispanic / Latino6,593 84.7% Hispanic or LatinoMoved within same county 1,186 5.3% White / Caucasian558 17.3% Black or African American88 6.4% American Indian / Alaska Native380 7.4% Two or more races1,057 5.1% White alone, not Hispanic / Latino273 3.5% Hispanic or LatinoMoved within same state 990 4.4% White / Caucasian830 25.7% Black or African American7 0.5% American Indian / Alaska Native9 0.3% Other race790 15.4% Two or more races776 3.7% White alone, not Hispanic / Latino705 9.1% Hispanic or LatinoMoved from different state 257 1.2% White / Caucasian74 2.3% Black or African American60 26.7% Asian3 0.1% Two or more races256 1.2% White alone, not Hispanic / Latino2 0.0% Hispanic or LatinoMoved from abroad 149 10.9% American Indian / Alaska Native44 19.3% Asian26 0.9% Other race57 1.1% Two or more races186 2.4% Hispanic or Latino
Children Nativity (place of birth) in Canton
Children under 6 years - Living with two parents Both parents native 1,058 100.0% NativeBoth parents foreign-born 317 100.0% NativeOne native, one foreign-born parent 89 100.0% NativeChildren under 6 years - Living with one parent Native parent 833 100.0% NativeForeign-born parent 611 100.0% NativeChildren 6 to 17 years - Living with two parents Both parents native 2,627 100.0% NativeBoth parents foreign-born 1,145 92.5% Native93 7.5% Foreign-bornOne native, one foreign-born parent 304 100.0% NativeChildren 6 to 17 years - Living with one parent Native parent 996 100.0% NativeForeign-born parent 184 59.0% Native128 41.0% Foreign-born
Grandparents responsible for own grandchildren in Canton
Grandparents (30 to 59 years) White / Caucasian 5 100.0% Responsible for grandchildrenAmerican Indian / Alaska Native 6 100.0% Not responsible for grandchildrenTwo or more races 65 17.4% Responsible for grandchildren306 82.6% Not responsible for grandchildrenWhite alone, not Hispanic / Latino 5 100.0% Responsible for grandchildrenHispanic or Latino 35 13.9% Responsible for grandchildren216 86.1% Not responsible for grandchildren
Grandparents (60 years and over) White / Caucasian 217 100.0% Not responsible for grandchildrenWhite alone, not Hispanic / Latino 145 100.0% Not responsible for grandchildrenHispanic or Latino 102 100.0% Not responsible for grandchildren