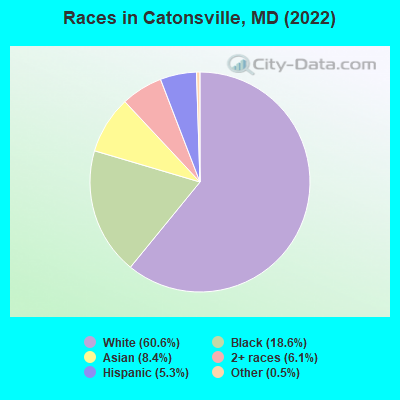
Races in Catonsville, Maryland (MD) Detailed Stats
Data:
Races - White alone (%)
Races - White alone (% change since 2000)
Races - Black alone (%)
Races - Black alone (% change since 2000)
Races - American Indian alone (%)
Races - American Indian alone (% change since 2000)
Races - Asian alone (%)
Races - Asian alone (% change since 2000)
Races - Hispanic (%)
Races - Hispanic (% change since 2000)
Races - Native Hawaiian and Other Pacific Islander alone (%)
Races - Native Hawaiian and Other Pacific Islander alone (% change since 2000)
Races - Two or more races(%)
Races - Two or more races(% change since 2000)
Races - Other race alone (%)
Races - Other race alone (% change since 2000)
Racial diversity
Place of birth - Born in state of residence (%)
Place of birth - Born in state of residence (%) - White
Place of birth - Born in state of residence (%) - Black or African American
Place of birth - Born in state of residence (%) - Asian
Place of birth - Born in state of residence (%) - Hispanic or Latino
Place of birth - Born in state of residence (%) - American Indian and Alaska Native
Place of birth - Born in state of residence (%) - Multirace
Place of birth - Born in state of residence (%) - Other Race
Place of birth - Born in other state (%)
Place of birth - Born in other state (%) - White
Place of birth - Born in other state (%) - Black or African American
Place of birth - Born in other state (%) - Asian
Place of birth - Born in other state (%) - Hispanic or Latino
Place of birth - Born in other state (%) - American Indian and Alaska Native
Place of birth - Born in other state (%) - Multirace
Place of birth - Born in other state (%) - Other Race
Place of birth - Native, outside of US (%)
Place of birth - Native, outside of US (%) - White
Place of birth - Native, outside of US (%) - Black or African American
Place of birth - Native, outside of US (%) - Asian
Place of birth - Native, outside of US (%) - Hispanic or Latino
Place of birth - Native, outside of US (%) - American Indian and Alaska Native
Place of birth - Native, outside of US (%) - Multirace
Place of birth - Native, outside of US (%) - Other Race
Place of birth - Foreign born (%)
Place of birth - Foreign born (%) - White
Place of birth - Foreign born (%) - Black or African American
Place of birth - Foreign born (%) - Asian
Place of birth - Foreign born (%) - Hispanic or Latino
Place of birth - Foreign born (%) - American Indian and Alaska Native
Place of birth - Foreign born (%) - Multirace
Place of birth - Foreign born (%) - Other Race
Residents speaking English at home (%)
Residents speaking English at home - Born in the United States (%)
Residents speaking English at home - Native, born elsewhere (%)
Residents speaking English at home - Foreign born (%)
Residents speaking Spanish at home (%)
Residents speaking Spanish at home - Born in the United States (%)
Residents speaking Spanish at home - Native, born elsewhere (%)
Residents speaking Spanish at home - Foreign born (%)
Residents speaking other language at home (%)
Residents speaking other language at home - Born in the United States (%)
Residents speaking other language at home - Native, born elsewhere (%)
Residents speaking other language at home - Foreign born (%)
Marital status - Never married (%)
Marital status - Now married (%)
Marital status - Separated (%)
Marital status - Widowed (%)
Marital status - Divorced (%)
Ancestries Reported - Arab (%)
Ancestries Reported - Czech (%)
Ancestries Reported - Danish (%)
Ancestries Reported - Dutch (%)
Ancestries Reported - English (%)
Ancestries Reported - French (%)
Ancestries Reported - French Canadian (%)
Ancestries Reported - German (%)
Ancestries Reported - Greek (%)
Ancestries Reported - Hungarian (%)
Ancestries Reported - Irish (%)
Ancestries Reported - Italian (%)
Ancestries Reported - Lithuanian (%)
Ancestries Reported - Norwegian (%)
Ancestries Reported - Polish (%)
Ancestries Reported - Portuguese (%)
Ancestries Reported - Russian (%)
Ancestries Reported - Scotch-Irish (%)
Ancestries Reported - Scottish (%)
Ancestries Reported - Slovak (%)
Ancestries Reported - Subsaharan African (%)
Ancestries Reported - Swedish (%)
Ancestries Reported - Swiss (%)
Ancestries Reported - Ukrainian (%)
Ancestries Reported - United States (%)
Ancestries Reported - Welsh (%)
Ancestries Reported - West Indian (%)
Ancestries Reported - Other (%)
Geographical mobility - Same house 1 year ago (%)
Geographical mobility - Same house 1 year ago (%) - White
Geographical mobility - Same house 1 year ago (%) - Black or African American
Geographical mobility - Same house 1 year ago (%) - Asian
Geographical mobility - Same house 1 year ago (%) - Hispanic or Latino
Geographical mobility - Same house 1 year ago (%) - American Indian and Alaska Native
Geographical mobility - Same house 1 year ago (%) - Multirace
Geographical mobility - Same house 1 year ago (%) - Other Race
Geographical mobility - Moved within same county (%)
Geographical mobility - Moved within same county (%) - White
Geographical mobility - Moved within same county (%) - Black or African American
Geographical mobility - Moved within same county (%) - Asian
Geographical mobility - Moved within same county (%) - Hispanic or Latino
Geographical mobility - Moved within same county (%) - American Indian and Alaska Native
Geographical mobility - Moved within same county (%) - Multirace
Geographical mobility - Moved within same county (%) - Other Race
Geographical mobility - Moved from different county within same state (%)
Geographical mobility - Moved from different county within same state (%) - White
Geographical mobility - Moved from different county within same state (%) - Black or African American
Geographical mobility - Moved from different county within same state (%) - Asian
Geographical mobility - Moved from different county within same state (%) - Hispanic or Latino
Geographical mobility - Moved from different county within same state (%) - American Indian and Alaska Native
Geographical mobility - Moved from different county within same state (%) - Multirace
Geographical mobility - Moved from different county within same state (%) - Other Race
Geographical mobility - Moved from different state (%)
Geographical mobility - Moved from different state (%) - White
Geographical mobility - Moved from different state (%) - Black or African American
Geographical mobility - Moved from different state (%) - Asian
Geographical mobility - Moved from different state (%) - Hispanic or Latino
Geographical mobility - Moved from different state (%) - American Indian and Alaska Native
Geographical mobility - Moved from different state (%) - Multirace
Geographical mobility - Moved from different state (%) - Other Race
Geographical mobility - Moved from abroad (%)
Geographical mobility - Moved from abroad (%) - White
Geographical mobility - Moved from abroad (%) - Black or African American
Geographical mobility - Moved from abroad (%) - Asian
Geographical mobility - Moved from abroad (%) - Hispanic or Latino
Geographical mobility - Moved from abroad (%) - American Indian and Alaska Native
Geographical mobility - Moved from abroad (%) - Multirace
Geographical mobility - Moved from abroad (%) - Other Race
Place of birth for the foreign-born population - Ireland (%)
Place of birth for the foreign-born population - Denmark (%)
Place of birth for the foreign-born population - Norway (%)
Place of birth for the foreign-born population - Sweden (%)
Place of birth for the foreign-born population - United Kingdom (%)
Place of birth for the foreign-born population - England (%)
Place of birth for the foreign-born population - Scotland (%)
Place of birth for the foreign-born population - Other Northern Europe (%)
Place of birth for the foreign-born population - Austria (%)
Place of birth for the foreign-born population - Belgium (%)
Place of birth for the foreign-born population - France (%)
Place of birth for the foreign-born population - Germany (%)
Place of birth for the foreign-born population - Netherlands (%)
Place of birth for the foreign-born population - Switzerland (%)
Place of birth for the foreign-born population - Other Western Europe (%)
Place of birth for the foreign-born population - Greece (%)
Place of birth for the foreign-born population - Italy (%)
Place of birth for the foreign-born population - Portugal (%)
Place of birth for the foreign-born population - Spain (%)
Place of birth for the foreign-born population - Other Southern Europe (%)
Place of birth for the foreign-born population - Albania (%)
Place of birth for the foreign-born population - Belarus (%)
Place of birth for the foreign-born population - Bosnia and Herzegovina (%)
Place of birth for the foreign-born population - Bulgaria (%)
Place of birth for the foreign-born population - Croatia (%)
Place of birth for the foreign-born population - Czechoslovakia (%)
Place of birth for the foreign-born population - Hungary (%)
Place of birth for the foreign-born population - Latvia (%)
Place of birth for the foreign-born population - Lithuania (%)
Place of birth for the foreign-born population - North Macedonia (Macedonia) (%)
Place of birth for the foreign-born population - Moldova (%)
Place of birth for the foreign-born population - Poland (%)
Place of birth for the foreign-born population - Romania (%)
Place of birth for the foreign-born population - Russia (%)
Place of birth for the foreign-born population - Serbia (%)
Place of birth for the foreign-born population - Ukraine (%)
Place of birth for the foreign-born population - Other Eastern Europe (%)
Place of birth for the foreign-born population - China (%)
Place of birth for the foreign-born population - Hong Kong (%)
Place of birth for the foreign-born population - Taiwan (%)
Place of birth for the foreign-born population - Japan (%)
Place of birth for the foreign-born population - Korea (%)
Place of birth for the foreign-born population - Other Eastern Asia (%)
Place of birth for the foreign-born population - Afghanistan (%)
Place of birth for the foreign-born population - Bangladesh (%)
Place of birth for the foreign-born population - India (%)
Place of birth for the foreign-born population - Iran (%)
Place of birth for the foreign-born population - Kazakhstan (%)
Place of birth for the foreign-born population - Nepal (%)
Place of birth for the foreign-born population - Pakistan (%)
Place of birth for the foreign-born population - Sri Lanka (%)
Place of birth for the foreign-born population - Uzbekistan (%)
Place of birth for the foreign-born population - Other South Central Asia (%)
Place of birth for the foreign-born population - Burma (%)
Place of birth for the foreign-born population - Cambodia (%)
Place of birth for the foreign-born population - Indonesia (%)
Place of birth for the foreign-born population - Laos (%)
Place of birth for the foreign-born population - Malaysia (%)
Place of birth for the foreign-born population - Philippines (%)
Place of birth for the foreign-born population - Singapore (%)
Place of birth for the foreign-born population - Thailand (%)
Place of birth for the foreign-born population - Vietnam (%)
Place of birth for the foreign-born population - Other South Eastern Asia (%)
Place of birth for the foreign-born population - Armenia (%)
Place of birth for the foreign-born population - Iraq (%)
Place of birth for the foreign-born population - Israel (%)
Place of birth for the foreign-born population - Jordan (%)
Place of birth for the foreign-born population - Kuwait (%)
Place of birth for the foreign-born population - Lebanon (%)
Place of birth for the foreign-born population - Saudi Arabia (%)
Place of birth for the foreign-born population - Syria (%)
Place of birth for the foreign-born population - Turkey (%)
Place of birth for the foreign-born population - Yemen (%)
Place of birth for the foreign-born population - Other Western Asia (%)
Place of birth for the foreign-born population - Eritrea (%)
Place of birth for the foreign-born population - Ethiopia (%)
Place of birth for the foreign-born population - Kenya (%)
Place of birth for the foreign-born population - Somalia (%)
Place of birth for the foreign-born population - Uganda (%)
Place of birth for the foreign-born population - Zimbabwe (%)
Place of birth for the foreign-born population - Other Eastern Africa (%)
Place of birth for the foreign-born population - Cameroon (%)
Place of birth for the foreign-born population - Congo (%)
Place of birth for the foreign-born population - Democratic Republic of Congo (Zaire) (%)
Place of birth for the foreign-born population - Other Middle Africa (%)
Place of birth for the foreign-born population - Egypt (%)
Place of birth for the foreign-born population - Morocco (%)
Place of birth for the foreign-born population - Sudan (%)
Place of birth for the foreign-born population - Other Northern Africa (%)
Place of birth for the foreign-born population - South Africa (%)
Place of birth for the foreign-born population - Other Southern Africa (%)
Place of birth for the foreign-born population - Cabo Verde (%)
Place of birth for the foreign-born population - Ghana (%)
Place of birth for the foreign-born population - Liberia (%)
Place of birth for the foreign-born population - Nigeria (%)
Place of birth for the foreign-born population - Senegal (%)
Place of birth for the foreign-born population - Sierra Leone (%)
Place of birth for the foreign-born population - Other Western Africa (%)
Place of birth for the foreign-born population - Australia (%)
Place of birth for the foreign-born population - New Zealand (%)
Place of birth for the foreign-born population - Fiji (%)
Place of birth for the foreign-born population - Micronesia (%)
Place of birth for the foreign-born population - Bahamas (%)
Place of birth for the foreign-born population - Barbados (%)
Place of birth for the foreign-born population - Cuba (%)
Place of birth for the foreign-born population - Dominica (%)
Place of birth for the foreign-born population - Dominican Republic (%)
Place of birth for the foreign-born population - Grenada (%)
Place of birth for the foreign-born population - Haiti (%)
Place of birth for the foreign-born population - Jamaica (%)
Place of birth for the foreign-born population - St. Vincent and the Grenadines (%)
Place of birth for the foreign-born population - Trinidad and Tobago (%)
Place of birth for the foreign-born population - West Indies (%)
Place of birth for the foreign-born population - Other Caribbean (%)
Place of birth for the foreign-born population - Belize (%)
Place of birth for the foreign-born population - Costa Rica (%)
Place of birth for the foreign-born population - El Salvador (%)
Place of birth for the foreign-born population - Guatemala (%)
Place of birth for the foreign-born population - Honduras (%)
Place of birth for the foreign-born population - Mexico (%)
Place of birth for the foreign-born population - Nicaragua (%)
Place of birth for the foreign-born population - Panama (%)
Place of birth for the foreign-born population - Other Central America (%)
Place of birth for the foreign-born population - Argentina (%)
Place of birth for the foreign-born population - Bolivia (%)
Place of birth for the foreign-born population - Brazil (%)
Place of birth for the foreign-born population - Chile (%)
Place of birth for the foreign-born population - Colombia (%)
Place of birth for the foreign-born population - Ecuador (%)
Place of birth for the foreign-born population - Guyana (%)
Place of birth for the foreign-born population - Peru (%)
Place of birth for the foreign-born population - Uruguay (%)
Place of birth for the foreign-born population - Venezuela (%)
Place of birth for the foreign-born population - Other South America (%)
Place of birth for the foreign-born population - Canada (%)
Place of birth for the foreign-born population - Other Northern America (%)
Place of birth for the foreign-born population - Other (%)
Latest news about races in Catonsville, MD collected exclusively by city-data.com from local newspapers, TV, and radio stations
According to 2022 data, the most numerous races in Catonsville, MD are White alone (25,772 residents), Black alone (7,911 residents), and Hispanic (2,265 residents). 86.4% of Catonsville residents speak English at home. 12.8% of Catonsville, MD residents are foreign-born (6.0% born in Asia, 2.4% born in Africa, 1.8% born in Latin America, 1.7% born in Europe), which is 25.3% less than the foreign-born rate of 16.0% across the entire state of Maryland.
Race distribution in Catonsville
2000 2022
3,286,547 62.1% White alone 1,464,735 27.7% Black alone 227,916 4.3% Hispanic 209,738 4.0% Asian alone 82,946 1.6% Two or more races 13,312 0.3% American Indian alone 9,379 0.2% Other race alone 1,913 0.04% Native Hawaiian and Other
2,906,492 47.1% White alone 1,800,914 29.2% Black alone 705,842 11.4% Hispanic 401,818 6.5% Asian alone 291,317 4.7% Two or more races 46,930 0.8% Other race alone 8,930 0.1% American Indian alone 2,417 0.04% Native Hawaiian and Other
Income and house value in Catonsville Median household income in 2022 $106,663 White non-Hispanic householders$69,058 Black householders$83,593 Asian householders$78,014 Some other race householders$109,267 Two or more races householders$91,192 Hispanic or Latino race householdersMedian 2022 house value $415,681 White Non-Hispanic householders$340,341 Black or African American householders$327,251 American Indian or Alaska Native householders $359,831 Asian householders$448,552 Some other race householders$458,151 Two or more races householders$475,023 Hispanic or Latino householders
Median age by race in Catonsville
46.7 Median age for White residents43.4 50.8 34.9 Median age for Black or African American residents29.6 38.1 74.3 Median age for American Indian / Alaska Native residents-867,632,849.4 -677,419,354.2 29.2 Median age for Asian residents25.8 38.4 144.0 Median age for Native Hawaiian / Pacific Islander residents73.9 -760,942,760.2 16.7 Median age for Other race residents9.0 19.6 20.0 Median age for Two or more races residents20.9 18.2 46.8 Median age for White alone residents43.6 51.1 19.1 Median age for Hispanic or Latino residents16.5 20.6
Owner/renter occupied households by race in Catonsville
House owners and renters - White residents 9,110 79.7% Owner occupied2,320 20.3% Renter occupiedHouse owners and renters - Black or African American residents 1,279 45.7% Owner occupied1,521 54.3% Renter occupiedHouse owners and renters - American Indian / Alaska Native residents 46 100.0% Renter occupiedHouse owners and renters - Asian residents 576 63.4% Owner occupied333 36.6% Renter occupiedHouse owners and renters - Native Hawaiian / Pacific Islander residents 81 90.7% Owner occupied8 9.3% Renter occupiedHouse owners and renters - Other race residents 116 71.6% Owner occupied46 28.4% Renter occupiedHouse owners and renters - Two or more races residents 451 51.7% Owner occupied420 48.3% Renter occupiedHouse owners and renters - White alone residents 9,057 79.7% Owner occupied2,301 20.3% Renter occupiedHouse owners and renters - Hispanic or Latino residents 356 57.6% Owner occupied262 42.4% Renter occupied
Language usage in Catonsville
English speakers - Total 86.4% of residents of Catonsville speak English at home.
2.5% of residents speak Spanish at home 654 62.9% Speak English very well385 37.1% Speak English less than very well11.1% of residents speak other language at home 2,920 64.3% Speak English very well1,619 35.7% Speak English less than very well
English speakers - Born in the United States 94.7% of residents of Catonsville speak English at home.
0.8% of residents speak Spanish at home 50 54.9% Speak English very well41 45.1% Speak English less than very well4.4% of residents speak other language at home 427 88.4% Speak English very well56 11.6% Speak English less than very well
English speakers - Native, born elsewhere 76.1% of residents of Catonsville speak English at home.
8.9% of residents speak Spanish at home 46 100.0% Speak English very well13.3% of residents speak other language at home 45 65.2% Speak English very well24 34.8% Speak English less than very well
English speakers - Foreign-born 31.7% of residents of Catonsville speak English at home.
11.5% of residents speak Spanish at home 244 39.4% Speak English very well375 60.6% Speak English less than very well58.0% of residents speak other language at home 1,692 54.1% Speak English very well1,433 45.9% Speak English less than very well
White (Caucasian) - Speak only English Native:
98.5% (23,876)Foreign-born:
34.4% (261)
White (Caucasian) - Speak another language Native:
1.8% (435)Foreign-born:
66.4% (505)
Black or African American - Speak only English Native:
95.9% (6,628)Foreign-born:
44.2% (467)
Black or African American - Speak another language Native:
3.7% (256)Foreign-born:
55.2% (584)
Asian - Speak only English Native:
24.2% (230)Foreign-born:
23.5% (588)
Asian - Speak another language Native:
75.4% (716)Foreign-born:
77.9% (1,955)
Native Hawaiian / Pacific Islander - Speak only English Native:
100.0% (90)Foreign-born:
84.6% (21)
Other race - Speak only English Native:
65.5% (162)Foreign-born:
11.5% (66)
Other race - Speak another language Native:
35.0% (87)Foreign-born:
87.8% (502)
Two or more races - Speak only English Native:
93.5% (2,544)Foreign-born:
65.3% (314)
Two or more races - Speak another language Native:
7.3% (198)Foreign-born:
45.1% (217)
White alone - Speak only English Native:
98.5% (23,666)Foreign-born:
30.7% (234)
White alone - Speak another language Native:
1.6% (389)Foreign-born:
69.1% (527)
Hispanic or Latino - Speak only English Native:
82.4% (1,001)Foreign-born:
14.7% (116)
Hispanic or Latino - Speak another language Native:
24.3% (295)Foreign-born:
85.3% (675)
Foreign-born residents in Catonsville 5,430 residents are foreign born (6.0% Asia , 2.4% Africa , 1.8% Latin America , 1.7% Europe ).
This city:
12.8%Maryland:
15.7%
Marital status for residents in Catonsville Marital status - White (Caucasian) population 15 years and over
Males 35.5% Never married53.2% Now married1.4% Separated3.7% Widowed6.1% DivorcedFemales 28.0% Never married44.2% Now married0.7% Separated15.7% Widowed11.4% DivorcedWomen who gave birth in the past 12 months Now married:
93.3% (220)Unmarried:
6.7% (16)
Women who did not give birth in the past 12 months Now married:
39.3% (1,985)Unmarried:
60.7% (3,061)
Marital status - Black or African American population 15 years and over
Males 58.4% Never married24.8% Now married0.2% Separated5.0% Widowed11.7% DivorcedFemales 52.9% Never married18.9% Now married1.6% Separated14.9% Widowed11.8% DivorcedWomen who gave birth in the past 12 months Now married:
11.3% (18)Unmarried:
88.7% (141)
Women who did not give birth in the past 12 months Now married:
21.7% (461)Unmarried:
78.3% (1,660)
Marital status - American Indian / Alaska Native population 15 years and over
Males 47.4% Never married52.6% Now married0.0% Separated0.0% Widowed0.0% DivorcedFemales 0.0% Never married0.0% Now married100.0% Separated0.0% Widowed0.0% DivorcedMarital status - Asian population 15 years and over
Males 51.9% Never married46.4% Now married0.4% Separated0.0% Widowed1.4% DivorcedFemales 34.3% Never married56.0% Now married0.0% Separated7.4% Widowed2.4% DivorcedWomen who gave birth in the past 12 months Now married:
79.1% (33)Unmarried:
20.9% (9)
Women who did not give birth in the past 12 months Now married:
47.7% (418)Unmarried:
52.3% (460)
Marital status - Other race population 15 years and over
Males 56.5% Never married43.5% Now married0.0% Separated0.0% Widowed0.0% DivorcedFemales 64.7% Never married31.4% Now married0.0% Separated0.0% Widowed3.9% DivorcedWomen who gave birth in the past 12 months Now married:
100.0% (32)Unmarried:
0.0% (0)
Women who did not give birth in the past 12 months Now married:
23.6% (57)Unmarried:
76.4% (185)
Marital status - Two or more races population 15 years and over
Males 65.2% Never married30.3% Now married0.0% Separated1.6% Widowed3.0% DivorcedFemales 68.0% Never married22.0% Now married5.1% Separated1.7% Widowed3.2% DivorcedWomen who gave birth in the past 12 months Now married:
100.0% (17)Unmarried:
0.0% (0)
Women who did not give birth in the past 12 months Now married:
21.4% (200)Unmarried:
78.6% (735)
Marital status - White alone, not Hispanic / Latino population 15 years and over
Males 34.9% Never married53.6% Now married1.4% Separated3.8% Widowed6.2% DivorcedFemales 27.7% Never married44.2% Now married0.7% Separated15.9% Widowed11.4% DivorcedWomen who gave birth in the past 12 months Now married:
93.3% (222)Unmarried:
6.7% (16)
Women who did not give birth in the past 12 months Now married:
39.9% (1,979)Unmarried:
60.1% (2,982)
Marital status - Hispanic or Latino population 15 years and over
Males 51.9% Never married48.1% Now married0.0% Separated0.0% Widowed0.0% DivorcedFemales 57.4% Never married35.9% Now married0.0% Separated1.4% Widowed5.3% DivorcedWomen who gave birth in the past 12 months Now married:
100.0% (31)Unmarried:
0.0% (0)
Women who did not give birth in the past 12 months Now married:
27.8% (181)Unmarried:
72.2% (472)
Ancestries in Catonsville
1,720 8.5% German1,474 7.3% Irish1,209 6.0% English911 4.5% European833 4.1% American756 3.7% Italian495 2.4% African366 1.8% Polish271 1.3% Afghan268 1.3% Ethiopian254 1.3% Nigerian231 1.1% Ukrainian202 1.0% Albanian158 0.8% Russian142 0.7% Scandinavian124 0.6% Scottish119 0.6% Norwegian97 0.5% Ghanaian95 0.5% British88 0.4% Lithuanian87 0.4% Welsh81 0.4% Swiss80 0.4% Greek66 0.3% French Canadian62 0.3% French54 0.3% Eastern European49 0.2% Haitian47 0.2% Scotch-Irish46 0.2% Swedish42 0.2% Danish32 0.2% Egyptian31 0.2% Dutch28 0.1% Romanian28 0.1% Jamaican28 0.1% Trinidadian and Tobagonian26 0.1% Slovak26 0.1% Austrian25 0.1% Northern European24 0.1% Czech20 0.10% Portuguese18 0.09% Finnish14 0.07% Moroccan14 0.07% Icelander12 0.06% Iranian11 0.05% Cajun11 0.05% British West Indian10 0.05% Jordanian9 0.04% Canadian9 0.04% Belgian8 0.04% Yugoslavian7 0.03% Serbian4 0.02% Croatian
Geographical mobility in Catonsville Same house 1 year ago 23,005 89.5% White (Caucasian)6,533 80.2% Black or African American60 98.9% American Indian / Alaska Native3,079 87.2% Asian28 23.9% Native Hawaiian / Pacific Islander671 94.4% Other race2,714 79.5% Two or more races22,915 89.6% White alone, not Hispanic / Latino1,804 86.5% Hispanic or LatinoMoved within same county 747 2.9% White / Caucasian415 5.1% Black or African American60 1.7% Asian7 6.0% Native Hawaiian / Pacific Islander59 1.7% Two or more races761 3.0% White alone, not Hispanic / Latino79 3.8% Hispanic or LatinoMoved within same state 1,438 5.6% White / Caucasian851 10.4% Black or African American333 9.4% Asian86 73.4% Native Hawaiian / Pacific Islander15 2.1% Other race551 16.2% Two or more races1,372 5.4% White alone, not Hispanic / Latino172 8.3% Hispanic or LatinoMoved from different state 370 1.4% White / Caucasian120 1.5% Black or African American28 0.8% Asian36 5.0% Other race103 3.0% Two or more races366 1.4% White alone, not Hispanic / Latino135 6.5% Hispanic or LatinoMoved from abroad 205 0.8% White133 1.6% Black or African American56 1.6% Asian29 0.8% Two or more races191 0.7% White alone, not Hispanic / Latino14 0.7% Hispanic or Latino
Children Nativity (place of birth) in Catonsville
Children under 6 years - Living with two parents Both parents native 1,181 100.0% NativeBoth parents foreign-born 280 100.0% NativeOne native, one foreign-born parent 155 100.0% NativeChildren under 6 years - Living with one parent Native parent 323 100.0% NativeForeign-born parent 52 100.0% NativeChildren 6 to 17 years - Living with two parents Both parents native 2,973 98.9% Native32 1.1% Foreign-bornBoth parents foreign-born 479 51.3% Native455 48.7% Foreign-bornOne native, one foreign-born parent 334 100.0% NativeChildren 6 to 17 years - Living with one parent Native parent 1,215 100.0% NativeForeign-born parent 448 60.8% Native288 39.2% Foreign-born
Grandparents responsible for own grandchildren in Catonsville
Grandparents (30 to 59 years) White / Caucasian 18 100.0% Not responsible for grandchildrenBlack or African American 6 27.6% Responsible for grandchildren15 72.4% Not responsible for grandchildrenAsian 6 100.0% Responsible for grandchildrenWhite alone, not Hispanic / Latino 17 100.0% Not responsible for grandchildrenGrandparents (60 years and over) White / Caucasian 93 43.9% Responsible for grandchildren119 56.1% Not responsible for grandchildrenBlack or African American 39 36.8% Responsible for grandchildren67 63.2% Not responsible for grandchildrenAsian 69 100.0% Not responsible for grandchildrenWhite alone, not Hispanic / Latino 95 43.2% Responsible for grandchildren125 56.8% Not responsible for grandchildren