Races in Cedar Lake, Indiana (IN) Detailed Stats
Data:
Races - White alone (%)
Races - White alone (% change since 2000)
Races - Black alone (%)
Races - Black alone (% change since 2000)
Races - American Indian alone (%)
Races - American Indian alone (% change since 2000)
Races - Asian alone (%)
Races - Asian alone (% change since 2000)
Races - Hispanic (%)
Races - Hispanic (% change since 2000)
Races - Native Hawaiian and Other Pacific Islander alone (%)
Races - Native Hawaiian and Other Pacific Islander alone (% change since 2000)
Races - Two or more races(%)
Races - Two or more races(% change since 2000)
Races - Other race alone (%)
Races - Other race alone (% change since 2000)
Racial diversity
Place of birth - Born in state of residence (%)
Place of birth - Born in state of residence (%) - White
Place of birth - Born in state of residence (%) - Black or African American
Place of birth - Born in state of residence (%) - Asian
Place of birth - Born in state of residence (%) - Hispanic or Latino
Place of birth - Born in state of residence (%) - American Indian and Alaska Native
Place of birth - Born in state of residence (%) - Multirace
Place of birth - Born in state of residence (%) - Other Race
Place of birth - Born in other state (%)
Place of birth - Born in other state (%) - White
Place of birth - Born in other state (%) - Black or African American
Place of birth - Born in other state (%) - Asian
Place of birth - Born in other state (%) - Hispanic or Latino
Place of birth - Born in other state (%) - American Indian and Alaska Native
Place of birth - Born in other state (%) - Multirace
Place of birth - Born in other state (%) - Other Race
Place of birth - Native, outside of US (%)
Place of birth - Native, outside of US (%) - White
Place of birth - Native, outside of US (%) - Black or African American
Place of birth - Native, outside of US (%) - Asian
Place of birth - Native, outside of US (%) - Hispanic or Latino
Place of birth - Native, outside of US (%) - American Indian and Alaska Native
Place of birth - Native, outside of US (%) - Multirace
Place of birth - Native, outside of US (%) - Other Race
Place of birth - Foreign born (%)
Place of birth - Foreign born (%) - White
Place of birth - Foreign born (%) - Black or African American
Place of birth - Foreign born (%) - Asian
Place of birth - Foreign born (%) - Hispanic or Latino
Place of birth - Foreign born (%) - American Indian and Alaska Native
Place of birth - Foreign born (%) - Multirace
Place of birth - Foreign born (%) - Other Race
Residents speaking English at home (%)
Residents speaking English at home - Born in the United States (%)
Residents speaking English at home - Native, born elsewhere (%)
Residents speaking English at home - Foreign born (%)
Residents speaking Spanish at home (%)
Residents speaking Spanish at home - Born in the United States (%)
Residents speaking Spanish at home - Native, born elsewhere (%)
Residents speaking Spanish at home - Foreign born (%)
Residents speaking other language at home (%)
Residents speaking other language at home - Born in the United States (%)
Residents speaking other language at home - Native, born elsewhere (%)
Residents speaking other language at home - Foreign born (%)
Marital status - Never married (%)
Marital status - Now married (%)
Marital status - Separated (%)
Marital status - Widowed (%)
Marital status - Divorced (%)
Ancestries Reported - Arab (%)
Ancestries Reported - Czech (%)
Ancestries Reported - Danish (%)
Ancestries Reported - Dutch (%)
Ancestries Reported - English (%)
Ancestries Reported - French (%)
Ancestries Reported - French Canadian (%)
Ancestries Reported - German (%)
Ancestries Reported - Greek (%)
Ancestries Reported - Hungarian (%)
Ancestries Reported - Irish (%)
Ancestries Reported - Italian (%)
Ancestries Reported - Lithuanian (%)
Ancestries Reported - Norwegian (%)
Ancestries Reported - Polish (%)
Ancestries Reported - Portuguese (%)
Ancestries Reported - Russian (%)
Ancestries Reported - Scotch-Irish (%)
Ancestries Reported - Scottish (%)
Ancestries Reported - Slovak (%)
Ancestries Reported - Subsaharan African (%)
Ancestries Reported - Swedish (%)
Ancestries Reported - Swiss (%)
Ancestries Reported - Ukrainian (%)
Ancestries Reported - United States (%)
Ancestries Reported - Welsh (%)
Ancestries Reported - West Indian (%)
Ancestries Reported - Other (%)
Geographical mobility - Same house 1 year ago (%)
Geographical mobility - Same house 1 year ago (%) - White
Geographical mobility - Same house 1 year ago (%) - Black or African American
Geographical mobility - Same house 1 year ago (%) - Asian
Geographical mobility - Same house 1 year ago (%) - Hispanic or Latino
Geographical mobility - Same house 1 year ago (%) - American Indian and Alaska Native
Geographical mobility - Same house 1 year ago (%) - Multirace
Geographical mobility - Same house 1 year ago (%) - Other Race
Geographical mobility - Moved within same county (%)
Geographical mobility - Moved within same county (%) - White
Geographical mobility - Moved within same county (%) - Black or African American
Geographical mobility - Moved within same county (%) - Asian
Geographical mobility - Moved within same county (%) - Hispanic or Latino
Geographical mobility - Moved within same county (%) - American Indian and Alaska Native
Geographical mobility - Moved within same county (%) - Multirace
Geographical mobility - Moved within same county (%) - Other Race
Geographical mobility - Moved from different county within same state (%)
Geographical mobility - Moved from different county within same state (%) - White
Geographical mobility - Moved from different county within same state (%) - Black or African American
Geographical mobility - Moved from different county within same state (%) - Asian
Geographical mobility - Moved from different county within same state (%) - Hispanic or Latino
Geographical mobility - Moved from different county within same state (%) - American Indian and Alaska Native
Geographical mobility - Moved from different county within same state (%) - Multirace
Geographical mobility - Moved from different county within same state (%) - Other Race
Geographical mobility - Moved from different state (%)
Geographical mobility - Moved from different state (%) - White
Geographical mobility - Moved from different state (%) - Black or African American
Geographical mobility - Moved from different state (%) - Asian
Geographical mobility - Moved from different state (%) - Hispanic or Latino
Geographical mobility - Moved from different state (%) - American Indian and Alaska Native
Geographical mobility - Moved from different state (%) - Multirace
Geographical mobility - Moved from different state (%) - Other Race
Geographical mobility - Moved from abroad (%)
Geographical mobility - Moved from abroad (%) - White
Geographical mobility - Moved from abroad (%) - Black or African American
Geographical mobility - Moved from abroad (%) - Asian
Geographical mobility - Moved from abroad (%) - Hispanic or Latino
Geographical mobility - Moved from abroad (%) - American Indian and Alaska Native
Geographical mobility - Moved from abroad (%) - Multirace
Geographical mobility - Moved from abroad (%) - Other Race
Place of birth for the foreign-born population - Ireland (%)
Place of birth for the foreign-born population - Denmark (%)
Place of birth for the foreign-born population - Norway (%)
Place of birth for the foreign-born population - Sweden (%)
Place of birth for the foreign-born population - United Kingdom (%)
Place of birth for the foreign-born population - England (%)
Place of birth for the foreign-born population - Scotland (%)
Place of birth for the foreign-born population - Other Northern Europe (%)
Place of birth for the foreign-born population - Austria (%)
Place of birth for the foreign-born population - Belgium (%)
Place of birth for the foreign-born population - France (%)
Place of birth for the foreign-born population - Germany (%)
Place of birth for the foreign-born population - Netherlands (%)
Place of birth for the foreign-born population - Switzerland (%)
Place of birth for the foreign-born population - Other Western Europe (%)
Place of birth for the foreign-born population - Greece (%)
Place of birth for the foreign-born population - Italy (%)
Place of birth for the foreign-born population - Portugal (%)
Place of birth for the foreign-born population - Spain (%)
Place of birth for the foreign-born population - Other Southern Europe (%)
Place of birth for the foreign-born population - Albania (%)
Place of birth for the foreign-born population - Belarus (%)
Place of birth for the foreign-born population - Bosnia and Herzegovina (%)
Place of birth for the foreign-born population - Bulgaria (%)
Place of birth for the foreign-born population - Croatia (%)
Place of birth for the foreign-born population - Czechoslovakia (%)
Place of birth for the foreign-born population - Hungary (%)
Place of birth for the foreign-born population - Latvia (%)
Place of birth for the foreign-born population - Lithuania (%)
Place of birth for the foreign-born population - North Macedonia (Macedonia) (%)
Place of birth for the foreign-born population - Moldova (%)
Place of birth for the foreign-born population - Poland (%)
Place of birth for the foreign-born population - Romania (%)
Place of birth for the foreign-born population - Russia (%)
Place of birth for the foreign-born population - Serbia (%)
Place of birth for the foreign-born population - Ukraine (%)
Place of birth for the foreign-born population - Other Eastern Europe (%)
Place of birth for the foreign-born population - China (%)
Place of birth for the foreign-born population - Hong Kong (%)
Place of birth for the foreign-born population - Taiwan (%)
Place of birth for the foreign-born population - Japan (%)
Place of birth for the foreign-born population - Korea (%)
Place of birth for the foreign-born population - Other Eastern Asia (%)
Place of birth for the foreign-born population - Afghanistan (%)
Place of birth for the foreign-born population - Bangladesh (%)
Place of birth for the foreign-born population - India (%)
Place of birth for the foreign-born population - Iran (%)
Place of birth for the foreign-born population - Kazakhstan (%)
Place of birth for the foreign-born population - Nepal (%)
Place of birth for the foreign-born population - Pakistan (%)
Place of birth for the foreign-born population - Sri Lanka (%)
Place of birth for the foreign-born population - Uzbekistan (%)
Place of birth for the foreign-born population - Other South Central Asia (%)
Place of birth for the foreign-born population - Burma (%)
Place of birth for the foreign-born population - Cambodia (%)
Place of birth for the foreign-born population - Indonesia (%)
Place of birth for the foreign-born population - Laos (%)
Place of birth for the foreign-born population - Malaysia (%)
Place of birth for the foreign-born population - Philippines (%)
Place of birth for the foreign-born population - Singapore (%)
Place of birth for the foreign-born population - Thailand (%)
Place of birth for the foreign-born population - Vietnam (%)
Place of birth for the foreign-born population - Other South Eastern Asia (%)
Place of birth for the foreign-born population - Armenia (%)
Place of birth for the foreign-born population - Iraq (%)
Place of birth for the foreign-born population - Israel (%)
Place of birth for the foreign-born population - Jordan (%)
Place of birth for the foreign-born population - Kuwait (%)
Place of birth for the foreign-born population - Lebanon (%)
Place of birth for the foreign-born population - Saudi Arabia (%)
Place of birth for the foreign-born population - Syria (%)
Place of birth for the foreign-born population - Turkey (%)
Place of birth for the foreign-born population - Yemen (%)
Place of birth for the foreign-born population - Other Western Asia (%)
Place of birth for the foreign-born population - Eritrea (%)
Place of birth for the foreign-born population - Ethiopia (%)
Place of birth for the foreign-born population - Kenya (%)
Place of birth for the foreign-born population - Somalia (%)
Place of birth for the foreign-born population - Uganda (%)
Place of birth for the foreign-born population - Zimbabwe (%)
Place of birth for the foreign-born population - Other Eastern Africa (%)
Place of birth for the foreign-born population - Cameroon (%)
Place of birth for the foreign-born population - Congo (%)
Place of birth for the foreign-born population - Democratic Republic of Congo (Zaire) (%)
Place of birth for the foreign-born population - Other Middle Africa (%)
Place of birth for the foreign-born population - Egypt (%)
Place of birth for the foreign-born population - Morocco (%)
Place of birth for the foreign-born population - Sudan (%)
Place of birth for the foreign-born population - Other Northern Africa (%)
Place of birth for the foreign-born population - South Africa (%)
Place of birth for the foreign-born population - Other Southern Africa (%)
Place of birth for the foreign-born population - Cabo Verde (%)
Place of birth for the foreign-born population - Ghana (%)
Place of birth for the foreign-born population - Liberia (%)
Place of birth for the foreign-born population - Nigeria (%)
Place of birth for the foreign-born population - Senegal (%)
Place of birth for the foreign-born population - Sierra Leone (%)
Place of birth for the foreign-born population - Other Western Africa (%)
Place of birth for the foreign-born population - Australia (%)
Place of birth for the foreign-born population - New Zealand (%)
Place of birth for the foreign-born population - Fiji (%)
Place of birth for the foreign-born population - Micronesia (%)
Place of birth for the foreign-born population - Bahamas (%)
Place of birth for the foreign-born population - Barbados (%)
Place of birth for the foreign-born population - Cuba (%)
Place of birth for the foreign-born population - Dominica (%)
Place of birth for the foreign-born population - Dominican Republic (%)
Place of birth for the foreign-born population - Grenada (%)
Place of birth for the foreign-born population - Haiti (%)
Place of birth for the foreign-born population - Jamaica (%)
Place of birth for the foreign-born population - St. Vincent and the Grenadines (%)
Place of birth for the foreign-born population - Trinidad and Tobago (%)
Place of birth for the foreign-born population - West Indies (%)
Place of birth for the foreign-born population - Other Caribbean (%)
Place of birth for the foreign-born population - Belize (%)
Place of birth for the foreign-born population - Costa Rica (%)
Place of birth for the foreign-born population - El Salvador (%)
Place of birth for the foreign-born population - Guatemala (%)
Place of birth for the foreign-born population - Honduras (%)
Place of birth for the foreign-born population - Mexico (%)
Place of birth for the foreign-born population - Nicaragua (%)
Place of birth for the foreign-born population - Panama (%)
Place of birth for the foreign-born population - Other Central America (%)
Place of birth for the foreign-born population - Argentina (%)
Place of birth for the foreign-born population - Bolivia (%)
Place of birth for the foreign-born population - Brazil (%)
Place of birth for the foreign-born population - Chile (%)
Place of birth for the foreign-born population - Colombia (%)
Place of birth for the foreign-born population - Ecuador (%)
Place of birth for the foreign-born population - Guyana (%)
Place of birth for the foreign-born population - Peru (%)
Place of birth for the foreign-born population - Uruguay (%)
Place of birth for the foreign-born population - Venezuela (%)
Place of birth for the foreign-born population - Other South America (%)
Place of birth for the foreign-born population - Canada (%)
Place of birth for the foreign-born population - Other Northern America (%)
Place of birth for the foreign-born population - Other (%)
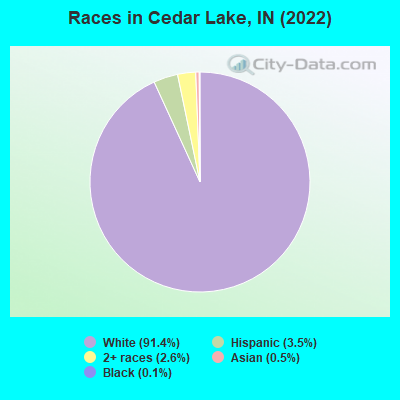
According to 2022 data, the most numerous races in Cedar Lake, IN are White alone (13,049 residents), Black alone (15 residents), and Hispanic (493 residents). 92.7% of Cedar Lake residents speak English at home. 2.8% of Cedar Lake, IN residents are foreign-born (1.8% born in Europe, 0.7% born in Latin America), which is 113.0% less than the foreign-born rate of 6.0% across the entire state of Indiana.
Race distribution in Cedar Lake
2000 2022
5,219,373 85.8% White alone 505,462 8.3% Black alone 214,536 3.5% Hispanic 61,115 1.0% Two or more races 58,424 1.0% Asian alone 13,654 0.2% American Indian alone 6,348 0.1% Other race alone 1,573 0.03% Native Hawaiian and Other
5,192,455 76.0% White alone 628,054 9.2% Black alone 534,528 7.8% Hispanic 263,242 3.9% Two or more races 172,880 2.5% Asian alone 33,467 0.5% Other race alone 5,866 0.09% American Indian alone 2,545 0.04% Native Hawaiian and Other
Income and house value in Cedar Lake Median household income in 2022 $78,484 White non-Hispanic householders$167,004 Two or more races householdersMedian 2022 house value $267,807 White Non-Hispanic householders $196,538 Asian householders$223,949 Two or more races householders$243,411 Hispanic or Latino householders
Median age by race in Cedar Lake
41.0 Median age for White residents41.0 40.6 -649,669,498.9 Median age for Black or African American residents-639,751,552.2 -650,580,875.1 -483,210,482.7 Median age for American Indian / Alaska Native residents-531,041,069.2 -482,477,587.1 63.6 Median age for Asian residents-689,473,683.5 64.5 -664,335,663.7 Median age for Native Hawaiian / Pacific Islander residents-644,025,156.6 -664,437,011.6 32.3 Median age for Other race residents18.0 33.2 17.1 Median age for Two or more races residents33.5 10.1 40.4 Median age for White alone residents41.3 40.6 25.6 Median age for Hispanic or Latino residents25.9 25.6
Owner/renter occupied households by race in Cedar Lake
House owners and renters - White residents 4,078 80.8% Owner occupied969 19.2% Renter occupiedHouse owners and renters - Black or African American residents 11 100.0% Owner occupiedHouse owners and renters - Other race residents 21 65.4% Owner occupied11 34.6% Renter occupiedHouse owners and renters - Two or more races residents 42 50.5% Owner occupied42 49.5% Renter occupiedHouse owners and renters - White alone residents 4,146 80.2% Owner occupied1,024 19.8% Renter occupiedHouse owners and renters - Hispanic or Latino residents 99 90.9% Owner occupied10 9.1% Renter occupied
Language usage in Cedar Lake
English speakers - Total 92.7% of residents of Cedar Lake speak English at home.
1.5% of residents speak Spanish at home 147 71.7% Speak English very well58 28.3% Speak English less than very well4.8% of residents speak other language at home 628 96.5% Speak English very well23 3.5% Speak English less than very well
English speakers - Born in the United States 96.0% of residents of Cedar Lake speak English at home.
2.1% of residents speak Spanish at home 116 92.1% Speak English very well10 7.9% Speak English less than very well0.9% of residents speak other language at home 53 100.0% Speak English very well
English speakers - Native, born elsewhere 92.3% of residents of Cedar Lake speak English at home.
English speakers - Foreign-born 32.6% of residents of Cedar Lake speak English at home.
17.4% of residents speak Spanish at home 21 31.3% Speak English very well46 68.7% Speak English less than very well51.0% of residents speak other language at home 175 89.3% Speak English very well21 10.7% Speak English less than very well
White (Caucasian) - Speak only English Native:
96.6% (11,394)Foreign-born:
30.2% (69)
White (Caucasian) - Speak another language Native:
3.6% (421)Foreign-born:
66.7% (152)
Asian - Speak only English Native:
76.9% (27)Foreign-born:
53.7% (10)
Asian - Speak another language Native:
23.1% (8)Foreign-born:
54.6% (10)
Two or more races - Speak only English Native:
86.7% (486)Foreign-born:
87.5% (23)
White alone - Speak only English Native:
95.5% (11,476)Foreign-born:
23.3% (66)
White alone - Speak another language Native:
4.7% (566)Foreign-born:
73.5% (208)
Hispanic or Latino - Speak only English Native:
88.8% (323)Foreign-born:
17.2% (14)
Hispanic or Latino - Speak another language Native:
8.4% (31)Foreign-born:
82.9% (70)
Foreign-born residents in Cedar Lake 402 residents are foreign born (1.8% Europe , 0.7% Latin America ).
This city:
2.8%Indiana:
5.6%
Marital status for residents in Cedar Lake Marital status - White (Caucasian) population 15 years and over
Males 28.2% Never married55.6% Now married0.4% Separated6.2% Widowed9.6% DivorcedFemales 27.2% Never married53.4% Now married1.3% Separated8.1% Widowed9.9% DivorcedWomen who gave birth in the past 12 months Now married:
91.5% (242)Unmarried:
8.5% (22)
Women who did not give birth in the past 12 months Now married:
45.8% (1,244)Unmarried:
54.2% (1,474)
Marital status - Other race population 15 years and over
Males 100.0% Never married0.0% Now married0.0% Separated0.0% Widowed0.0% DivorcedFemales 0.0% Never married57.1% Now married13.0% Separated1.3% Widowed28.6% DivorcedWomen who did not give birth in the past 12 months Now married:
66.7% (42)Unmarried:
33.3% (21)
Marital status - Two or more races population 15 years and over
Males 38.1% Never married45.9% Now married0.0% Separated0.0% Widowed16.0% DivorcedFemales 37.5% Never married62.5% Now married0.0% Separated0.0% Widowed0.0% DivorcedWomen who did not give birth in the past 12 months Now married:
46.4% (20)Unmarried:
53.6% (23)
Marital status - White alone, not Hispanic / Latino population 15 years and over
Males 28.2% Never married55.6% Now married0.4% Separated6.3% Widowed9.5% DivorcedFemales 27.4% Never married53.2% Now married1.3% Separated8.1% Widowed10.1% DivorcedWomen who gave birth in the past 12 months Now married:
91.5% (251)Unmarried:
8.5% (23)
Women who did not give birth in the past 12 months Now married:
45.7% (1,278)Unmarried:
54.3% (1,517)
Marital status - Hispanic or Latino population 15 years and over
Males 56.4% Never married36.8% Now married0.0% Separated0.0% Widowed6.8% DivorcedFemales 7.0% Never married64.3% Now married7.0% Separated6.3% Widowed15.4% DivorcedWomen who did not give birth in the past 12 months Now married:
63.2% (58)Unmarried:
36.8% (34)
Ancestries in Cedar Lake
872 16.8% Polish697 13.4% Italian655 12.6% German594 11.4% Irish445 8.6% Dutch235 4.5% Greek215 4.1% English204 3.9% American165 3.2% European81 1.6% Lithuanian63 1.2% Macedonian61 1.2% Croatian41 0.8% Serbian36 0.7% British36 0.7% French Canadian36 0.7% Yugoslavian26 0.5% Scotch-Irish24 0.5% Hungarian15 0.3% Slovak14 0.3% Danish14 0.3% French12 0.2% Portuguese9 0.2% Norwegian8 0.2% Ukrainian
Children Nativity (place of birth) in Cedar Lake
Children under 6 years - Living with two parents Both parents native 710 99.3% Native5 0.7% Foreign-bornChildren under 6 years - Living with one parent Native parent 271 100.0% NativeForeign-born parent 11 100.0% NativeChildren 6 to 17 years - Living with two parents Both parents native 1,588 99.6% Native6 0.4% Foreign-bornChildren 6 to 17 years - Living with one parent Native parent 694 94.3% Native42 5.7% Foreign-bornForeign-born parent 40 100.0% Native
Grandparents responsible for own grandchildren in Cedar Lake
Grandparents (30 to 59 years) White / Caucasian 8 8.3% Responsible for grandchildren89 91.7% Not responsible for grandchildrenWhite alone, not Hispanic / Latino 8 8.1% Responsible for grandchildren95 91.9% Not responsible for grandchildren
Grandparents (60 years and over) White / Caucasian 98 100.0% Not responsible for grandchildrenWhite alone, not Hispanic / Latino 95 100.0% Not responsible for grandchildren