Races in Central Pencader, Delaware (DE) Detailed Stats
Ancestries, Foreign-born residents, place of birth
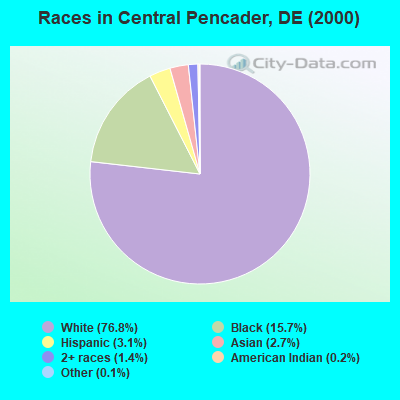
Race distribution in Central Pencader

- 24,65276.8%White alone
- 5,03315.7%Black alone
- 9853.1%Hispanic
- 8652.7%Asian alone
- 4361.4%Two or more races
- 710.2%American Indian alone
- 470.1%Other race alone
- 70.02%Native Hawaiian and Other
Pacific Islander alone
2000
2022
-
- 567,97372.5%White alone
- 148,43518.9%Black alone
- 37,2774.8%Hispanic
- 16,1102.1%Asian alone
- 10,2221.3%Two or more races
- 2,3240.3%American Indian alone
- 1,0250.1%Other race alone
- 2340.03%Native Hawaiian and Other
Pacific Islander alone

-
- 599,34758.9%White alone
- 220,01021.6%Black alone
- 105,30010.3%Hispanic
- 46,0164.5%Two or more races
- 41,3504.1%Asian alone
- 5,0970.5%Other race alone
- 1,2760.1%American Indian alone

Income and house value in Central Pencader
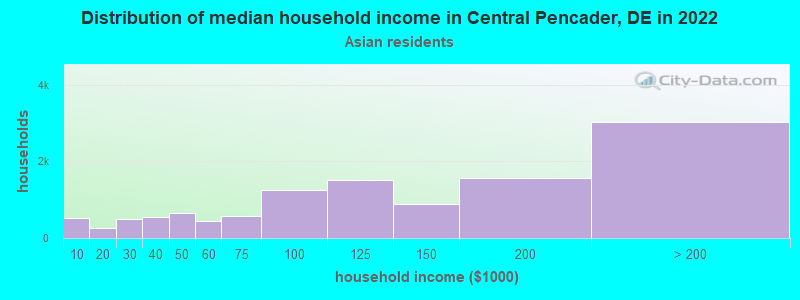
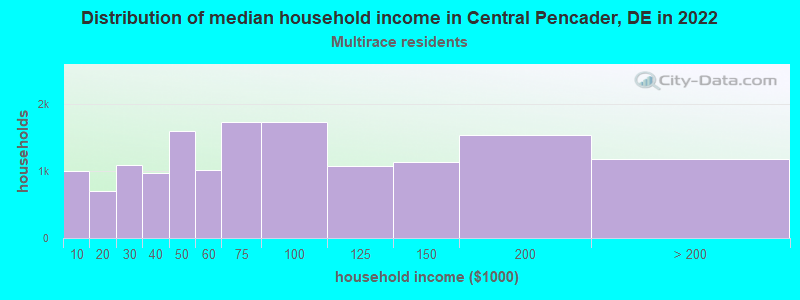
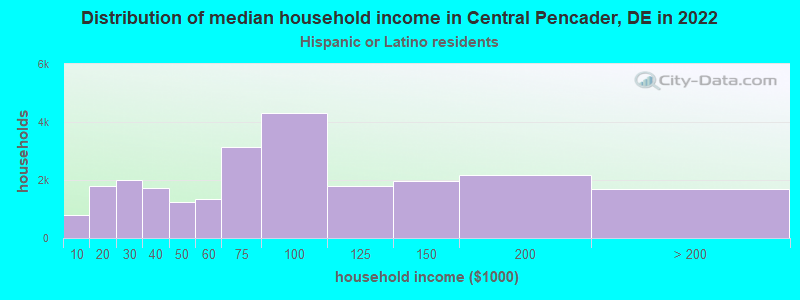
- Median household income in 2022
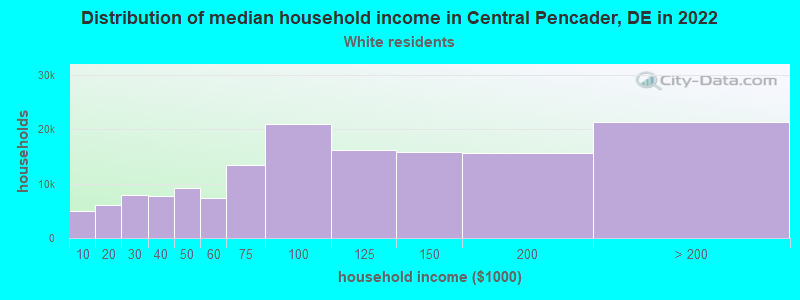
- $104,728White non-Hispanic householders
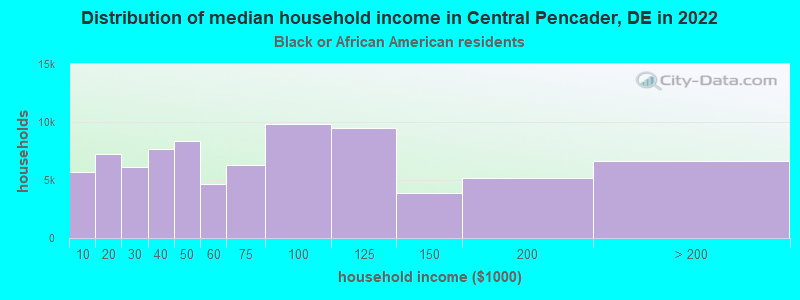
- $91,452Black householders
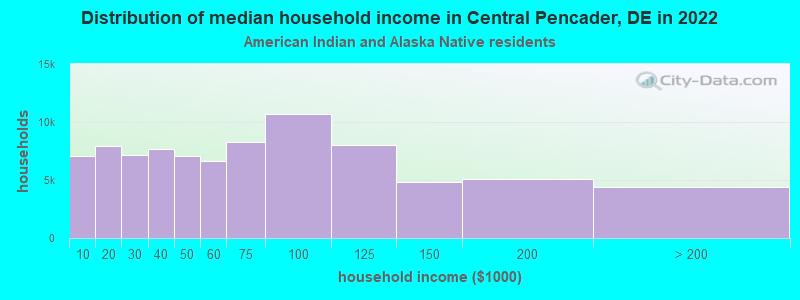
- $4,381American Indian and Alaska Native householders
- $104,154Asian householders
- $107,344Some other race householders
- $65,315Two or more races householders
- $96,390Hispanic or Latino race householders
- Median 2022 house value
- $392,648White Non-Hispanic householders
- $368,496Black or African American householders
- $236,534American Indian or Alaska Native householders
- $413,313Asian householders
- $360,280Some other race householders
- $390,656Two or more races householders
- $333,140Hispanic or Latino householders
Household income for White non-Hispanic householders
Household income for Black householders
Household income for American Indian and Alaska Native householders
Household income for Asian householders
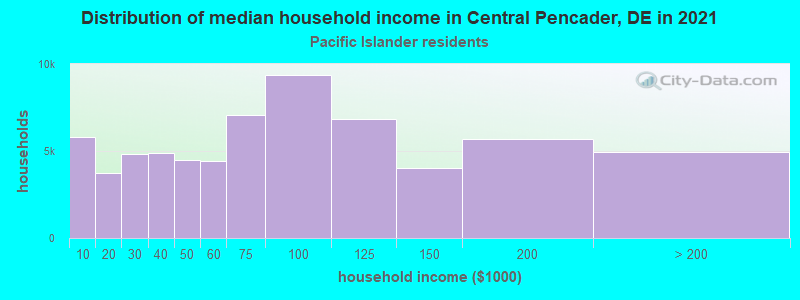
Household income for Native Hawaiian and other Pacific Islander householders
Household income for Two or more races householders
Household income for Hispanic or Latino race householders
Zip code: 19701