Races in Central Valley, New York (NY) Detailed Stats
Ancestries, Foreign-born residents, place of birth

Recent posts about races in Central Valley, New York on our local forum with over 2,400,000 registered users:
 | smaller Upstate NY cities and towns/African American communities (5949 replies) |
| Asian communities in Upstate NY (591 replies) |
| Would you leave NYC for a free house in the Bay Area? (44 replies) |
| NYC to Monroe (5 replies) |
| NYSPHAA Races (0 replies) |
| Guess which city has the 3rd highest average home sales price increase? (15 replies) |
7.2% of Central Valley, NY residents are foreign-born (3.2% born in Latin America, 2.6% born in Europe, 1.5% born in Asia), which is 204.9% less than the foreign-born rate of 22.0% across the entire state of New York.
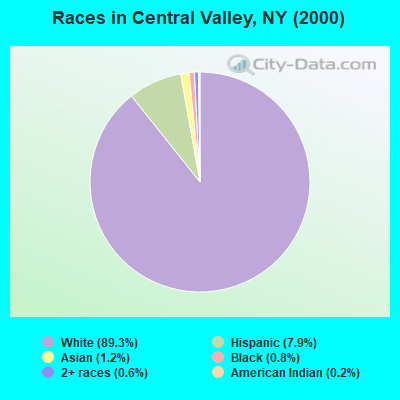
Race distribution in Central Valley

- 1,65889.3%White alone
- 1477.9%Hispanic
- 231.2%Asian alone
- 140.8%Black alone
- 120.6%Two or more races
- 30.2%American Indian alone
2000
2022
-
- 11,760,98162.0%White alone
- 2,867,58315.1%Hispanic
- 2,812,62314.8%Black alone
- 1,035,9265.5%Asian alone
- 366,1161.9%Two or more races
- 75,4990.4%Other race alone
- 52,4990.3%American Indian alone
- 5,2300.03%Native Hawaiian and Other
Pacific Islander alone

-
- 10,408,93352.9%White alone
- 3,867,29919.7%Hispanic
- 2,633,84013.4%Black alone
- 1,776,2869.0%Asian alone
- 732,6703.7%Two or more races
- 216,1101.1%Other race alone
- 35,0820.2%American Indian alone
- 6,9310.04%Native Hawaiian and Other
Pacific Islander alone

Income and house value in Central Valley
- Median household income in 2022
- $114,285White non-Hispanic householders
- over $200,000Black householders
- $56,154Asian householders
- over $200,000Some other race householders
- $14,183Two or more races householders
- $150,514Hispanic or Latino race householders
- Median 2022 house value
- $541,249White Non-Hispanic householders
- $426,749Black or African American householders
- $459,575Some other race householders
- $492,402Hispanic or Latino householders
Household income for White non-Hispanic householders

Household income for Black householders

Household income for Asian householders

Household income for Two or more races householders

Household income for Hispanic or Latino race householders

Foreign-born residents in Central Valley
134 residents are foreign born (3.2% Latin America, 2.6% Europe, 1.5% Asia).
| This city: | 7.2% |
| New York: | 20.4% |
Ancestries in Central Valley

- 56724.1%Irish
- 37616.0%Italian
- 37115.8%German
- 30112.8%Other
- 1667.1%English
- 1124.8%United States
- 723.1%Dutch
- 582.5%French
- 502.1%Polish
- 492.1%Russian
- 431.8%Hungarian
- 271.1%Ukrainian
- 241.0%Scottish
- 231.0%Norwegian
- 220.9%Czech
- 160.7%Swedish
- 130.6%Greek
- 120.5%French Canadian
- 110.5%Swiss
- 100.4%West Indian
- 70.3%Portuguese
- 70.3%Slovak
- 60.3%Scotch-Irish
- 60.3%Welsh
- 50.2%Lithuanian

Zip codes: 10917.