Races in Champlin, Minnesota (MN) Detailed Stats
Data:
Races - White alone (%)
Races - White alone (% change since 2000)
Races - Black alone (%)
Races - Black alone (% change since 2000)
Races - American Indian alone (%)
Races - American Indian alone (% change since 2000)
Races - Asian alone (%)
Races - Asian alone (% change since 2000)
Races - Hispanic (%)
Races - Hispanic (% change since 2000)
Races - Native Hawaiian and Other Pacific Islander alone (%)
Races - Native Hawaiian and Other Pacific Islander alone (% change since 2000)
Races - Two or more races(%)
Races - Two or more races(% change since 2000)
Races - Other race alone (%)
Races - Other race alone (% change since 2000)
Racial diversity
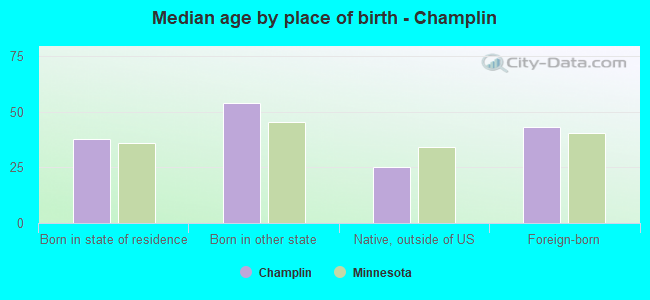
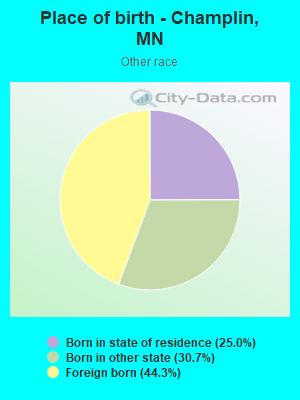
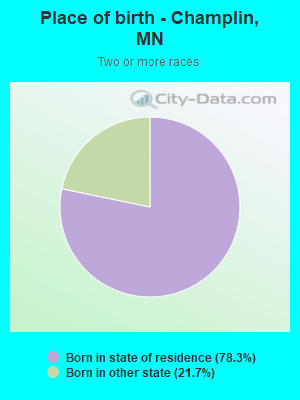
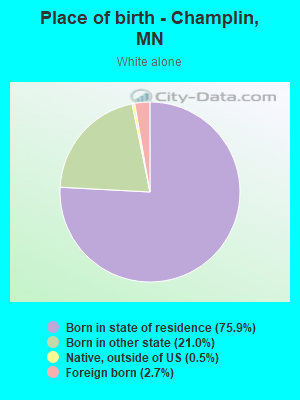
Place of birth - Born in state of residence (%)
Place of birth - Born in state of residence (%) - White
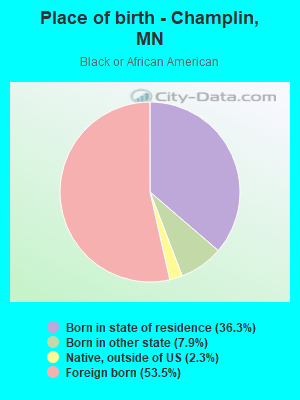
Place of birth - Born in state of residence (%) - Black or African American
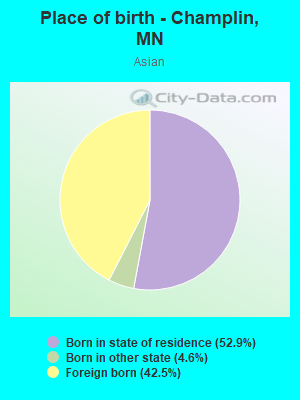
Place of birth - Born in state of residence (%) - Asian
Place of birth - Born in state of residence (%) - Hispanic or Latino
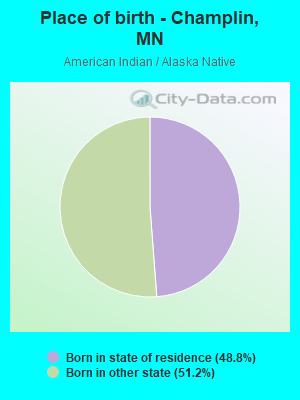
Place of birth - Born in state of residence (%) - American Indian and Alaska Native
Place of birth - Born in state of residence (%) - Multirace
Place of birth - Born in state of residence (%) - Other Race
Place of birth - Born in other state (%)
Place of birth - Born in other state (%) - White
Place of birth - Born in other state (%) - Black or African American
Place of birth - Born in other state (%) - Asian
Place of birth - Born in other state (%) - Hispanic or Latino
Place of birth - Born in other state (%) - American Indian and Alaska Native
Place of birth - Born in other state (%) - Multirace
Place of birth - Born in other state (%) - Other Race
Place of birth - Native, outside of US (%)
Place of birth - Native, outside of US (%) - White
Place of birth - Native, outside of US (%) - Black or African American
Place of birth - Native, outside of US (%) - Asian
Place of birth - Native, outside of US (%) - Hispanic or Latino
Place of birth - Native, outside of US (%) - American Indian and Alaska Native
Place of birth - Native, outside of US (%) - Multirace
Place of birth - Native, outside of US (%) - Other Race
Place of birth - Foreign born (%)
Place of birth - Foreign born (%) - White
Place of birth - Foreign born (%) - Black or African American
Place of birth - Foreign born (%) - Asian
Place of birth - Foreign born (%) - Hispanic or Latino
Place of birth - Foreign born (%) - American Indian and Alaska Native
Place of birth - Foreign born (%) - Multirace
Place of birth - Foreign born (%) - Other Race
Residents speaking English at home (%)
Residents speaking English at home - Born in the United States (%)
Residents speaking English at home - Native, born elsewhere (%)
Residents speaking English at home - Foreign born (%)
Residents speaking Spanish at home (%)
Residents speaking Spanish at home - Born in the United States (%)
Residents speaking Spanish at home - Native, born elsewhere (%)
Residents speaking Spanish at home - Foreign born (%)
Residents speaking other language at home (%)
Residents speaking other language at home - Born in the United States (%)
Residents speaking other language at home - Native, born elsewhere (%)
Residents speaking other language at home - Foreign born (%)
Marital status - Never married (%)
Marital status - Now married (%)
Marital status - Separated (%)
Marital status - Widowed (%)
Marital status - Divorced (%)
Ancestries Reported - Arab (%)
Ancestries Reported - Czech (%)
Ancestries Reported - Danish (%)
Ancestries Reported - Dutch (%)
Ancestries Reported - English (%)
Ancestries Reported - French (%)
Ancestries Reported - French Canadian (%)
Ancestries Reported - German (%)
Ancestries Reported - Greek (%)
Ancestries Reported - Hungarian (%)
Ancestries Reported - Irish (%)
Ancestries Reported - Italian (%)
Ancestries Reported - Lithuanian (%)
Ancestries Reported - Norwegian (%)
Ancestries Reported - Polish (%)
Ancestries Reported - Portuguese (%)
Ancestries Reported - Russian (%)
Ancestries Reported - Scotch-Irish (%)
Ancestries Reported - Scottish (%)
Ancestries Reported - Slovak (%)
Ancestries Reported - Subsaharan African (%)
Ancestries Reported - Swedish (%)
Ancestries Reported - Swiss (%)
Ancestries Reported - Ukrainian (%)
Ancestries Reported - United States (%)
Ancestries Reported - Welsh (%)
Ancestries Reported - West Indian (%)
Ancestries Reported - Other (%)
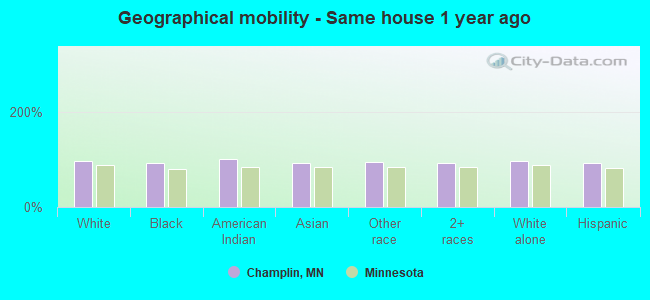
Geographical mobility - Same house 1 year ago (%)
Geographical mobility - Same house 1 year ago (%) - White
Geographical mobility - Same house 1 year ago (%) - Black or African American
Geographical mobility - Same house 1 year ago (%) - Asian
Geographical mobility - Same house 1 year ago (%) - Hispanic or Latino
Geographical mobility - Same house 1 year ago (%) - American Indian and Alaska Native
Geographical mobility - Same house 1 year ago (%) - Multirace
Geographical mobility - Same house 1 year ago (%) - Other Race
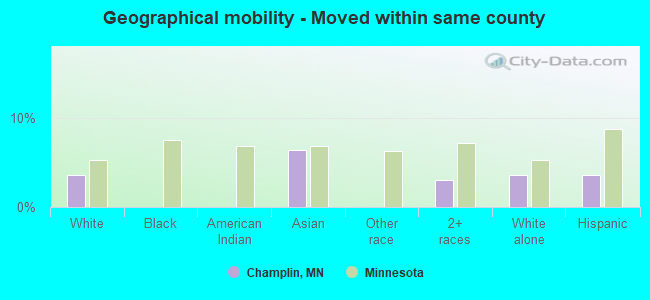
Geographical mobility - Moved within same county (%)
Geographical mobility - Moved within same county (%) - White
Geographical mobility - Moved within same county (%) - Black or African American
Geographical mobility - Moved within same county (%) - Asian
Geographical mobility - Moved within same county (%) - Hispanic or Latino
Geographical mobility - Moved within same county (%) - American Indian and Alaska Native
Geographical mobility - Moved within same county (%) - Multirace
Geographical mobility - Moved within same county (%) - Other Race
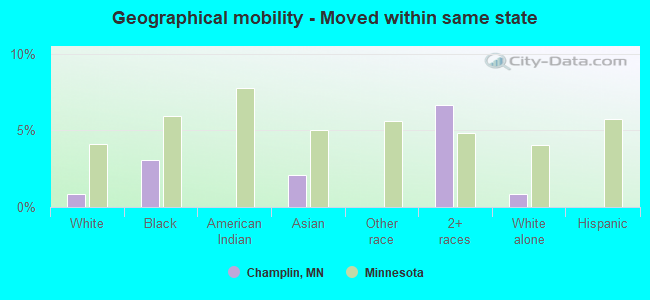
Geographical mobility - Moved from different county within same state (%)
Geographical mobility - Moved from different county within same state (%) - White
Geographical mobility - Moved from different county within same state (%) - Black or African American
Geographical mobility - Moved from different county within same state (%) - Asian
Geographical mobility - Moved from different county within same state (%) - Hispanic or Latino
Geographical mobility - Moved from different county within same state (%) - American Indian and Alaska Native
Geographical mobility - Moved from different county within same state (%) - Multirace
Geographical mobility - Moved from different county within same state (%) - Other Race
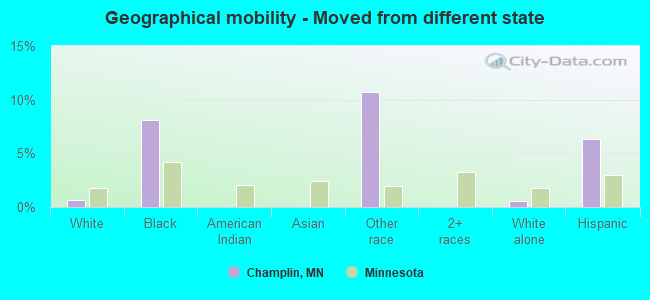
Geographical mobility - Moved from different state (%)
Geographical mobility - Moved from different state (%) - White
Geographical mobility - Moved from different state (%) - Black or African American
Geographical mobility - Moved from different state (%) - Asian
Geographical mobility - Moved from different state (%) - Hispanic or Latino
Geographical mobility - Moved from different state (%) - American Indian and Alaska Native
Geographical mobility - Moved from different state (%) - Multirace
Geographical mobility - Moved from different state (%) - Other Race
Geographical mobility - Moved from abroad (%)
Geographical mobility - Moved from abroad (%) - White
Geographical mobility - Moved from abroad (%) - Black or African American
Geographical mobility - Moved from abroad (%) - Asian
Geographical mobility - Moved from abroad (%) - Hispanic or Latino
Geographical mobility - Moved from abroad (%) - American Indian and Alaska Native
Geographical mobility - Moved from abroad (%) - Multirace
Geographical mobility - Moved from abroad (%) - Other Race
Place of birth for the foreign-born population - Ireland (%)
Place of birth for the foreign-born population - Denmark (%)
Place of birth for the foreign-born population - Norway (%)
Place of birth for the foreign-born population - Sweden (%)
Place of birth for the foreign-born population - United Kingdom (%)
Place of birth for the foreign-born population - England (%)
Place of birth for the foreign-born population - Scotland (%)
Place of birth for the foreign-born population - Other Northern Europe (%)
Place of birth for the foreign-born population - Austria (%)
Place of birth for the foreign-born population - Belgium (%)
Place of birth for the foreign-born population - France (%)
Place of birth for the foreign-born population - Germany (%)
Place of birth for the foreign-born population - Netherlands (%)
Place of birth for the foreign-born population - Switzerland (%)
Place of birth for the foreign-born population - Other Western Europe (%)
Place of birth for the foreign-born population - Greece (%)
Place of birth for the foreign-born population - Italy (%)
Place of birth for the foreign-born population - Portugal (%)
Place of birth for the foreign-born population - Spain (%)
Place of birth for the foreign-born population - Other Southern Europe (%)
Place of birth for the foreign-born population - Albania (%)
Place of birth for the foreign-born population - Belarus (%)
Place of birth for the foreign-born population - Bosnia and Herzegovina (%)
Place of birth for the foreign-born population - Bulgaria (%)
Place of birth for the foreign-born population - Croatia (%)
Place of birth for the foreign-born population - Czechoslovakia (%)
Place of birth for the foreign-born population - Hungary (%)
Place of birth for the foreign-born population - Latvia (%)
Place of birth for the foreign-born population - Lithuania (%)
Place of birth for the foreign-born population - North Macedonia (Macedonia) (%)
Place of birth for the foreign-born population - Moldova (%)
Place of birth for the foreign-born population - Poland (%)
Place of birth for the foreign-born population - Romania (%)
Place of birth for the foreign-born population - Russia (%)
Place of birth for the foreign-born population - Serbia (%)
Place of birth for the foreign-born population - Ukraine (%)
Place of birth for the foreign-born population - Other Eastern Europe (%)
Place of birth for the foreign-born population - China (%)
Place of birth for the foreign-born population - Hong Kong (%)
Place of birth for the foreign-born population - Taiwan (%)
Place of birth for the foreign-born population - Japan (%)
Place of birth for the foreign-born population - Korea (%)
Place of birth for the foreign-born population - Other Eastern Asia (%)
Place of birth for the foreign-born population - Afghanistan (%)
Place of birth for the foreign-born population - Bangladesh (%)
Place of birth for the foreign-born population - India (%)
Place of birth for the foreign-born population - Iran (%)
Place of birth for the foreign-born population - Kazakhstan (%)
Place of birth for the foreign-born population - Nepal (%)
Place of birth for the foreign-born population - Pakistan (%)
Place of birth for the foreign-born population - Sri Lanka (%)
Place of birth for the foreign-born population - Uzbekistan (%)
Place of birth for the foreign-born population - Other South Central Asia (%)
Place of birth for the foreign-born population - Burma (%)
Place of birth for the foreign-born population - Cambodia (%)
Place of birth for the foreign-born population - Indonesia (%)
Place of birth for the foreign-born population - Laos (%)
Place of birth for the foreign-born population - Malaysia (%)
Place of birth for the foreign-born population - Philippines (%)
Place of birth for the foreign-born population - Singapore (%)
Place of birth for the foreign-born population - Thailand (%)
Place of birth for the foreign-born population - Vietnam (%)
Place of birth for the foreign-born population - Other South Eastern Asia (%)
Place of birth for the foreign-born population - Armenia (%)
Place of birth for the foreign-born population - Iraq (%)
Place of birth for the foreign-born population - Israel (%)
Place of birth for the foreign-born population - Jordan (%)
Place of birth for the foreign-born population - Kuwait (%)
Place of birth for the foreign-born population - Lebanon (%)
Place of birth for the foreign-born population - Saudi Arabia (%)
Place of birth for the foreign-born population - Syria (%)
Place of birth for the foreign-born population - Turkey (%)
Place of birth for the foreign-born population - Yemen (%)
Place of birth for the foreign-born population - Other Western Asia (%)
Place of birth for the foreign-born population - Eritrea (%)
Place of birth for the foreign-born population - Ethiopia (%)
Place of birth for the foreign-born population - Kenya (%)
Place of birth for the foreign-born population - Somalia (%)
Place of birth for the foreign-born population - Uganda (%)
Place of birth for the foreign-born population - Zimbabwe (%)
Place of birth for the foreign-born population - Other Eastern Africa (%)
Place of birth for the foreign-born population - Cameroon (%)
Place of birth for the foreign-born population - Congo (%)
Place of birth for the foreign-born population - Democratic Republic of Congo (Zaire) (%)
Place of birth for the foreign-born population - Other Middle Africa (%)
Place of birth for the foreign-born population - Egypt (%)
Place of birth for the foreign-born population - Morocco (%)
Place of birth for the foreign-born population - Sudan (%)
Place of birth for the foreign-born population - Other Northern Africa (%)
Place of birth for the foreign-born population - South Africa (%)
Place of birth for the foreign-born population - Other Southern Africa (%)
Place of birth for the foreign-born population - Cabo Verde (%)
Place of birth for the foreign-born population - Ghana (%)
Place of birth for the foreign-born population - Liberia (%)
Place of birth for the foreign-born population - Nigeria (%)
Place of birth for the foreign-born population - Senegal (%)
Place of birth for the foreign-born population - Sierra Leone (%)
Place of birth for the foreign-born population - Other Western Africa (%)
Place of birth for the foreign-born population - Australia (%)
Place of birth for the foreign-born population - New Zealand (%)
Place of birth for the foreign-born population - Fiji (%)
Place of birth for the foreign-born population - Micronesia (%)
Place of birth for the foreign-born population - Bahamas (%)
Place of birth for the foreign-born population - Barbados (%)
Place of birth for the foreign-born population - Cuba (%)
Place of birth for the foreign-born population - Dominica (%)
Place of birth for the foreign-born population - Dominican Republic (%)
Place of birth for the foreign-born population - Grenada (%)
Place of birth for the foreign-born population - Haiti (%)
Place of birth for the foreign-born population - Jamaica (%)
Place of birth for the foreign-born population - St. Vincent and the Grenadines (%)
Place of birth for the foreign-born population - Trinidad and Tobago (%)
Place of birth for the foreign-born population - West Indies (%)
Place of birth for the foreign-born population - Other Caribbean (%)
Place of birth for the foreign-born population - Belize (%)
Place of birth for the foreign-born population - Costa Rica (%)
Place of birth for the foreign-born population - El Salvador (%)
Place of birth for the foreign-born population - Guatemala (%)
Place of birth for the foreign-born population - Honduras (%)
Place of birth for the foreign-born population - Mexico (%)
Place of birth for the foreign-born population - Nicaragua (%)
Place of birth for the foreign-born population - Panama (%)
Place of birth for the foreign-born population - Other Central America (%)
Place of birth for the foreign-born population - Argentina (%)
Place of birth for the foreign-born population - Bolivia (%)
Place of birth for the foreign-born population - Brazil (%)
Place of birth for the foreign-born population - Chile (%)
Place of birth for the foreign-born population - Colombia (%)
Place of birth for the foreign-born population - Ecuador (%)
Place of birth for the foreign-born population - Guyana (%)
Place of birth for the foreign-born population - Peru (%)
Place of birth for the foreign-born population - Uruguay (%)
Place of birth for the foreign-born population - Venezuela (%)
Place of birth for the foreign-born population - Other South America (%)
Place of birth for the foreign-born population - Canada (%)
Place of birth for the foreign-born population - Other Northern America (%)
Place of birth for the foreign-born population - Other (%)
Latest news about races in Champlin, MN collected exclusively by city-data.com from local newspapers, TV, and radio stations
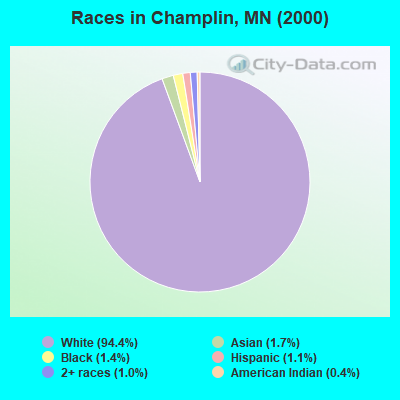
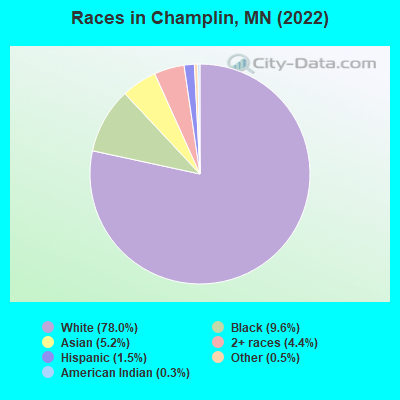
According to 2022 data, the most numerous races in Champlin, MN are White alone (18,305 residents), Black alone (2,253 residents), and Hispanic (351 residents). 88.0% of Champlin residents speak English at home. 10.5% of Champlin, MN residents are foreign-born (4.8% born in Africa, 2.6% born in Asia, 1.6% born in Europe), which is 23.6% greater than the foreign-born rate of 8.0% across the entire state of Minnesota.
Race distribution in Champlin
2000 2022
4,337,143 88.2% White alone 168,813 3.4% Black alone 143,382 2.9% Hispanic 141,083 2.9% Asian alone 70,304 1.4% Two or more races 52,009 1.1% American Indian alone 5,031 0.1% Other race alone 1,714 0.03% Native Hawaiian and Other
4,356,347 76.2% White alone 395,179 6.9% Black alone 333,830 5.8% Hispanic 294,800 5.2% Asian alone 259,649 4.5% Two or more races 42,125 0.7% American Indian alone 32,976 0.6% Other race alone 2,278 0.04% Native Hawaiian and Other
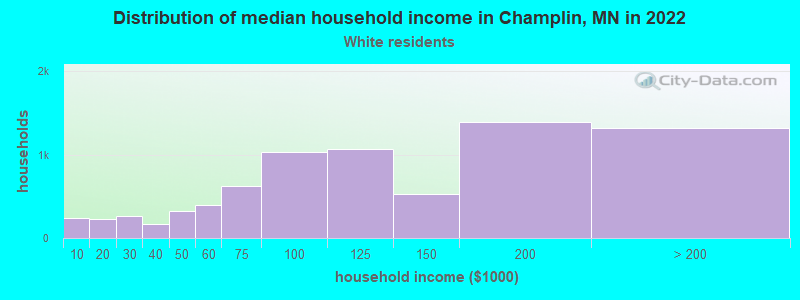
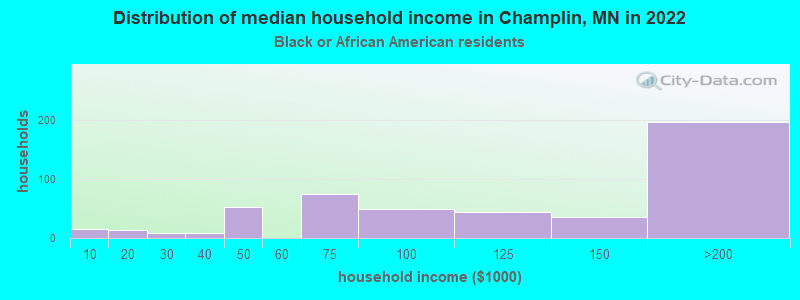
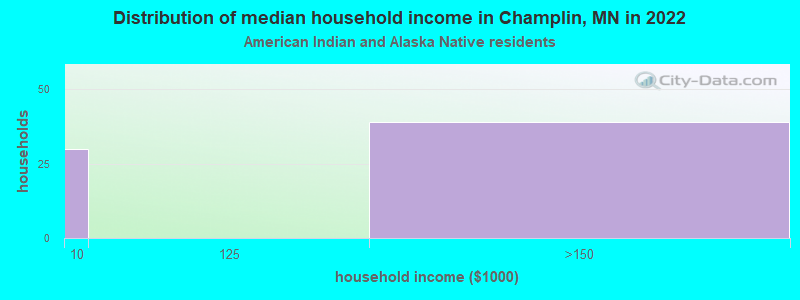
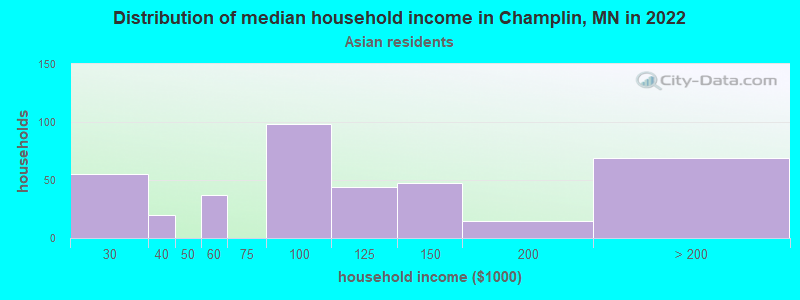
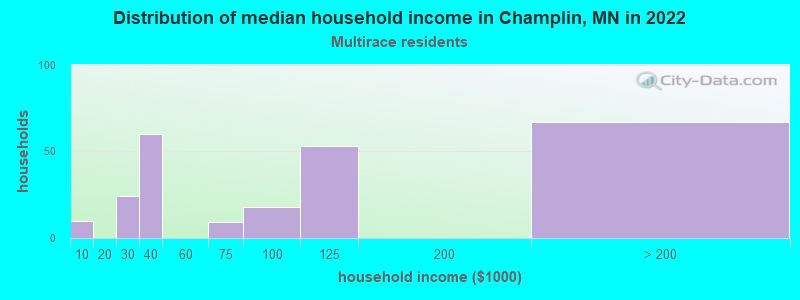
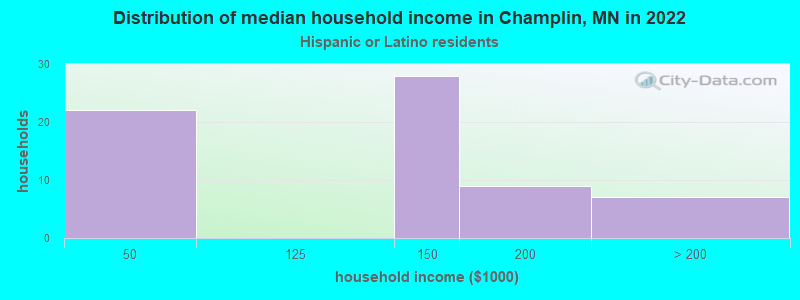
Income and house value in Champlin Median household income in 2022 $111,657 White non-Hispanic householders$104,239 Black householders$94,245 Asian householders$100,901 Two or more races householders$138,095 Hispanic or Latino race householdersMedian 2022 house value $338,652 White Non-Hispanic householders$361,999 Black or African American householders$251,408 American Indian or Alaska Native householders $316,534 Asian householders$337,915 Some other race householders$159,741 Two or more races householders$340,372 Hispanic or Latino householders
Median age by race in Champlin
48.3 Median age for White residents47.1 49.9 23.5 Median age for Black or African American residents23.2 25.2 31.8 Median age for American Indian / Alaska Native residents-619,552,414.0 -643,749,999.4 32.8 Median age for Asian residents33.1 21.7 -790,303,029.5 Median age for Native Hawaiian / Pacific Islander residents-856,799,036.4 -365,948,037.2 44.7 Median age for Other race residents46.6 46.6 15.9 Median age for Two or more races residents14.7 17.5 48.0 Median age for White alone residents46.9 49.4 18.6 Median age for Hispanic or Latino residents39.1 18.3
Owner/renter occupied households by race in Champlin
House owners and renters - White residents 6,851 90.5% Owner occupied717 9.5% Renter occupiedHouse owners and renters - Black or African American residents 314 68.6% Owner occupied144 31.4% Renter occupiedHouse owners and renters - American Indian / Alaska Native residents 80 100.0% Owner occupiedHouse owners and renters - Asian residents 354 96.0% Owner occupied15 4.0% Renter occupiedHouse owners and renters - Other race residents 9 100.0% Owner occupiedHouse owners and renters - Two or more races residents 201 86.2% Owner occupied32 13.8% Renter occupiedHouse owners and renters - White alone residents 6,871 90.6% Owner occupied714 9.4% Renter occupiedHouse owners and renters - Hispanic or Latino residents 39 73.3% Owner occupied14 26.7% Renter occupied
Language usage in Champlin
English speakers - Total 88.0% of residents of Champlin speak English at home.
1.1% of residents speak Spanish at home 138 54.8% Speak English very well114 45.2% Speak English less than very well11.0% of residents speak other language at home 1,489 60.2% Speak English very well983 39.8% Speak English less than very well
English speakers - Born in the United States 94.6% of residents of Champlin speak English at home.
0.1% of residents speak Spanish at home 6 100.0% Speak English very well5.1% of residents speak other language at home 231 100.0% Speak English very well
English speakers - Native, born elsewhere 51.5% of residents of Champlin speak English at home.
40.7% of residents speak other language at home 68 100.0% Speak English very well
English speakers - Foreign-born 24.2% of residents of Champlin speak English at home.
2.9% of residents speak Spanish at home 33 49.3% Speak English very well34 50.7% Speak English less than very well74.0% of residents speak other language at home 934 54.7% Speak English very well773 45.3% Speak English less than very well
White (Caucasian) - Speak only English Native:
98.2% (16,845)Foreign-born:
32.3% (141)
White (Caucasian) - Speak another language Native:
1.9% (333)Foreign-born:
64.3% (281)
Black or African American - Speak only English Native:
67.1% (568)Foreign-born:
16.8% (198)
Black or African American - Speak another language Native:
39.5% (334)Foreign-born:
84.5% (995)
Asian - Speak only English Native:
62.3% (382)Foreign-born:
30.5% (157)
Asian - Speak another language Native:
41.1% (252)Foreign-born:
70.0% (360)
Other race - Speak only English Native:
100.0% (129)Foreign-born:
35.0% (35)
Other race - Speak another language Native:
7.8% (10)Foreign-born:
63.6% (63)
White alone - Speak only English Native:
97.9% (16,850)Foreign-born:
28.0% (139)
White alone - Speak another language Native:
2.1% (360)Foreign-born:
68.2% (338)
Hispanic or Latino - Speak only English Native:
100.0% (253)Foreign-born:
28.4% (25)
Hispanic or Latino - Speak another language Native:
3.7% (9)Foreign-born:
76.2% (68)
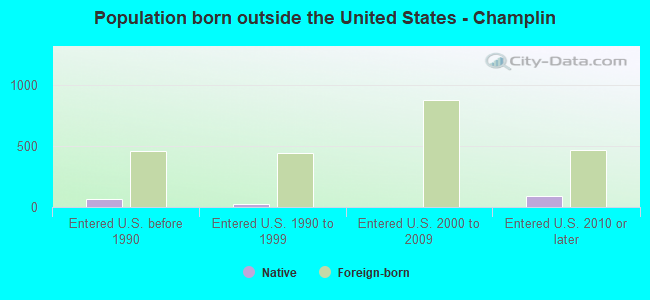
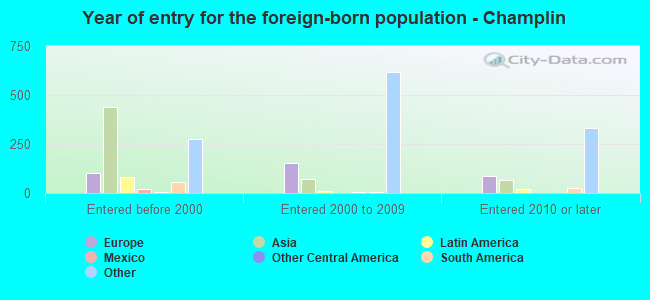
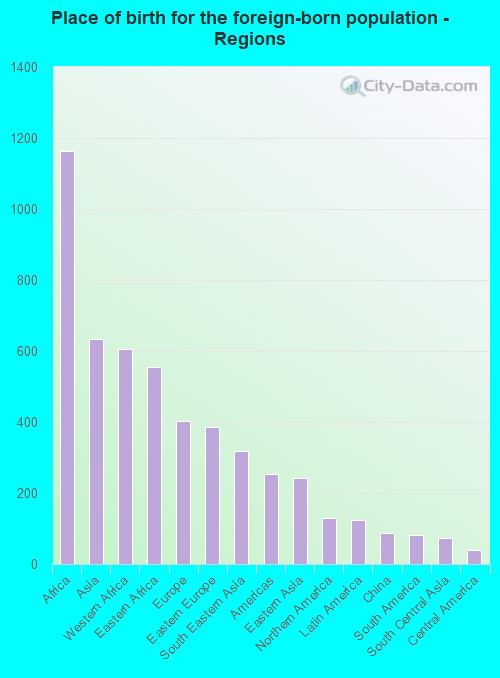
Foreign-born residents in Champlin 2,456 residents are foreign born (4.8% Africa , 2.6% Asia , 1.6% Europe ).
This city:
10.5%Minnesota:
8.5%
Marital status for residents in Champlin Marital status - White (Caucasian) population 15 years and over
Males 21.5% Never married62.7% Now married0.6% Separated1.0% Widowed14.2% DivorcedFemales 22.8% Never married60.9% Now married0.3% Separated6.3% Widowed9.7% DivorcedWomen who gave birth in the past 12 months Now married:
86.2% (119)Unmarried:
13.8% (19)
Women who did not give birth in the past 12 months Now married:
51.5% (1,662)Unmarried:
48.5% (1,566)
Marital status - Black or African American population 15 years and over
Males 50.4% Never married39.1% Now married0.0% Separated0.0% Widowed10.5% DivorcedFemales 47.0% Never married31.1% Now married0.0% Separated0.8% Widowed21.1% DivorcedWomen who gave birth in the past 12 months Now married:
77.2% (76)Unmarried:
22.8% (23)
Women who did not give birth in the past 12 months Now married:
25.5% (162)Unmarried:
74.5% (473)
Marital status - American Indian / Alaska Native population 15 years and over
Males 86.0% Never married14.0% Now married0.0% Separated0.0% Widowed0.0% DivorcedFemales 26.1% Never married73.9% Now married0.0% Separated0.0% Widowed0.0% DivorcedWomen who did not give birth in the past 12 months Now married:
73.9% (36)Unmarried:
26.1% (13)
Marital status - Asian population 15 years and over
Males 50.4% Never married43.1% Now married3.6% Separated0.0% Widowed2.9% DivorcedFemales 36.0% Never married61.5% Now married0.0% Separated0.0% Widowed2.5% DivorcedWomen who gave birth in the past 12 months Now married:
0.0% (0)Unmarried:
100.0% (57)
Women who did not give birth in the past 12 months Now married:
62.1% (164)Unmarried:
37.9% (100)
Marital status - Other race population 15 years and over
Males 0.0% Never married100.0% Now married0.0% Separated0.0% Widowed0.0% DivorcedFemales 39.3% Never married47.3% Now married0.0% Separated0.0% Widowed13.4% DivorcedWomen who did not give birth in the past 12 months Now married:
44.3% (36)Unmarried:
55.7% (45)
Marital status - Two or more races population 15 years and over
Males 54.2% Never married37.2% Now married4.9% Separated0.0% Widowed3.8% DivorcedFemales 37.5% Never married27.0% Now married0.0% Separated0.0% Widowed35.6% DivorcedWomen who did not give birth in the past 12 months Now married:
17.0% (54)Unmarried:
83.0% (262)
Marital status - White alone, not Hispanic / Latino population 15 years and over
Males 21.5% Never married62.6% Now married0.6% Separated1.0% Widowed14.3% DivorcedFemales 22.6% Never married61.1% Now married0.3% Separated6.4% Widowed9.7% DivorcedWomen who gave birth in the past 12 months Now married:
86.2% (121)Unmarried:
13.8% (19)
Women who did not give birth in the past 12 months Now married:
52.0% (1,684)Unmarried:
48.0% (1,553)
Marital status - Hispanic or Latino population 15 years and over
Males 34.7% Never married65.3% Now married0.0% Separated0.0% Widowed0.0% DivorcedFemales 37.1% Never married44.4% Now married0.0% Separated0.0% Widowed18.5% DivorcedWomen who did not give birth in the past 12 months Now married:
23.9% (18)Unmarried:
76.1% (56)
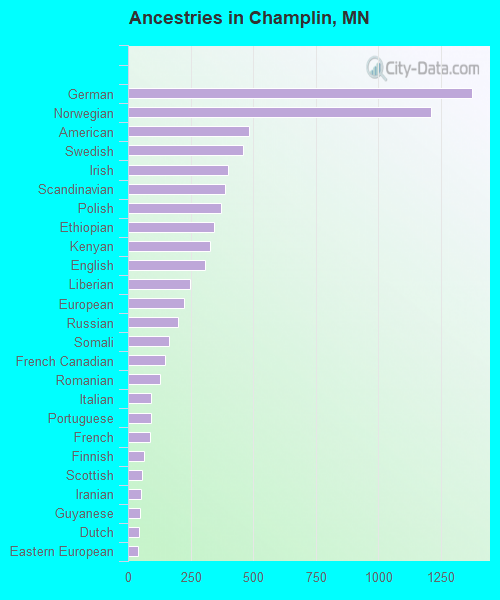
Ancestries in Champlin
1,375 14.1% German1,211 12.4% Norwegian484 5.0% American460 4.7% Swedish400 4.1% Irish388 4.0% Scandinavian372 3.8% Polish343 3.5% Ethiopian327 3.4% Kenyan308 3.2% English247 2.5% Liberian222 2.3% European198 2.0% Russian164 1.7% Somali148 1.5% French Canadian127 1.3% Romanian91 0.9% Italian90 0.9% Portuguese86 0.9% French62 0.6% Finnish54 0.6% Scottish52 0.5% Iranian48 0.5% Guyanese44 0.5% Dutch38 0.4% Eastern European30 0.3% Scotch-Irish24 0.2% Greek24 0.2% Armenian23 0.2% Sudanese23 0.2% Ukrainian22 0.2% Danish21 0.2% African18 0.2% Slovak10 0.1% Czech10 0.1% Croatian8 0.08% Czechoslovakian8 0.08% Slovene8 0.08% Austrian7 0.07% Lebanese5 0.05% Syrian5 0.05% Hungarian
Children Nativity (place of birth) in Champlin
Children under 6 years - Living with two parents Both parents native 697 100.0% NativeBoth parents foreign-born 275 100.0% NativeOne native, one foreign-born parent 49 100.0% NativeChildren under 6 years - Living with one parent Native parent 232 100.0% NativeForeign-born parent 41 100.0% NativeChildren 6 to 17 years - Living with two parents Both parents native 1,702 97.3% Native47 2.7% Foreign-bornBoth parents foreign-born 367 100.0% NativeOne native, one foreign-born parent 180 100.0% NativeChildren 6 to 17 years - Living with one parent Native parent 1,191 100.0% NativeForeign-born parent 198 53.1% Native175 46.9% Foreign-born
Grandparents responsible for own grandchildren in Champlin
Grandparents (30 to 59 years) White / Caucasian 16 32.2% Responsible for grandchildren34 67.8% Not responsible for grandchildrenWhite alone, not Hispanic / Latino 11 22.2% Responsible for grandchildren38 77.8% Not responsible for grandchildrenGrandparents (60 years and over) White / Caucasian 50 30.0% Responsible for grandchildren118 70.0% Not responsible for grandchildrenWhite alone, not Hispanic / Latino 52 29.4% Responsible for grandchildren124 70.6% Not responsible for grandchildren