Races in Chico, California (CA) Detailed Stats
Data:
Races - White alone (%)
Races - White alone (% change since 2000)
Races - Black alone (%)
Races - Black alone (% change since 2000)
Races - American Indian alone (%)
Races - American Indian alone (% change since 2000)
Races - Asian alone (%)
Races - Asian alone (% change since 2000)
Races - Hispanic (%)
Races - Hispanic (% change since 2000)
Races - Native Hawaiian and Other Pacific Islander alone (%)
Races - Native Hawaiian and Other Pacific Islander alone (% change since 2000)
Races - Two or more races(%)
Races - Two or more races(% change since 2000)
Races - Other race alone (%)
Races - Other race alone (% change since 2000)
Racial diversity
Place of birth - Born in state of residence (%)
Place of birth - Born in state of residence (%) - White
Place of birth - Born in state of residence (%) - Black or African American
Place of birth - Born in state of residence (%) - Asian
Place of birth - Born in state of residence (%) - Hispanic or Latino
Place of birth - Born in state of residence (%) - American Indian and Alaska Native
Place of birth - Born in state of residence (%) - Multirace
Place of birth - Born in state of residence (%) - Other Race
Place of birth - Born in other state (%)
Place of birth - Born in other state (%) - White
Place of birth - Born in other state (%) - Black or African American
Place of birth - Born in other state (%) - Asian
Place of birth - Born in other state (%) - Hispanic or Latino
Place of birth - Born in other state (%) - American Indian and Alaska Native
Place of birth - Born in other state (%) - Multirace
Place of birth - Born in other state (%) - Other Race
Place of birth - Native, outside of US (%)
Place of birth - Native, outside of US (%) - White
Place of birth - Native, outside of US (%) - Black or African American
Place of birth - Native, outside of US (%) - Asian
Place of birth - Native, outside of US (%) - Hispanic or Latino
Place of birth - Native, outside of US (%) - American Indian and Alaska Native
Place of birth - Native, outside of US (%) - Multirace
Place of birth - Native, outside of US (%) - Other Race
Place of birth - Foreign born (%)
Place of birth - Foreign born (%) - White
Place of birth - Foreign born (%) - Black or African American
Place of birth - Foreign born (%) - Asian
Place of birth - Foreign born (%) - Hispanic or Latino
Place of birth - Foreign born (%) - American Indian and Alaska Native
Place of birth - Foreign born (%) - Multirace
Place of birth - Foreign born (%) - Other Race
Residents speaking English at home (%)
Residents speaking English at home - Born in the United States (%)
Residents speaking English at home - Native, born elsewhere (%)
Residents speaking English at home - Foreign born (%)
Residents speaking Spanish at home (%)
Residents speaking Spanish at home - Born in the United States (%)
Residents speaking Spanish at home - Native, born elsewhere (%)
Residents speaking Spanish at home - Foreign born (%)
Residents speaking other language at home (%)
Residents speaking other language at home - Born in the United States (%)
Residents speaking other language at home - Native, born elsewhere (%)
Residents speaking other language at home - Foreign born (%)
Marital status - Never married (%)
Marital status - Now married (%)
Marital status - Separated (%)
Marital status - Widowed (%)
Marital status - Divorced (%)
Ancestries Reported - Arab (%)
Ancestries Reported - Czech (%)
Ancestries Reported - Danish (%)
Ancestries Reported - Dutch (%)
Ancestries Reported - English (%)
Ancestries Reported - French (%)
Ancestries Reported - French Canadian (%)
Ancestries Reported - German (%)
Ancestries Reported - Greek (%)
Ancestries Reported - Hungarian (%)
Ancestries Reported - Irish (%)
Ancestries Reported - Italian (%)
Ancestries Reported - Lithuanian (%)
Ancestries Reported - Norwegian (%)
Ancestries Reported - Polish (%)
Ancestries Reported - Portuguese (%)
Ancestries Reported - Russian (%)
Ancestries Reported - Scotch-Irish (%)
Ancestries Reported - Scottish (%)
Ancestries Reported - Slovak (%)
Ancestries Reported - Subsaharan African (%)
Ancestries Reported - Swedish (%)
Ancestries Reported - Swiss (%)
Ancestries Reported - Ukrainian (%)
Ancestries Reported - United States (%)
Ancestries Reported - Welsh (%)
Ancestries Reported - West Indian (%)
Ancestries Reported - Other (%)
Geographical mobility - Same house 1 year ago (%)
Geographical mobility - Same house 1 year ago (%) - White
Geographical mobility - Same house 1 year ago (%) - Black or African American
Geographical mobility - Same house 1 year ago (%) - Asian
Geographical mobility - Same house 1 year ago (%) - Hispanic or Latino
Geographical mobility - Same house 1 year ago (%) - American Indian and Alaska Native
Geographical mobility - Same house 1 year ago (%) - Multirace
Geographical mobility - Same house 1 year ago (%) - Other Race
Geographical mobility - Moved within same county (%)
Geographical mobility - Moved within same county (%) - White
Geographical mobility - Moved within same county (%) - Black or African American
Geographical mobility - Moved within same county (%) - Asian
Geographical mobility - Moved within same county (%) - Hispanic or Latino
Geographical mobility - Moved within same county (%) - American Indian and Alaska Native
Geographical mobility - Moved within same county (%) - Multirace
Geographical mobility - Moved within same county (%) - Other Race
Geographical mobility - Moved from different county within same state (%)
Geographical mobility - Moved from different county within same state (%) - White
Geographical mobility - Moved from different county within same state (%) - Black or African American
Geographical mobility - Moved from different county within same state (%) - Asian
Geographical mobility - Moved from different county within same state (%) - Hispanic or Latino
Geographical mobility - Moved from different county within same state (%) - American Indian and Alaska Native
Geographical mobility - Moved from different county within same state (%) - Multirace
Geographical mobility - Moved from different county within same state (%) - Other Race
Geographical mobility - Moved from different state (%)
Geographical mobility - Moved from different state (%) - White
Geographical mobility - Moved from different state (%) - Black or African American
Geographical mobility - Moved from different state (%) - Asian
Geographical mobility - Moved from different state (%) - Hispanic or Latino
Geographical mobility - Moved from different state (%) - American Indian and Alaska Native
Geographical mobility - Moved from different state (%) - Multirace
Geographical mobility - Moved from different state (%) - Other Race
Geographical mobility - Moved from abroad (%)
Geographical mobility - Moved from abroad (%) - White
Geographical mobility - Moved from abroad (%) - Black or African American
Geographical mobility - Moved from abroad (%) - Asian
Geographical mobility - Moved from abroad (%) - Hispanic or Latino
Geographical mobility - Moved from abroad (%) - American Indian and Alaska Native
Geographical mobility - Moved from abroad (%) - Multirace
Geographical mobility - Moved from abroad (%) - Other Race
Place of birth for the foreign-born population - Ireland (%)
Place of birth for the foreign-born population - Denmark (%)
Place of birth for the foreign-born population - Norway (%)
Place of birth for the foreign-born population - Sweden (%)
Place of birth for the foreign-born population - United Kingdom (%)
Place of birth for the foreign-born population - England (%)
Place of birth for the foreign-born population - Scotland (%)
Place of birth for the foreign-born population - Other Northern Europe (%)
Place of birth for the foreign-born population - Austria (%)
Place of birth for the foreign-born population - Belgium (%)
Place of birth for the foreign-born population - France (%)
Place of birth for the foreign-born population - Germany (%)
Place of birth for the foreign-born population - Netherlands (%)
Place of birth for the foreign-born population - Switzerland (%)
Place of birth for the foreign-born population - Other Western Europe (%)
Place of birth for the foreign-born population - Greece (%)
Place of birth for the foreign-born population - Italy (%)
Place of birth for the foreign-born population - Portugal (%)
Place of birth for the foreign-born population - Spain (%)
Place of birth for the foreign-born population - Other Southern Europe (%)
Place of birth for the foreign-born population - Albania (%)
Place of birth for the foreign-born population - Belarus (%)
Place of birth for the foreign-born population - Bosnia and Herzegovina (%)
Place of birth for the foreign-born population - Bulgaria (%)
Place of birth for the foreign-born population - Croatia (%)
Place of birth for the foreign-born population - Czechoslovakia (%)
Place of birth for the foreign-born population - Hungary (%)
Place of birth for the foreign-born population - Latvia (%)
Place of birth for the foreign-born population - Lithuania (%)
Place of birth for the foreign-born population - North Macedonia (Macedonia) (%)
Place of birth for the foreign-born population - Moldova (%)
Place of birth for the foreign-born population - Poland (%)
Place of birth for the foreign-born population - Romania (%)
Place of birth for the foreign-born population - Russia (%)
Place of birth for the foreign-born population - Serbia (%)
Place of birth for the foreign-born population - Ukraine (%)
Place of birth for the foreign-born population - Other Eastern Europe (%)
Place of birth for the foreign-born population - China (%)
Place of birth for the foreign-born population - Hong Kong (%)
Place of birth for the foreign-born population - Taiwan (%)
Place of birth for the foreign-born population - Japan (%)
Place of birth for the foreign-born population - Korea (%)
Place of birth for the foreign-born population - Other Eastern Asia (%)
Place of birth for the foreign-born population - Afghanistan (%)
Place of birth for the foreign-born population - Bangladesh (%)
Place of birth for the foreign-born population - India (%)
Place of birth for the foreign-born population - Iran (%)
Place of birth for the foreign-born population - Kazakhstan (%)
Place of birth for the foreign-born population - Nepal (%)
Place of birth for the foreign-born population - Pakistan (%)
Place of birth for the foreign-born population - Sri Lanka (%)
Place of birth for the foreign-born population - Uzbekistan (%)
Place of birth for the foreign-born population - Other South Central Asia (%)
Place of birth for the foreign-born population - Burma (%)
Place of birth for the foreign-born population - Cambodia (%)
Place of birth for the foreign-born population - Indonesia (%)
Place of birth for the foreign-born population - Laos (%)
Place of birth for the foreign-born population - Malaysia (%)
Place of birth for the foreign-born population - Philippines (%)
Place of birth for the foreign-born population - Singapore (%)
Place of birth for the foreign-born population - Thailand (%)
Place of birth for the foreign-born population - Vietnam (%)
Place of birth for the foreign-born population - Other South Eastern Asia (%)
Place of birth for the foreign-born population - Armenia (%)
Place of birth for the foreign-born population - Iraq (%)
Place of birth for the foreign-born population - Israel (%)
Place of birth for the foreign-born population - Jordan (%)
Place of birth for the foreign-born population - Kuwait (%)
Place of birth for the foreign-born population - Lebanon (%)
Place of birth for the foreign-born population - Saudi Arabia (%)
Place of birth for the foreign-born population - Syria (%)
Place of birth for the foreign-born population - Turkey (%)
Place of birth for the foreign-born population - Yemen (%)
Place of birth for the foreign-born population - Other Western Asia (%)
Place of birth for the foreign-born population - Eritrea (%)
Place of birth for the foreign-born population - Ethiopia (%)
Place of birth for the foreign-born population - Kenya (%)
Place of birth for the foreign-born population - Somalia (%)
Place of birth for the foreign-born population - Uganda (%)
Place of birth for the foreign-born population - Zimbabwe (%)
Place of birth for the foreign-born population - Other Eastern Africa (%)
Place of birth for the foreign-born population - Cameroon (%)
Place of birth for the foreign-born population - Congo (%)
Place of birth for the foreign-born population - Democratic Republic of Congo (Zaire) (%)
Place of birth for the foreign-born population - Other Middle Africa (%)
Place of birth for the foreign-born population - Egypt (%)
Place of birth for the foreign-born population - Morocco (%)
Place of birth for the foreign-born population - Sudan (%)
Place of birth for the foreign-born population - Other Northern Africa (%)
Place of birth for the foreign-born population - South Africa (%)
Place of birth for the foreign-born population - Other Southern Africa (%)
Place of birth for the foreign-born population - Cabo Verde (%)
Place of birth for the foreign-born population - Ghana (%)
Place of birth for the foreign-born population - Liberia (%)
Place of birth for the foreign-born population - Nigeria (%)
Place of birth for the foreign-born population - Senegal (%)
Place of birth for the foreign-born population - Sierra Leone (%)
Place of birth for the foreign-born population - Other Western Africa (%)
Place of birth for the foreign-born population - Australia (%)
Place of birth for the foreign-born population - New Zealand (%)
Place of birth for the foreign-born population - Fiji (%)
Place of birth for the foreign-born population - Micronesia (%)
Place of birth for the foreign-born population - Bahamas (%)
Place of birth for the foreign-born population - Barbados (%)
Place of birth for the foreign-born population - Cuba (%)
Place of birth for the foreign-born population - Dominica (%)
Place of birth for the foreign-born population - Dominican Republic (%)
Place of birth for the foreign-born population - Grenada (%)
Place of birth for the foreign-born population - Haiti (%)
Place of birth for the foreign-born population - Jamaica (%)
Place of birth for the foreign-born population - St. Vincent and the Grenadines (%)
Place of birth for the foreign-born population - Trinidad and Tobago (%)
Place of birth for the foreign-born population - West Indies (%)
Place of birth for the foreign-born population - Other Caribbean (%)
Place of birth for the foreign-born population - Belize (%)
Place of birth for the foreign-born population - Costa Rica (%)
Place of birth for the foreign-born population - El Salvador (%)
Place of birth for the foreign-born population - Guatemala (%)
Place of birth for the foreign-born population - Honduras (%)
Place of birth for the foreign-born population - Mexico (%)
Place of birth for the foreign-born population - Nicaragua (%)
Place of birth for the foreign-born population - Panama (%)
Place of birth for the foreign-born population - Other Central America (%)
Place of birth for the foreign-born population - Argentina (%)
Place of birth for the foreign-born population - Bolivia (%)
Place of birth for the foreign-born population - Brazil (%)
Place of birth for the foreign-born population - Chile (%)
Place of birth for the foreign-born population - Colombia (%)
Place of birth for the foreign-born population - Ecuador (%)
Place of birth for the foreign-born population - Guyana (%)
Place of birth for the foreign-born population - Peru (%)
Place of birth for the foreign-born population - Uruguay (%)
Place of birth for the foreign-born population - Venezuela (%)
Place of birth for the foreign-born population - Other South America (%)
Place of birth for the foreign-born population - Canada (%)
Place of birth for the foreign-born population - Other Northern America (%)
Place of birth for the foreign-born population - Other (%)
Latest news about races in Chico, CA collected exclusively by city-data.com from local newspapers, TV, and radio stations
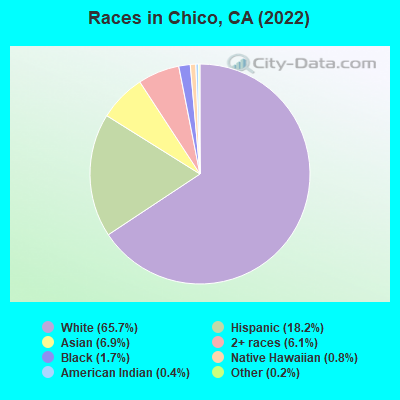
According to 2022 data, the most numerous races in Chico, CA are Hispanic (21,715 residents), White alone (68,340 residents), and Asian alone (3,688 residents). 84.2% of Chico residents speak English at home. 7.9% of Chico, CA residents are foreign-born (3.2% born in Latin America, 2.9% born in Asia, 0.9% born in Europe), which is 227.8% less than the foreign-born rate of 26.0% across the entire state of California.
Race distribution in Chico
2000 2022
46,258 77.2% White alone 7,351 12.3% Hispanic 2,488 4.1% Asian alone 1,783 3.0% Two or more races 1,174 2.0% Black alone 625 1.0% American Indian alone 166 0.3% Other race alone 109 0.2% Native Hawaiian and Other
68,340 66.0% White alone 21,715 21.0% Hispanic 4,096 4.0% Two or more races 3,688 3.6% Asian alone 2,404 2.3% Black alone 307 0.3% Native Hawaiian and Other 281 0.3% American Indian alone
2000 2022
15,816,790 46.7% White alone 10,966,556 32.4% Hispanic 3,648,860 10.8% Asian alone 2,181,926 6.4% Black alone 903,115 2.7% Two or more races 178,984 0.5% American Indian alone 103,736 0.3% Native Hawaiian and Other 71,681 0.2% Other race alone
15,732,184 40.3% Hispanic 13,160,426 33.7% White alone 5,957,867 15.3% Asian alone 2,025,218 5.2% Black alone 1,663,222 4.3% Two or more races 251,618 0.6% Other race alone 135,777 0.3% Native Hawaiian and Other 103,030 0.3% American Indian alone
Income and house value in Chico Median household income in 2022 $75,971 White non-Hispanic householders$36,005 Black householders$44,127 American Indian and Alaska Native householders$133,387 Asian householders$131,354 Native Hawaiian and other Pacific Islander householders$85,555 Some other race householders$88,051 Two or more races householders$74,259 Hispanic or Latino race householdersMedian 2022 house value $511,100 White Non-Hispanic householders$447,752 Black or African American householders$422,197 American Indian or Alaska Native householders $537,374 Asian householdersover $1,000,000 Native Hawaiian and other Pacific Islander householders$529,816 Some other race householders$486,984 Two or more races householders$492,023 Hispanic or Latino householders
Median age by race in Chico
34.3 Median age for White residents32.5 36.0 29.7 Median age for Black or African American residents33.4 25.9 30.0 Median age for American Indian / Alaska Native residents61.9 29.1 26.6 Median age for Asian residents25.0 28.9 20.0 Median age for Native Hawaiian / Pacific Islander residents50.5 17.9 28.9 Median age for Other race residents32.1 27.0 25.5 Median age for Two or more races residents23.3 30.8 35.7 Median age for White alone residents33.3 38.6 26.1 Median age for Hispanic or Latino residents28.4 24.6
Owner/renter occupied households by race in Chico
House owners and renters - White residents 13,686 48.7% Owner occupied14,406 51.3% Renter occupiedHouse owners and renters - Black or African American residents 201 21.0% Owner occupied755 79.0% Renter occupiedHouse owners and renters - American Indian / Alaska Native residents 31 10.5% Owner occupied261 89.5% Renter occupiedHouse owners and renters - Asian residents 645 63.9% Owner occupied364 36.1% Renter occupiedHouse owners and renters - Native Hawaiian / Pacific Islander residents 30 43.5% Owner occupied39 56.5% Renter occupiedHouse owners and renters - Other race residents 675 34.3% Owner occupied1,295 65.7% Renter occupiedHouse owners and renters - Two or more races residents 1,050 53.8% Owner occupied900 46.2% Renter occupiedHouse owners and renters - White alone residents 13,235 47.7% Owner occupied14,518 52.3% Renter occupiedHouse owners and renters - Hispanic or Latino residents 2,499 39.3% Owner occupied3,866 60.7% Renter occupied
Language usage in Chico
English speakers - Total 84.2% of residents of Chico speak English at home.
10.3% of residents speak Spanish at home 6,931 75.0% Speak English very well2,310 25.0% Speak English less than very well6.0% of residents speak other language at home 3,621 67.0% Speak English very well1,783 33.0% Speak English less than very well
English speakers - Born in the United States 93.4% of residents of Chico speak English at home.
3.6% of residents speak Spanish at home 516 87.5% Speak English very well74 12.5% Speak English less than very well2.8% of residents speak other language at home 408 87.9% Speak English very well56 12.1% Speak English less than very well
English speakers - Native, born elsewhere 74.2% of residents of Chico speak English at home.
21.5% of residents speak Spanish at home 153 90.5% Speak English very well16 9.5% Speak English less than very well5.0% of residents speak other language at home 35 89.7% Speak English very well4 10.3% Speak English less than very well
English speakers - Foreign-born 19.0% of residents of Chico speak English at home.
38.0% of residents speak Spanish at home 1,171 43.4% Speak English very well1,530 56.6% Speak English less than very well44.3% of residents speak other language at home 1,763 55.9% Speak English very well1,392 44.1% Speak English less than very well
White (Caucasian) - Speak only English Native:
96.9% (63,339)Foreign-born:
37.3% (697)
White (Caucasian) - Speak another language Native:
6.7% (4,349)Foreign-born:
68.5% (1,280)
Black or African American - Speak only English Native:
98.0% (1,663)Foreign-born:
19.2% (29)
Black or African American - Speak another language Native:
1.6% (28)Foreign-born:
82.6% (127)
American Indian / Alaska Native - Speak only English Native:
63.3% (452)Foreign-born:
77.0% (23)
American Indian / Alaska Native - Speak another language Native:
35.2% (251)Foreign-born:
14.4% (4)
Asian - Speak only English Native:
64.2% (1,810)Foreign-born:
12.6% (164)
Asian - Speak another language Native:
36.2% (1,021)Foreign-born:
87.6% (1,143)
Native Hawaiian / Pacific Islander - Speak only English Native:
89.3% (258)Foreign-born:
35.8% (24)
Native Hawaiian / Pacific Islander - Speak another language Native:
14.8% (43)Foreign-born:
69.1% (46)
Other race - Speak another language Native:
46.5% (2,370)Foreign-born:
98.4% (2,488)
Two or more races - Speak only English Native:
66.0% (6,531)Foreign-born:
6.3% (143)
Two or more races - Speak another language Native:
30.1% (2,983)Foreign-born:
96.4% (2,199)
White alone - Speak only English Native:
97.2% (61,883)Foreign-born:
65.1% (730)
White alone - Speak another language Native:
2.7% (1,717)Foreign-born:
34.2% (384)
Hispanic or Latino - Speak only English Native:
54.9% (9,142)Foreign-born:
1.0% (39)
Hispanic or Latino - Speak another language Native:
46.1% (7,672)Foreign-born:
97.8% (3,847)
Foreign-born residents in Chico 7,290 residents are foreign born (3.2% Latin America , 2.9% Asia , 0.9% Europe ).
This city:
7.9%California:
100.0%
Marital status for residents in Chico Marital status - White (Caucasian) population 15 years and over
Males 49.0% Never married38.3% Now married1.0% Separated2.1% Widowed9.6% DivorcedFemales 39.5% Never married34.5% Now married2.6% Separated9.4% Widowed14.0% DivorcedWomen who gave birth in the past 12 months Now married:
87.9% (788)Unmarried:
12.1% (108)
Women who did not give birth in the past 12 months Now married:
29.5% (5,181)Unmarried:
70.5% (12,401)
Marital status - Black or African American population 15 years and over
Males 62.5% Never married14.0% Now married0.0% Separated9.1% Widowed14.4% DivorcedFemales 54.6% Never married23.7% Now married9.6% Separated1.5% Widowed10.6% DivorcedWomen who gave birth in the past 12 months Now married:
100.0% (23)Unmarried:
0.0% (0)
Women who did not give birth in the past 12 months Now married:
20.2% (87)Unmarried:
79.8% (345)
Marital status - American Indian / Alaska Native population 15 years and over
Males 62.8% Never married26.4% Now married0.0% Separated0.8% Widowed10.1% DivorcedFemales 46.1% Never married15.1% Now married2.3% Separated2.3% Widowed34.2% DivorcedWomen who gave birth in the past 12 months Now married:
65.5% (28)Unmarried:
34.5% (15)
Women who did not give birth in the past 12 months Now married:
3.5% (6)Unmarried:
96.5% (161)
Marital status - Asian population 15 years and over
Males 66.5% Never married30.7% Now married0.2% Separated0.5% Widowed2.1% DivorcedFemales 45.0% Never married33.3% Now married1.6% Separated5.1% Widowed15.0% DivorcedWomen who gave birth in the past 12 months Now married:
100.0% (44)Unmarried:
0.0% (0)
Women who did not give birth in the past 12 months Now married:
23.7% (396)Unmarried:
76.3% (1,272)
Marital status - Native Hawaiian / Pacific Islander population 15 years and over
Males 25.0% Never married37.1% Now married0.0% Separated0.0% Widowed37.9% DivorcedFemales 66.0% Never married34.0% Now married0.0% Separated0.0% Widowed0.0% DivorcedWomen who did not give birth in the past 12 months Now married:
41.1% (49)Unmarried:
58.9% (70)
Marital status - Other race population 15 years and over
Males 48.0% Never married43.2% Now married0.0% Separated0.0% Widowed8.7% DivorcedFemales 42.1% Never married31.0% Now married4.4% Separated4.6% Widowed18.0% DivorcedWomen who gave birth in the past 12 months Now married:
100.0% (201)Unmarried:
0.0% (0)
Women who did not give birth in the past 12 months Now married:
19.4% (378)Unmarried:
80.6% (1,567)
Marital status - Two or more races population 15 years and over
Males 69.9% Never married24.0% Now married1.4% Separated0.0% Widowed4.8% DivorcedFemales 63.1% Never married21.2% Now married5.4% Separated3.4% Widowed6.9% DivorcedWomen who gave birth in the past 12 months Now married:
55.6% (74)Unmarried:
44.4% (59)
Women who did not give birth in the past 12 months Now married:
24.4% (977)Unmarried:
75.6% (3,029)
Marital status - White alone, not Hispanic / Latino population 15 years and over
Males 47.9% Never married38.9% Now married1.1% Separated2.2% Widowed9.8% DivorcedFemales 36.9% Never married36.3% Now married1.0% Separated10.4% Widowed15.3% DivorcedWomen who gave birth in the past 12 months Now married:
73.5% (358)Unmarried:
26.5% (129)
Women who did not give birth in the past 12 months Now married:
30.7% (5,329)Unmarried:
69.3% (12,018)
Marital status - Hispanic or Latino population 15 years and over
Males 54.3% Never married37.9% Now married0.1% Separated0.6% Widowed7.0% DivorcedFemales 54.0% Never married24.8% Now married9.0% Separated3.2% Widowed8.9% DivorcedWomen who gave birth in the past 12 months Now married:
89.2% (811)Unmarried:
10.8% (98)
Women who did not give birth in the past 12 months Now married:
21.7% (1,366)Unmarried:
78.3% (4,937)
Ancestries in Chico
3,019 8.2% American2,628 7.2% European2,247 6.1% Irish2,089 5.7% German2,080 5.7% English1,146 3.1% Italian545 1.5% Portuguese520 1.4% Norwegian431 1.2% Scottish364 1.0% Swedish328 0.9% Polish281 0.8% Russian253 0.7% Northern European250 0.7% Dutch238 0.6% French186 0.5% Scotch-Irish174 0.5% Danish165 0.5% Greek126 0.3% Scandinavian124 0.3% French Canadian119 0.3% Arab102 0.3% Canadian100 0.3% British93 0.3% Eastern European90 0.2% African85 0.2% Iranian68 0.2% Swiss61 0.2% Hungarian60 0.2% Czech50 0.1% Welsh48 0.1% Ethiopian46 0.1% Syrian46 0.1% Slovene43 0.1% Nigerian39 0.1% Basque32 0.09% Finnish31 0.08% Yugoslavian30 0.08% Romanian29 0.08% Ukrainian28 0.08% Israeli27 0.07% Senegalese23 0.06% Lebanese23 0.06% Palestinian23 0.06% Australian23 0.06% Austrian23 0.06% Armenian17 0.05% Iraqi17 0.05% Egyptian16 0.04% Jordanian16 0.04% Lithuanian13 0.04% Assyrian13 0.04% Cajun12 0.03% Icelander12 0.03% Celtic12 0.03% Kenyan11 0.03% Brazilian8 0.02% Latvian8 0.02% Slovak5 0.01% Czechoslovakian4 0.01% German Russian3 0.01% Croatian2 0.01% Slavic
Geographical mobility in Chico Same house 1 year ago 49,527 73.3% White (Caucasian)1,509 78.8% Black or African American585 71.4% American Indian / Alaska Native3,932 82.2% Asian322 85.0% Native Hawaiian / Pacific Islander4,498 71.7% Other race9,995 76.3% Two or more races48,802 77.6% White alone, not Hispanic / Latino12,931 74.0% Hispanic or LatinoMoved within same county 11,468 17.0% White / Caucasian170 8.9% Black or African American92 11.2% American Indian / Alaska Native439 9.2% Asian20 5.4% Native Hawaiian / Pacific Islander647 10.3% Other race1,508 11.5% Two or more races8,446 13.4% White alone, not Hispanic / Latino2,457 14.1% Hispanic or LatinoMoved within same state 5,141 7.6% White / Caucasian209 10.9% Black or African American116 14.2% American Indian / Alaska Native385 8.0% Asian37 9.8% Native Hawaiian / Pacific Islander1,173 18.7% Other race984 7.5% Two or more races4,373 7.0% White alone, not Hispanic / Latino1,616 9.2% Hispanic or LatinoMoved from different state 863 1.3% White / Caucasian11 0.6% Black or African American9 1.1% American Indian / Alaska Native21 0.4% Asian4 0.1% Other race27 0.2% Two or more races646 1.0% White alone, not Hispanic / Latino86 0.5% Hispanic or LatinoMoved from abroad 12 0.6% Black or African American37 0.8% Asian111 0.2% White alone, not Hispanic / Latino69 0.4% Hispanic or Latino
Children Nativity (place of birth) in Chico
Children under 6 years - Living with two parents Both parents native 3,338 100.0% NativeBoth parents foreign-born 239 95.8% Native10 4.2% Foreign-bornOne native, one foreign-born parent 204 100.0% NativeChildren under 6 years - Living with one parent Native parent 1,168 100.0% NativeForeign-born parent 201 100.0% NativeChildren 6 to 17 years - Living with two parents Both parents native 5,355 99.9% Native8 0.1% Foreign-bornBoth parents foreign-born 456 84.1% Native87 15.9% Foreign-bornOne native, one foreign-born parent 871 100.0% NativeChildren 6 to 17 years - Living with one parent Native parent 3,969 100.0% NativeForeign-born parent 549 50.7% Native535 49.3% Foreign-born
Grandparents responsible for own grandchildren in Chico
Grandparents (30 to 59 years) White / Caucasian 34 15.8% Responsible for grandchildren182 84.2% Not responsible for grandchildrenAmerican Indian / Alaska Native 1 3.8% Responsible for grandchildren16 96.2% Not responsible for grandchildrenAsian 30 88.5% Responsible for grandchildren4 11.5% Not responsible for grandchildrenOther race 29 100.0% Not responsible for grandchildrenTwo or more races 2 100.0% Responsible for grandchildrenWhite alone, not Hispanic / Latino 31 10.6% Responsible for grandchildren261 89.4% Not responsible for grandchildrenHispanic or Latino 19 36.1% Responsible for grandchildren33 63.9% Not responsible for grandchildrenGrandparents (60 years and over) White / Caucasian 141 35.9% Responsible for grandchildren252 64.1% Not responsible for grandchildrenAsian 79 100.0% Not responsible for grandchildrenOther race 1 100.0% Not responsible for grandchildrenWhite alone, not Hispanic / Latino 185 36.1% Responsible for grandchildren327 63.9% Not responsible for grandchildrenHispanic or Latino 29 100.0% Not responsible for grandchildren