Races in Chino Hills, California (CA) Detailed Stats
Data:
Races - White alone (%)
Races - White alone (% change since 2000)
Races - Black alone (%)
Races - Black alone (% change since 2000)
Races - American Indian alone (%)
Races - American Indian alone (% change since 2000)
Races - Asian alone (%)
Races - Asian alone (% change since 2000)
Races - Hispanic (%)
Races - Hispanic (% change since 2000)
Races - Native Hawaiian and Other Pacific Islander alone (%)
Races - Native Hawaiian and Other Pacific Islander alone (% change since 2000)
Races - Two or more races(%)
Races - Two or more races(% change since 2000)
Races - Other race alone (%)
Races - Other race alone (% change since 2000)
Racial diversity
Place of birth - Born in state of residence (%)
Place of birth - Born in state of residence (%) - White
Place of birth - Born in state of residence (%) - Black or African American
Place of birth - Born in state of residence (%) - Asian
Place of birth - Born in state of residence (%) - Hispanic or Latino
Place of birth - Born in state of residence (%) - American Indian and Alaska Native
Place of birth - Born in state of residence (%) - Multirace
Place of birth - Born in state of residence (%) - Other Race
Place of birth - Born in other state (%)
Place of birth - Born in other state (%) - White
Place of birth - Born in other state (%) - Black or African American
Place of birth - Born in other state (%) - Asian
Place of birth - Born in other state (%) - Hispanic or Latino
Place of birth - Born in other state (%) - American Indian and Alaska Native
Place of birth - Born in other state (%) - Multirace
Place of birth - Born in other state (%) - Other Race
Place of birth - Native, outside of US (%)
Place of birth - Native, outside of US (%) - White
Place of birth - Native, outside of US (%) - Black or African American
Place of birth - Native, outside of US (%) - Asian
Place of birth - Native, outside of US (%) - Hispanic or Latino
Place of birth - Native, outside of US (%) - American Indian and Alaska Native
Place of birth - Native, outside of US (%) - Multirace
Place of birth - Native, outside of US (%) - Other Race
Place of birth - Foreign born (%)
Place of birth - Foreign born (%) - White
Place of birth - Foreign born (%) - Black or African American
Place of birth - Foreign born (%) - Asian
Place of birth - Foreign born (%) - Hispanic or Latino
Place of birth - Foreign born (%) - American Indian and Alaska Native
Place of birth - Foreign born (%) - Multirace
Place of birth - Foreign born (%) - Other Race
Residents speaking English at home (%)
Residents speaking English at home - Born in the United States (%)
Residents speaking English at home - Native, born elsewhere (%)
Residents speaking English at home - Foreign born (%)
Residents speaking Spanish at home (%)
Residents speaking Spanish at home - Born in the United States (%)
Residents speaking Spanish at home - Native, born elsewhere (%)
Residents speaking Spanish at home - Foreign born (%)
Residents speaking other language at home (%)
Residents speaking other language at home - Born in the United States (%)
Residents speaking other language at home - Native, born elsewhere (%)
Residents speaking other language at home - Foreign born (%)
Marital status - Never married (%)
Marital status - Now married (%)
Marital status - Separated (%)
Marital status - Widowed (%)
Marital status - Divorced (%)
Ancestries Reported - Arab (%)
Ancestries Reported - Czech (%)
Ancestries Reported - Danish (%)
Ancestries Reported - Dutch (%)
Ancestries Reported - English (%)
Ancestries Reported - French (%)
Ancestries Reported - French Canadian (%)
Ancestries Reported - German (%)
Ancestries Reported - Greek (%)
Ancestries Reported - Hungarian (%)
Ancestries Reported - Irish (%)
Ancestries Reported - Italian (%)
Ancestries Reported - Lithuanian (%)
Ancestries Reported - Norwegian (%)
Ancestries Reported - Polish (%)
Ancestries Reported - Portuguese (%)
Ancestries Reported - Russian (%)
Ancestries Reported - Scotch-Irish (%)
Ancestries Reported - Scottish (%)
Ancestries Reported - Slovak (%)
Ancestries Reported - Subsaharan African (%)
Ancestries Reported - Swedish (%)
Ancestries Reported - Swiss (%)
Ancestries Reported - Ukrainian (%)
Ancestries Reported - United States (%)
Ancestries Reported - Welsh (%)
Ancestries Reported - West Indian (%)
Ancestries Reported - Other (%)
Geographical mobility - Same house 1 year ago (%)
Geographical mobility - Same house 1 year ago (%) - White
Geographical mobility - Same house 1 year ago (%) - Black or African American
Geographical mobility - Same house 1 year ago (%) - Asian
Geographical mobility - Same house 1 year ago (%) - Hispanic or Latino
Geographical mobility - Same house 1 year ago (%) - American Indian and Alaska Native
Geographical mobility - Same house 1 year ago (%) - Multirace
Geographical mobility - Same house 1 year ago (%) - Other Race
Geographical mobility - Moved within same county (%)
Geographical mobility - Moved within same county (%) - White
Geographical mobility - Moved within same county (%) - Black or African American
Geographical mobility - Moved within same county (%) - Asian
Geographical mobility - Moved within same county (%) - Hispanic or Latino
Geographical mobility - Moved within same county (%) - American Indian and Alaska Native
Geographical mobility - Moved within same county (%) - Multirace
Geographical mobility - Moved within same county (%) - Other Race
Geographical mobility - Moved from different county within same state (%)
Geographical mobility - Moved from different county within same state (%) - White
Geographical mobility - Moved from different county within same state (%) - Black or African American
Geographical mobility - Moved from different county within same state (%) - Asian
Geographical mobility - Moved from different county within same state (%) - Hispanic or Latino
Geographical mobility - Moved from different county within same state (%) - American Indian and Alaska Native
Geographical mobility - Moved from different county within same state (%) - Multirace
Geographical mobility - Moved from different county within same state (%) - Other Race
Geographical mobility - Moved from different state (%)
Geographical mobility - Moved from different state (%) - White
Geographical mobility - Moved from different state (%) - Black or African American
Geographical mobility - Moved from different state (%) - Asian
Geographical mobility - Moved from different state (%) - Hispanic or Latino
Geographical mobility - Moved from different state (%) - American Indian and Alaska Native
Geographical mobility - Moved from different state (%) - Multirace
Geographical mobility - Moved from different state (%) - Other Race
Geographical mobility - Moved from abroad (%)
Geographical mobility - Moved from abroad (%) - White
Geographical mobility - Moved from abroad (%) - Black or African American
Geographical mobility - Moved from abroad (%) - Asian
Geographical mobility - Moved from abroad (%) - Hispanic or Latino
Geographical mobility - Moved from abroad (%) - American Indian and Alaska Native
Geographical mobility - Moved from abroad (%) - Multirace
Geographical mobility - Moved from abroad (%) - Other Race
Place of birth for the foreign-born population - Ireland (%)
Place of birth for the foreign-born population - Denmark (%)
Place of birth for the foreign-born population - Norway (%)
Place of birth for the foreign-born population - Sweden (%)
Place of birth for the foreign-born population - United Kingdom (%)
Place of birth for the foreign-born population - England (%)
Place of birth for the foreign-born population - Scotland (%)
Place of birth for the foreign-born population - Other Northern Europe (%)
Place of birth for the foreign-born population - Austria (%)
Place of birth for the foreign-born population - Belgium (%)
Place of birth for the foreign-born population - France (%)
Place of birth for the foreign-born population - Germany (%)
Place of birth for the foreign-born population - Netherlands (%)
Place of birth for the foreign-born population - Switzerland (%)
Place of birth for the foreign-born population - Other Western Europe (%)
Place of birth for the foreign-born population - Greece (%)
Place of birth for the foreign-born population - Italy (%)
Place of birth for the foreign-born population - Portugal (%)
Place of birth for the foreign-born population - Spain (%)
Place of birth for the foreign-born population - Other Southern Europe (%)
Place of birth for the foreign-born population - Albania (%)
Place of birth for the foreign-born population - Belarus (%)
Place of birth for the foreign-born population - Bosnia and Herzegovina (%)
Place of birth for the foreign-born population - Bulgaria (%)
Place of birth for the foreign-born population - Croatia (%)
Place of birth for the foreign-born population - Czechoslovakia (%)
Place of birth for the foreign-born population - Hungary (%)
Place of birth for the foreign-born population - Latvia (%)
Place of birth for the foreign-born population - Lithuania (%)
Place of birth for the foreign-born population - North Macedonia (Macedonia) (%)
Place of birth for the foreign-born population - Moldova (%)
Place of birth for the foreign-born population - Poland (%)
Place of birth for the foreign-born population - Romania (%)
Place of birth for the foreign-born population - Russia (%)
Place of birth for the foreign-born population - Serbia (%)
Place of birth for the foreign-born population - Ukraine (%)
Place of birth for the foreign-born population - Other Eastern Europe (%)
Place of birth for the foreign-born population - China (%)
Place of birth for the foreign-born population - Hong Kong (%)
Place of birth for the foreign-born population - Taiwan (%)
Place of birth for the foreign-born population - Japan (%)
Place of birth for the foreign-born population - Korea (%)
Place of birth for the foreign-born population - Other Eastern Asia (%)
Place of birth for the foreign-born population - Afghanistan (%)
Place of birth for the foreign-born population - Bangladesh (%)
Place of birth for the foreign-born population - India (%)
Place of birth for the foreign-born population - Iran (%)
Place of birth for the foreign-born population - Kazakhstan (%)
Place of birth for the foreign-born population - Nepal (%)
Place of birth for the foreign-born population - Pakistan (%)
Place of birth for the foreign-born population - Sri Lanka (%)
Place of birth for the foreign-born population - Uzbekistan (%)
Place of birth for the foreign-born population - Other South Central Asia (%)
Place of birth for the foreign-born population - Burma (%)
Place of birth for the foreign-born population - Cambodia (%)
Place of birth for the foreign-born population - Indonesia (%)
Place of birth for the foreign-born population - Laos (%)
Place of birth for the foreign-born population - Malaysia (%)
Place of birth for the foreign-born population - Philippines (%)
Place of birth for the foreign-born population - Singapore (%)
Place of birth for the foreign-born population - Thailand (%)
Place of birth for the foreign-born population - Vietnam (%)
Place of birth for the foreign-born population - Other South Eastern Asia (%)
Place of birth for the foreign-born population - Armenia (%)
Place of birth for the foreign-born population - Iraq (%)
Place of birth for the foreign-born population - Israel (%)
Place of birth for the foreign-born population - Jordan (%)
Place of birth for the foreign-born population - Kuwait (%)
Place of birth for the foreign-born population - Lebanon (%)
Place of birth for the foreign-born population - Saudi Arabia (%)
Place of birth for the foreign-born population - Syria (%)
Place of birth for the foreign-born population - Turkey (%)
Place of birth for the foreign-born population - Yemen (%)
Place of birth for the foreign-born population - Other Western Asia (%)
Place of birth for the foreign-born population - Eritrea (%)
Place of birth for the foreign-born population - Ethiopia (%)
Place of birth for the foreign-born population - Kenya (%)
Place of birth for the foreign-born population - Somalia (%)
Place of birth for the foreign-born population - Uganda (%)
Place of birth for the foreign-born population - Zimbabwe (%)
Place of birth for the foreign-born population - Other Eastern Africa (%)
Place of birth for the foreign-born population - Cameroon (%)
Place of birth for the foreign-born population - Congo (%)
Place of birth for the foreign-born population - Democratic Republic of Congo (Zaire) (%)
Place of birth for the foreign-born population - Other Middle Africa (%)
Place of birth for the foreign-born population - Egypt (%)
Place of birth for the foreign-born population - Morocco (%)
Place of birth for the foreign-born population - Sudan (%)
Place of birth for the foreign-born population - Other Northern Africa (%)
Place of birth for the foreign-born population - South Africa (%)
Place of birth for the foreign-born population - Other Southern Africa (%)
Place of birth for the foreign-born population - Cabo Verde (%)
Place of birth for the foreign-born population - Ghana (%)
Place of birth for the foreign-born population - Liberia (%)
Place of birth for the foreign-born population - Nigeria (%)
Place of birth for the foreign-born population - Senegal (%)
Place of birth for the foreign-born population - Sierra Leone (%)
Place of birth for the foreign-born population - Other Western Africa (%)
Place of birth for the foreign-born population - Australia (%)
Place of birth for the foreign-born population - New Zealand (%)
Place of birth for the foreign-born population - Fiji (%)
Place of birth for the foreign-born population - Micronesia (%)
Place of birth for the foreign-born population - Bahamas (%)
Place of birth for the foreign-born population - Barbados (%)
Place of birth for the foreign-born population - Cuba (%)
Place of birth for the foreign-born population - Dominica (%)
Place of birth for the foreign-born population - Dominican Republic (%)
Place of birth for the foreign-born population - Grenada (%)
Place of birth for the foreign-born population - Haiti (%)
Place of birth for the foreign-born population - Jamaica (%)
Place of birth for the foreign-born population - St. Vincent and the Grenadines (%)
Place of birth for the foreign-born population - Trinidad and Tobago (%)
Place of birth for the foreign-born population - West Indies (%)
Place of birth for the foreign-born population - Other Caribbean (%)
Place of birth for the foreign-born population - Belize (%)
Place of birth for the foreign-born population - Costa Rica (%)
Place of birth for the foreign-born population - El Salvador (%)
Place of birth for the foreign-born population - Guatemala (%)
Place of birth for the foreign-born population - Honduras (%)
Place of birth for the foreign-born population - Mexico (%)
Place of birth for the foreign-born population - Nicaragua (%)
Place of birth for the foreign-born population - Panama (%)
Place of birth for the foreign-born population - Other Central America (%)
Place of birth for the foreign-born population - Argentina (%)
Place of birth for the foreign-born population - Bolivia (%)
Place of birth for the foreign-born population - Brazil (%)
Place of birth for the foreign-born population - Chile (%)
Place of birth for the foreign-born population - Colombia (%)
Place of birth for the foreign-born population - Ecuador (%)
Place of birth for the foreign-born population - Guyana (%)
Place of birth for the foreign-born population - Peru (%)
Place of birth for the foreign-born population - Uruguay (%)
Place of birth for the foreign-born population - Venezuela (%)
Place of birth for the foreign-born population - Other South America (%)
Place of birth for the foreign-born population - Canada (%)
Place of birth for the foreign-born population - Other Northern America (%)
Place of birth for the foreign-born population - Other (%)
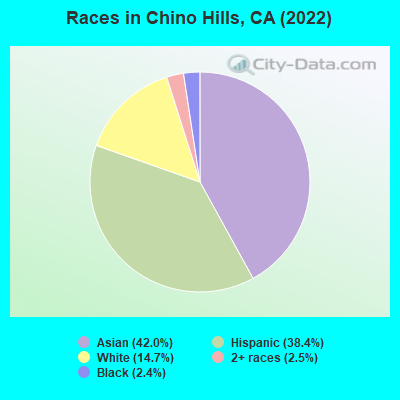
According to 2022 data, the most numerous races in Chino Hills, CA are Hispanic (24,485 residents), White alone (21,773 residents), and Asian alone (30,771 residents). 58.1% of Chino Hills residents speak English at home. 29.5% of Chino Hills, CA residents are foreign-born (21.8% born in Asia, 5.5% born in Latin America), which is 11.9% greater than the foreign-born rate of 26.0% across the entire state of California.
Race distribution in Chino Hills
2000 2022
29,247 43.8% White alone 17,151 25.7% Hispanic 14,575 21.8% Asian alone 3,573 5.3% Black alone 1,831 2.7% Two or more races 195 0.3% American Indian alone 143 0.2% Other race alone 72 0.1% Native Hawaiian and Other
30,771 37.5% Asian alone 24,485 29.9% Hispanic 21,773 26.5% White alone 3,023 3.7% Two or more races 2,765 3.4% Black alone 228 0.3% American Indian alone 200 0.2% Other race alone 86 0.1% Native Hawaiian and Other
2000 2022
15,816,790 46.7% White alone 10,966,556 32.4% Hispanic 3,648,860 10.8% Asian alone 2,181,926 6.4% Black alone 903,115 2.7% Two or more races 178,984 0.5% American Indian alone 103,736 0.3% Native Hawaiian and Other 71,681 0.2% Other race alone
15,732,184 40.3% Hispanic 13,160,426 33.7% White alone 5,957,867 15.3% Asian alone 2,025,218 5.2% Black alone 1,663,222 4.3% Two or more races 251,618 0.6% Other race alone 135,777 0.3% Native Hawaiian and Other 103,030 0.3% American Indian alone
Income and house value in Chino Hills Median household income in 2022 $131,194 White non-Hispanic householders$114,687 Black householdersover $200,000 American Indian and Alaska Native householders$128,276 Asian householders$94,238 Native Hawaiian and other Pacific Islander householders$113,947 Some other race householders$131,504 Two or more races householders$117,120 Hispanic or Latino race householdersMedian 2022 house value $870,309 White Non-Hispanic householders$943,735 Black or African American householders$574,447 American Indian or Alaska Native householders $930,418 Asian householders$305,940 Native Hawaiian and other Pacific Islander householders$788,605 Some other race householders$815,600 Two or more races householders$801,923 Hispanic or Latino householders
Median age by race in Chino Hills
50.0 Median age for White residents48.4 51.3 51.0 Median age for Black or African American residents55.9 29.1 44.3 Median age for American Indian / Alaska Native residents46.6 48.1 40.8 Median age for Asian residents40.0 41.8 83.0 Median age for Native Hawaiian / Pacific Islander residents30.0 Median age for Other race residents28.2 30.3 24.6 Median age for Two or more races residents23.4 31.5 49.5 Median age for White alone residents49.0 49.7 33.1 Median age for Hispanic or Latino residents28.0 37.9
Owner/renter occupied households by race in Chino Hills
House owners and renters - White residents 9,001 78.2% Owner occupied2,513 21.8% Renter occupiedHouse owners and renters - Black or African American residents 618 67.8% Owner occupied294 32.2% Renter occupiedHouse owners and renters - American Indian / Alaska Native residents 303 81.9% Owner occupied67 18.1% Renter occupiedHouse owners and renters - Asian residents 8,908 75.0% Owner occupied2,969 25.0% Renter occupiedHouse owners and renters - Native Hawaiian / Pacific Islander residents 44 100.0% Owner occupiedHouse owners and renters - Other race residents 1,226 65.1% Owner occupied658 34.9% Renter occupiedHouse owners and renters - Two or more races residents 1,764 78.5% Owner occupied483 21.5% Renter occupiedHouse owners and renters - White alone residents 7,028 75.6% Owner occupied2,267 24.4% Renter occupiedHouse owners and renters - Hispanic or Latino residents 4,376 76.8% Owner occupied1,325 23.2% Renter occupied
Language usage in Chino Hills
English speakers - Total 58.1% of residents of Chino Hills speak English at home.
13.9% of residents speak Spanish at home 8,604 81.0% Speak English very well2,021 19.0% Speak English less than very well28.6% of residents speak other language at home 13,096 60.0% Speak English very well8,747 40.0% Speak English less than very well
English speakers - Born in the United States 88.0% of residents of Chino Hills speak English at home.
6.5% of residents speak Spanish at home 430 77.1% Speak English very well128 22.9% Speak English less than very well5.6% of residents speak other language at home 348 72.8% Speak English very well130 27.2% Speak English less than very well
English speakers - Native, born elsewhere 68.5% of residents of Chino Hills speak English at home.
13.5% of residents speak Spanish at home 108 78.8% Speak English very well29 21.2% Speak English less than very well17.7% of residents speak other language at home 147 81.7% Speak English very well33 18.3% Speak English less than very well
English speakers - Foreign-born 13.6% of residents of Chino Hills speak English at home.
16.0% of residents speak Spanish at home 2,474 65.9% Speak English very well1,281 34.1% Speak English less than very well72.5% of residents speak other language at home 8,996 52.9% Speak English very well8,006 47.1% Speak English less than very well
White (Caucasian) - Speak only English Native:
94.8% (24,750)Foreign-born:
44.6% (816)
White (Caucasian) - Speak another language Native:
8.2% (2,135)Foreign-born:
63.5% (1,163)
Black or African American - Speak only English Native:
94.4% (2,273)Foreign-born:
10.6% (44)
Black or African American - Speak another language Native:
6.1% (147)Foreign-born:
100.0% (416)
Asian - Speak only English Native:
70.4% (8,687)Foreign-born:
8.7% (1,943)
Asian - Speak another language Native:
30.5% (3,762)Foreign-born:
91.0% (20,234)
Native Hawaiian / Pacific Islander - Speak another language Native:
81.8% (66)Foreign-born:
100.0% (25)
Other race - Speak only English Native:
48.0% (2,402)Foreign-born:
17.6% (322)
Other race - Speak another language Native:
54.5% (2,725)Foreign-born:
87.4% (1,604)
Two or more races - Speak only English Native:
64.6% (5,043)Foreign-born:
30.4% (648)
Two or more races - Speak another language Native:
34.6% (2,701)Foreign-born:
55.8% (1,190)
White alone - Speak only English Native:
90.8% (19,577)Foreign-born:
41.9% (548)
White alone - Speak another language Native:
9.3% (2,011)Foreign-born:
57.9% (758)
Hispanic or Latino - Speak only English Native:
68.7% (10,485)Foreign-born:
33.8% (1,050)
Hispanic or Latino - Speak another language Native:
33.5% (5,106)Foreign-born:
73.6% (2,288)
Foreign-born residents in Chino Hills 24,215 residents are foreign born (21.8% Asia , 5.5% Latin America ).
This city:
29.5%California:
100.0%
Marital status for residents in Chino Hills Marital status - White (Caucasian) population 15 years and over
Males 30.3% Never married54.5% Now married0.8% Separated2.1% Widowed12.3% DivorcedFemales 25.7% Never married52.1% Now married0.7% Separated4.9% Widowed16.6% DivorcedWomen who gave birth in the past 12 months Now married:
48.6% (133)Unmarried:
51.4% (141)
Women who did not give birth in the past 12 months Now married:
41.4% (2,190)Unmarried:
58.6% (3,100)
Marital status - Black or African American population 15 years and over
Males 40.6% Never married52.8% Now married1.1% Separated0.0% Widowed5.5% DivorcedFemales 32.8% Never married46.4% Now married1.2% Separated10.6% Widowed9.1% DivorcedWomen who did not give birth in the past 12 months Now married:
32.8% (191)Unmarried:
67.2% (391)
Marital status - American Indian / Alaska Native population 15 years and over
Males 30.4% Never married35.6% Now married10.0% Separated3.6% Widowed20.4% DivorcedFemales 27.3% Never married68.0% Now married0.0% Separated0.0% Widowed4.7% DivorcedWomen who gave birth in the past 12 months Now married:
100.0% (45)Unmarried:
0.0% (0)
Women who did not give birth in the past 12 months Now married:
39.2% (67)Unmarried:
60.8% (104)
Marital status - Asian population 15 years and over
Males 28.7% Never married66.2% Now married0.5% Separated0.7% Widowed3.9% DivorcedFemales 16.4% Never married71.9% Now married2.1% Separated4.5% Widowed5.1% DivorcedWomen who gave birth in the past 12 months Now married:
100.0% (543)Unmarried:
0.0% (0)
Women who did not give birth in the past 12 months Now married:
67.9% (5,721)Unmarried:
32.1% (2,710)
Marital status - Native Hawaiian / Pacific Islander population 15 years and over
Males 0.0% Never married100.0% Now married0.0% Separated0.0% Widowed0.0% DivorcedFemales 0.0% Never married100.0% Now married0.0% Separated0.0% Widowed0.0% DivorcedMarital status - Other race population 15 years and over
Males 43.5% Never married44.7% Now married1.5% Separated0.0% Widowed10.3% DivorcedFemales 36.1% Never married38.5% Now married11.6% Separated7.3% Widowed6.4% DivorcedWomen who gave birth in the past 12 months Now married:
100.0% (99)Unmarried:
0.0% (0)
Women who did not give birth in the past 12 months Now married:
40.8% (820)Unmarried:
59.2% (1,188)
Marital status - Two or more races population 15 years and over
Males 52.7% Never married37.5% Now married1.2% Separated0.0% Widowed8.6% DivorcedFemales 49.2% Never married42.1% Now married0.0% Separated1.5% Widowed7.1% DivorcedWomen who did not give birth in the past 12 months Now married:
31.6% (936)Unmarried:
68.4% (2,022)
Marital status - White alone, not Hispanic / Latino population 15 years and over
Males 27.3% Never married57.0% Now married0.0% Separated2.0% Widowed13.6% DivorcedFemales 23.7% Never married55.5% Now married1.0% Separated4.2% Widowed15.5% DivorcedWomen who gave birth in the past 12 months Now married:
83.0% (159)Unmarried:
17.0% (33)
Women who did not give birth in the past 12 months Now married:
44.7% (1,838)Unmarried:
55.3% (2,278)
Marital status - Hispanic or Latino population 15 years and over
Males 48.0% Never married39.3% Now married5.7% Separated1.5% Widowed5.6% DivorcedFemales 38.5% Never married34.3% Now married5.0% Separated5.6% Widowed16.6% DivorcedWomen who gave birth in the past 12 months Now married:
91.0% (296)Unmarried:
9.0% (29)
Women who did not give birth in the past 12 months Now married:
41.5% (2,742)Unmarried:
58.5% (3,859)
Ancestries in Chino Hills
1,428 2.8% German1,333 2.6% American1,180 2.3% European927 1.8% English922 1.8% Irish666 1.3% Italian410 0.8% French356 0.7% Egyptian278 0.5% Nigerian259 0.5% Polish253 0.5% Scandinavian219 0.4% British214 0.4% African212 0.4% Norwegian208 0.4% Scottish193 0.4% Eastern European191 0.4% Armenian190 0.4% Swiss177 0.3% Dutch139 0.3% Palestinian128 0.3% Russian127 0.3% French Canadian122 0.2% Lebanese122 0.2% Ethiopian97 0.2% Greek90 0.2% Arab84 0.2% Syrian83 0.2% Swedish75 0.1% Iranian73 0.1% Ukrainian72 0.1% Canadian68 0.1% Welsh56 0.1% Afghan52 0.1% Portuguese48 0.09% Northern European44 0.09% Danish41 0.08% Croatian39 0.08% Hungarian36 0.07% Estonian29 0.06% Scotch-Irish24 0.05% Guyanese22 0.04% Basque22 0.04% Ghanaian20 0.04% Czech11 0.02% Pennsylvania German10 0.02% Haitian9 0.02% Austrian9 0.02% Finnish
Geographical mobility in Chino Hills Same house 1 year ago 24,930 90.3% White (Caucasian)2,223 75.2% Black or African American763 98.9% American Indian / Alaska Native33,698 90.5% Asian86 100.0% Native Hawaiian / Pacific Islander5,648 78.1% Other race9,409 91.4% Two or more races20,292 90.8% White alone, not Hispanic / Latino20,444 87.3% Hispanic or LatinoMoved within same county 538 1.9% White / Caucasian96 3.2% Black or African American2 0.3% American Indian / Alaska Native515 1.4% Asian794 11.0% Other race508 4.9% Two or more races819 3.7% White alone, not Hispanic / Latino1,487 6.3% Hispanic or LatinoMoved within same state 1,018 3.7% White / Caucasian247 8.4% Black or African American28 3.6% American Indian / Alaska Native2,310 6.2% Asian595 8.2% Other race347 3.4% Two or more races989 4.4% White alone, not Hispanic / Latino1,254 5.4% Hispanic or LatinoMoved from different state 932 3.4% White / Caucasian196 6.6% Black or African American502 1.3% Asian21 0.3% Other race103 1.0% Two or more races286 1.3% White alone, not Hispanic / Latino107 0.5% Hispanic or LatinoMoved from abroad 346 1.3% White86 2.9% Black or African American492 1.3% Asian11 0.1% Two or more races77 0.3% White alone, not Hispanic / Latino121 0.5% Hispanic or Latino
Children Nativity (place of birth) in Chino Hills
Children under 6 years - Living with two parents Both parents native 1,363 100.0% NativeBoth parents foreign-born 1,939 100.0% NativeOne native, one foreign-born parent 1,325 100.0% NativeChildren under 6 years - Living with one parent Native parent 142 100.0% NativeForeign-born parent 203 100.0% NativeChildren 6 to 17 years - Living with two parents Both parents native 3,666 100.0% NativeBoth parents foreign-born 2,948 83.0% Native606 17.0% Foreign-bornOne native, one foreign-born parent 2,213 100.0% NativeChildren 6 to 17 years - Living with one parent Native parent 1,283 100.0% NativeForeign-born parent 916 51.6% Native859 48.4% Foreign-born
Place of birth for residents in Chino Hills 17,814 Asia10,290 Eastern Asia7,739 China5,633 South Eastern Asia4,842 Americas4,488 Latin America3,790 Central America1,356 South Central Asia935 Africa614 Europe523 Western Asia515 South America421 Western Africa354 Northern America268 Northern Africa235 Northern Europe200 Western Europe182 Caribbean137 Eastern Africa97 Southern Europe81 Eastern Europe8 Oceania8 Australia and New Zealand Subregion5,256 China3,812 Philippines3,193 Mexico2,214 Korea1,957 Taiwan943 India645 Vietnam572 Indonesia524 Hong Kong383 Nigeria354 Canada337 Japan265 Pakistan265 El Salvador225 Egypt222 Guatemala201 Ecuador153 Cuba139 Germany138 Cambodia125 Malaysia118 Kuwait117 Laos116 Thailand115 United Kingdom94 Brazil89 Lebanon85 Iran81 Ethiopia79 England75 Jordan72 Syria68 Peru67 Burma60 Netherlands59 Argentina51 Honduras42 Morocco40 Spain39 Afghanistan38 Greece37 Singapore33 Colombia33 Ukraine31 Guyana28 Costa Rica24 Sierra Leone23 Russia22 Uganda22 Kenya22 Bangladesh22 Dominican Republic21 Nicaragua18 Italy18 Uruguay13 Ghana12 Czechoslovakia12 Hungary11 Ireland10 Denmark8 Bolivia8 Scotland8 Australia7 Panama6 Saudi Arabia6 Israel
Grandparents responsible for own grandchildren in Chino Hills
Grandparents (30 to 59 years) White / Caucasian 28 22.8% Responsible for grandchildren95 77.2% Not responsible for grandchildrenBlack or African American 51 100.0% Not responsible for grandchildrenAmerican Indian / Alaska Native 9 9.1% Responsible for grandchildren91 90.9% Not responsible for grandchildrenAsian 8 6.4% Responsible for grandchildren110 93.6% Not responsible for grandchildrenOther race 151 100.0% Not responsible for grandchildrenWhite alone, not Hispanic / Latino 3 5.4% Responsible for grandchildren50 94.6% Not responsible for grandchildrenHispanic or Latino 53 16.3% Responsible for grandchildren272 83.7% Not responsible for grandchildrenGrandparents (60 years and over) White / Caucasian 123 25.8% Responsible for grandchildren356 74.2% Not responsible for grandchildrenBlack or African American 12 23.1% Responsible for grandchildren40 76.9% Not responsible for grandchildrenAsian 80 8.3% Responsible for grandchildren884 91.7% Not responsible for grandchildrenOther race 8 25.0% Responsible for grandchildren24 75.0% Not responsible for grandchildrenWhite alone, not Hispanic / Latino 127 44.4% Responsible for grandchildren159 55.6% Not responsible for grandchildrenHispanic or Latino 16 4.2% Responsible for grandchildren359 95.8% Not responsible for grandchildren