Races in Clackamas, Oregon (OR) Detailed Stats
Ancestries, Foreign-born residents, place of birth

Recent posts about races in Clackamas, Oregon on our local forum with over 2,400,000 registered users:
 | Will house prices ever go down? (62 replies) |
| Redrawing Oregon Border (290 replies) |
| Multnomah to Washington/Clackamas: which neighborhoods are best value? (13 replies) |
| Planning on taking a trip to Oregon later this summer. Good idea? (33 replies) |
| Safe neighborhoods in Portland or any nearby suburbs (22 replies) |
| needing help finding rental house near Clackamas (2 replies) |
Latest news about races in Clackamas, OR collected exclusively by city-data.com from local newspapers, TV, and radio stations
9.4% of Clackamas, OR residents are foreign-born (4.3% born in Asia, 2.6% born in Europe, 1.4% born in Latin America, 1.1% born in North America), which is 4.1% greater than the foreign-born rate of 9.0% across the entire state of Oregon.
Race distribution in Clackamas

- 4,29783.0%White alone
- 3226.2%Asian alone
- 3085.9%Hispanic
- 1452.8%Two or more races
- 501.0%Black alone
- 310.6%American Indian alone
- 170.3%Native Hawaiian and Other
Pacific Islander alone - 70.1%Other race alone
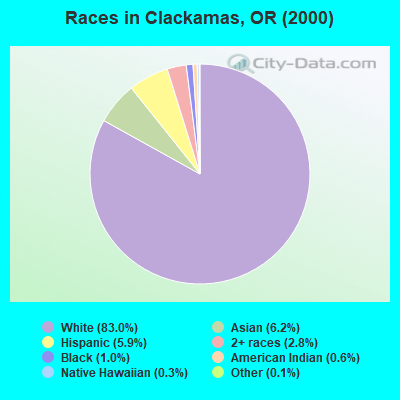
2000
2022
-
- 2,857,61683.5%White alone
- 275,3148.0%Hispanic
- 100,3332.9%Asian alone
- 82,7332.4%Two or more races
- 53,3251.6%Black alone
- 40,1301.2%American Indian alone
- 7,3980.2%Native Hawaiian and Other
Pacific Islander alone - 4,5500.1%Other race alone

-
- 3,037,57171.6%White alone
- 609,53814.4%Hispanic
- 252,7446.0%Two or more races
- 191,2834.5%Asian alone
- 78,2281.8%Black alone
- 29,3990.7%American Indian alone
- 25,7310.6%Other race alone
- 15,6430.4%Native Hawaiian and Other
Pacific Islander alone

Income and house value in Clackamas
- Median household income in 2022
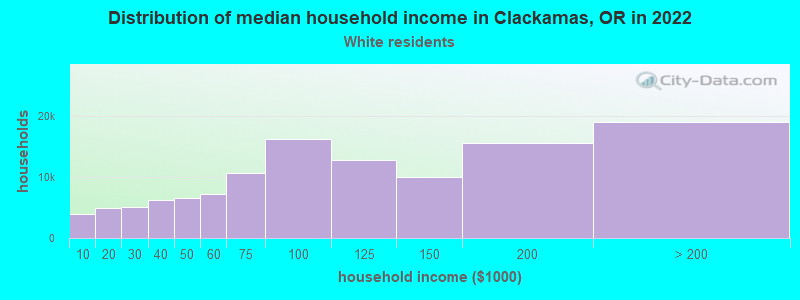
- $82,907White non-Hispanic householders
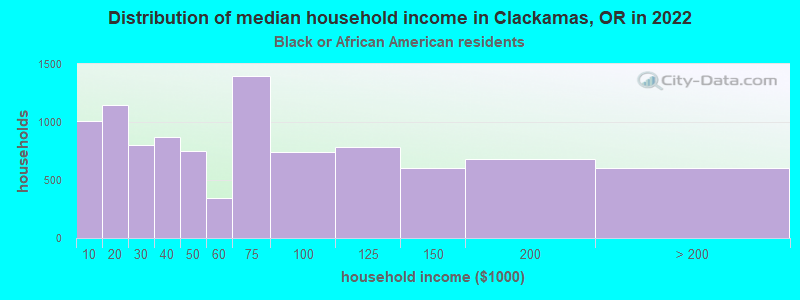
- $23,594Black householders
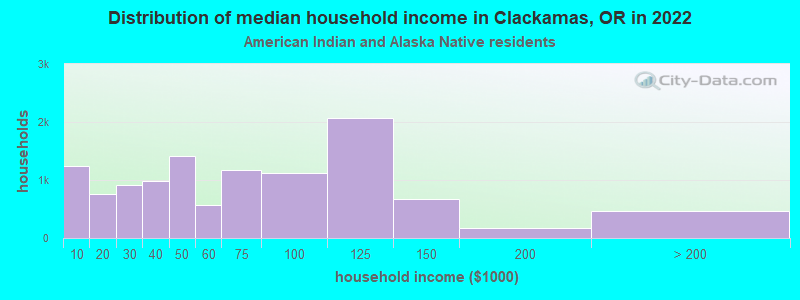
- $83,591American Indian and Alaska Native householders
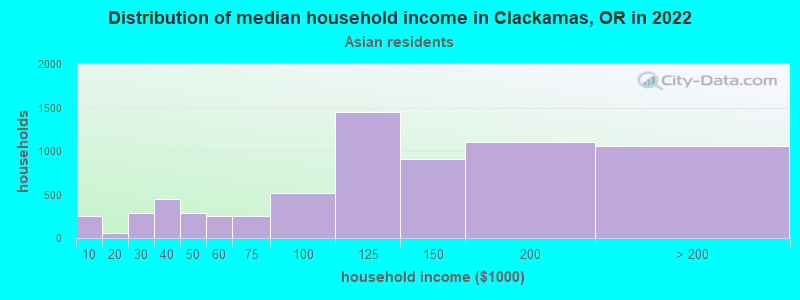
- $122,319Asian householders
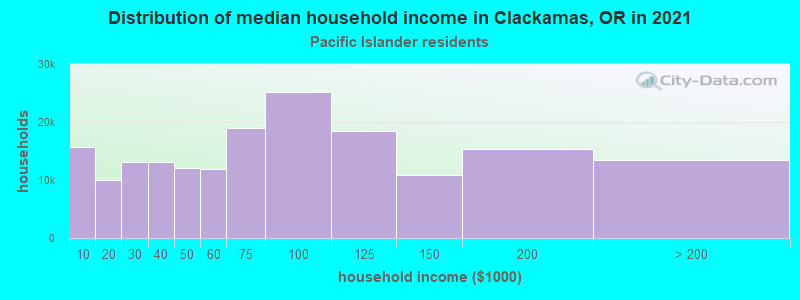
- $105,927Native Hawaiian and other Pacific Islander householders
- $55,763Some other race householders
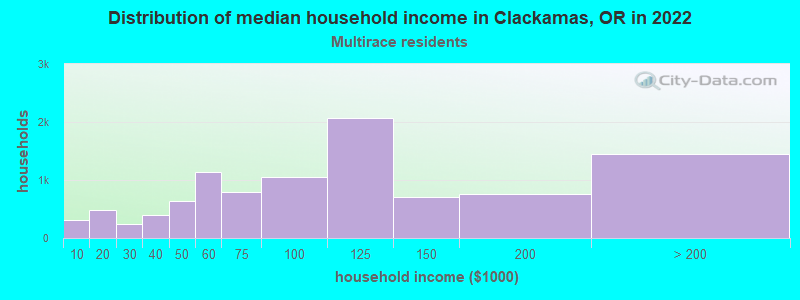
- $85,868Two or more races householders
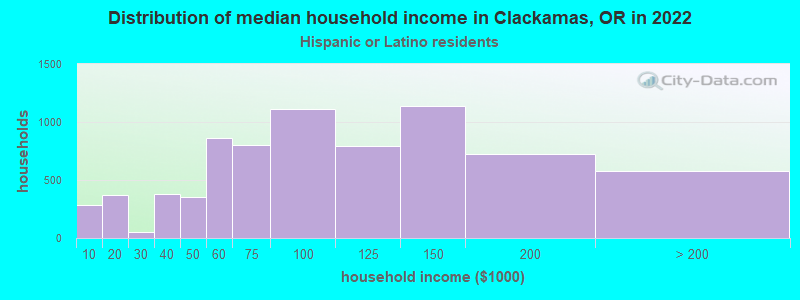
- $59,583Hispanic or Latino race householders
- Median 2022 house value
- $617,401White Non-Hispanic householders
- $982,013Black or African American householders
- $710,534Asian householders
- $300,939Native Hawaiian and other Pacific Islander householders
Household income for White non-Hispanic householders
Household income for Black householders
Household income for American Indian and Alaska Native householders
Household income for Asian householders
Household income for Native Hawaiian and other Pacific Islander householders
Household income for Two or more races householders
Household income for Hispanic or Latino race householders
Foreign-born residents in Clackamas
486 residents are foreign born (4.3% Asia, 2.6% Europe, 1.4% Latin America, 1.1% North America).
| This city: | 9.4% |
| Oregon: | 8.5% |
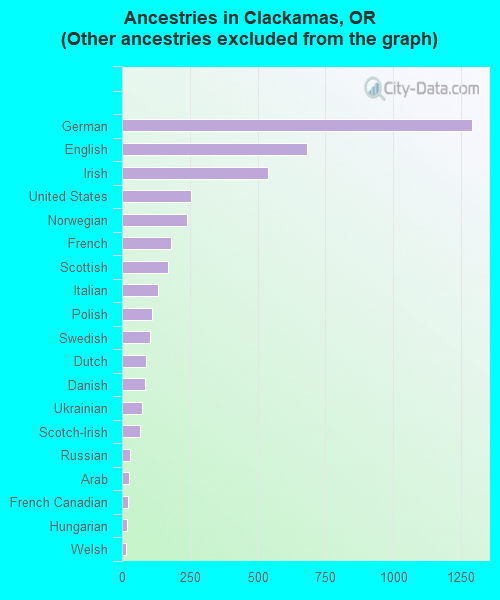
Ancestries in Clackamas

- 1,45625.9%Other
- 1,28923.0%German
- 68312.2%English
- 5399.6%Irish
- 2564.6%United States
- 2404.3%Norwegian
- 1813.2%French
- 1703.0%Scottish
- 1332.4%Italian
- 1122.0%Polish
- 1041.9%Swedish
- 901.6%Dutch
- 841.5%Danish
- 741.3%Ukrainian
- 651.2%Scotch-Irish
- 280.5%Russian
- 260.5%Arab
- 220.4%French Canadian
- 180.3%Hungarian
- 140.2%Welsh
- 80.1%Czech
- 80.1%Slovak
- 70.1%Portuguese
- 60.1%Lithuanian
Zip codes: 97015.