Races in Clemmons, North Carolina (NC) Detailed Stats
Data:
Races - White alone (%)
Races - White alone (% change since 2000)
Races - Black alone (%)
Races - Black alone (% change since 2000)
Races - American Indian alone (%)
Races - American Indian alone (% change since 2000)
Races - Asian alone (%)
Races - Asian alone (% change since 2000)
Races - Hispanic (%)
Races - Hispanic (% change since 2000)
Races - Native Hawaiian and Other Pacific Islander alone (%)
Races - Native Hawaiian and Other Pacific Islander alone (% change since 2000)
Races - Two or more races(%)
Races - Two or more races(% change since 2000)
Races - Other race alone (%)
Races - Other race alone (% change since 2000)
Racial diversity
Place of birth - Born in state of residence (%)
Place of birth - Born in state of residence (%) - White
Place of birth - Born in state of residence (%) - Black or African American
Place of birth - Born in state of residence (%) - Asian
Place of birth - Born in state of residence (%) - Hispanic or Latino
Place of birth - Born in state of residence (%) - American Indian and Alaska Native
Place of birth - Born in state of residence (%) - Multirace
Place of birth - Born in state of residence (%) - Other Race
Place of birth - Born in other state (%)
Place of birth - Born in other state (%) - White
Place of birth - Born in other state (%) - Black or African American
Place of birth - Born in other state (%) - Asian
Place of birth - Born in other state (%) - Hispanic or Latino
Place of birth - Born in other state (%) - American Indian and Alaska Native
Place of birth - Born in other state (%) - Multirace
Place of birth - Born in other state (%) - Other Race
Place of birth - Native, outside of US (%)
Place of birth - Native, outside of US (%) - White
Place of birth - Native, outside of US (%) - Black or African American
Place of birth - Native, outside of US (%) - Asian
Place of birth - Native, outside of US (%) - Hispanic or Latino
Place of birth - Native, outside of US (%) - American Indian and Alaska Native
Place of birth - Native, outside of US (%) - Multirace
Place of birth - Native, outside of US (%) - Other Race
Place of birth - Foreign born (%)
Place of birth - Foreign born (%) - White
Place of birth - Foreign born (%) - Black or African American
Place of birth - Foreign born (%) - Asian
Place of birth - Foreign born (%) - Hispanic or Latino
Place of birth - Foreign born (%) - American Indian and Alaska Native
Place of birth - Foreign born (%) - Multirace
Place of birth - Foreign born (%) - Other Race
Residents speaking English at home (%)
Residents speaking English at home - Born in the United States (%)
Residents speaking English at home - Native, born elsewhere (%)
Residents speaking English at home - Foreign born (%)
Residents speaking Spanish at home (%)
Residents speaking Spanish at home - Born in the United States (%)
Residents speaking Spanish at home - Native, born elsewhere (%)
Residents speaking Spanish at home - Foreign born (%)
Residents speaking other language at home (%)
Residents speaking other language at home - Born in the United States (%)
Residents speaking other language at home - Native, born elsewhere (%)
Residents speaking other language at home - Foreign born (%)
Marital status - Never married (%)
Marital status - Now married (%)
Marital status - Separated (%)
Marital status - Widowed (%)
Marital status - Divorced (%)
Ancestries Reported - Arab (%)
Ancestries Reported - Czech (%)
Ancestries Reported - Danish (%)
Ancestries Reported - Dutch (%)
Ancestries Reported - English (%)
Ancestries Reported - French (%)
Ancestries Reported - French Canadian (%)
Ancestries Reported - German (%)
Ancestries Reported - Greek (%)
Ancestries Reported - Hungarian (%)
Ancestries Reported - Irish (%)
Ancestries Reported - Italian (%)
Ancestries Reported - Lithuanian (%)
Ancestries Reported - Norwegian (%)
Ancestries Reported - Polish (%)
Ancestries Reported - Portuguese (%)
Ancestries Reported - Russian (%)
Ancestries Reported - Scotch-Irish (%)
Ancestries Reported - Scottish (%)
Ancestries Reported - Slovak (%)
Ancestries Reported - Subsaharan African (%)
Ancestries Reported - Swedish (%)
Ancestries Reported - Swiss (%)
Ancestries Reported - Ukrainian (%)
Ancestries Reported - United States (%)
Ancestries Reported - Welsh (%)
Ancestries Reported - West Indian (%)
Ancestries Reported - Other (%)
Geographical mobility - Same house 1 year ago (%)
Geographical mobility - Same house 1 year ago (%) - White
Geographical mobility - Same house 1 year ago (%) - Black or African American
Geographical mobility - Same house 1 year ago (%) - Asian
Geographical mobility - Same house 1 year ago (%) - Hispanic or Latino
Geographical mobility - Same house 1 year ago (%) - American Indian and Alaska Native
Geographical mobility - Same house 1 year ago (%) - Multirace
Geographical mobility - Same house 1 year ago (%) - Other Race
Geographical mobility - Moved within same county (%)
Geographical mobility - Moved within same county (%) - White
Geographical mobility - Moved within same county (%) - Black or African American
Geographical mobility - Moved within same county (%) - Asian
Geographical mobility - Moved within same county (%) - Hispanic or Latino
Geographical mobility - Moved within same county (%) - American Indian and Alaska Native
Geographical mobility - Moved within same county (%) - Multirace
Geographical mobility - Moved within same county (%) - Other Race
Geographical mobility - Moved from different county within same state (%)
Geographical mobility - Moved from different county within same state (%) - White
Geographical mobility - Moved from different county within same state (%) - Black or African American
Geographical mobility - Moved from different county within same state (%) - Asian
Geographical mobility - Moved from different county within same state (%) - Hispanic or Latino
Geographical mobility - Moved from different county within same state (%) - American Indian and Alaska Native
Geographical mobility - Moved from different county within same state (%) - Multirace
Geographical mobility - Moved from different county within same state (%) - Other Race
Geographical mobility - Moved from different state (%)
Geographical mobility - Moved from different state (%) - White
Geographical mobility - Moved from different state (%) - Black or African American
Geographical mobility - Moved from different state (%) - Asian
Geographical mobility - Moved from different state (%) - Hispanic or Latino
Geographical mobility - Moved from different state (%) - American Indian and Alaska Native
Geographical mobility - Moved from different state (%) - Multirace
Geographical mobility - Moved from different state (%) - Other Race
Geographical mobility - Moved from abroad (%)
Geographical mobility - Moved from abroad (%) - White
Geographical mobility - Moved from abroad (%) - Black or African American
Geographical mobility - Moved from abroad (%) - Asian
Geographical mobility - Moved from abroad (%) - Hispanic or Latino
Geographical mobility - Moved from abroad (%) - American Indian and Alaska Native
Geographical mobility - Moved from abroad (%) - Multirace
Geographical mobility - Moved from abroad (%) - Other Race
Place of birth for the foreign-born population - Ireland (%)
Place of birth for the foreign-born population - Denmark (%)
Place of birth for the foreign-born population - Norway (%)
Place of birth for the foreign-born population - Sweden (%)
Place of birth for the foreign-born population - United Kingdom (%)
Place of birth for the foreign-born population - England (%)
Place of birth for the foreign-born population - Scotland (%)
Place of birth for the foreign-born population - Other Northern Europe (%)
Place of birth for the foreign-born population - Austria (%)
Place of birth for the foreign-born population - Belgium (%)
Place of birth for the foreign-born population - France (%)
Place of birth for the foreign-born population - Germany (%)
Place of birth for the foreign-born population - Netherlands (%)
Place of birth for the foreign-born population - Switzerland (%)
Place of birth for the foreign-born population - Other Western Europe (%)
Place of birth for the foreign-born population - Greece (%)
Place of birth for the foreign-born population - Italy (%)
Place of birth for the foreign-born population - Portugal (%)
Place of birth for the foreign-born population - Spain (%)
Place of birth for the foreign-born population - Other Southern Europe (%)
Place of birth for the foreign-born population - Albania (%)
Place of birth for the foreign-born population - Belarus (%)
Place of birth for the foreign-born population - Bosnia and Herzegovina (%)
Place of birth for the foreign-born population - Bulgaria (%)
Place of birth for the foreign-born population - Croatia (%)
Place of birth for the foreign-born population - Czechoslovakia (%)
Place of birth for the foreign-born population - Hungary (%)
Place of birth for the foreign-born population - Latvia (%)
Place of birth for the foreign-born population - Lithuania (%)
Place of birth for the foreign-born population - North Macedonia (Macedonia) (%)
Place of birth for the foreign-born population - Moldova (%)
Place of birth for the foreign-born population - Poland (%)
Place of birth for the foreign-born population - Romania (%)
Place of birth for the foreign-born population - Russia (%)
Place of birth for the foreign-born population - Serbia (%)
Place of birth for the foreign-born population - Ukraine (%)
Place of birth for the foreign-born population - Other Eastern Europe (%)
Place of birth for the foreign-born population - China (%)
Place of birth for the foreign-born population - Hong Kong (%)
Place of birth for the foreign-born population - Taiwan (%)
Place of birth for the foreign-born population - Japan (%)
Place of birth for the foreign-born population - Korea (%)
Place of birth for the foreign-born population - Other Eastern Asia (%)
Place of birth for the foreign-born population - Afghanistan (%)
Place of birth for the foreign-born population - Bangladesh (%)
Place of birth for the foreign-born population - India (%)
Place of birth for the foreign-born population - Iran (%)
Place of birth for the foreign-born population - Kazakhstan (%)
Place of birth for the foreign-born population - Nepal (%)
Place of birth for the foreign-born population - Pakistan (%)
Place of birth for the foreign-born population - Sri Lanka (%)
Place of birth for the foreign-born population - Uzbekistan (%)
Place of birth for the foreign-born population - Other South Central Asia (%)
Place of birth for the foreign-born population - Burma (%)
Place of birth for the foreign-born population - Cambodia (%)
Place of birth for the foreign-born population - Indonesia (%)
Place of birth for the foreign-born population - Laos (%)
Place of birth for the foreign-born population - Malaysia (%)
Place of birth for the foreign-born population - Philippines (%)
Place of birth for the foreign-born population - Singapore (%)
Place of birth for the foreign-born population - Thailand (%)
Place of birth for the foreign-born population - Vietnam (%)
Place of birth for the foreign-born population - Other South Eastern Asia (%)
Place of birth for the foreign-born population - Armenia (%)
Place of birth for the foreign-born population - Iraq (%)
Place of birth for the foreign-born population - Israel (%)
Place of birth for the foreign-born population - Jordan (%)
Place of birth for the foreign-born population - Kuwait (%)
Place of birth for the foreign-born population - Lebanon (%)
Place of birth for the foreign-born population - Saudi Arabia (%)
Place of birth for the foreign-born population - Syria (%)
Place of birth for the foreign-born population - Turkey (%)
Place of birth for the foreign-born population - Yemen (%)
Place of birth for the foreign-born population - Other Western Asia (%)
Place of birth for the foreign-born population - Eritrea (%)
Place of birth for the foreign-born population - Ethiopia (%)
Place of birth for the foreign-born population - Kenya (%)
Place of birth for the foreign-born population - Somalia (%)
Place of birth for the foreign-born population - Uganda (%)
Place of birth for the foreign-born population - Zimbabwe (%)
Place of birth for the foreign-born population - Other Eastern Africa (%)
Place of birth for the foreign-born population - Cameroon (%)
Place of birth for the foreign-born population - Congo (%)
Place of birth for the foreign-born population - Democratic Republic of Congo (Zaire) (%)
Place of birth for the foreign-born population - Other Middle Africa (%)
Place of birth for the foreign-born population - Egypt (%)
Place of birth for the foreign-born population - Morocco (%)
Place of birth for the foreign-born population - Sudan (%)
Place of birth for the foreign-born population - Other Northern Africa (%)
Place of birth for the foreign-born population - South Africa (%)
Place of birth for the foreign-born population - Other Southern Africa (%)
Place of birth for the foreign-born population - Cabo Verde (%)
Place of birth for the foreign-born population - Ghana (%)
Place of birth for the foreign-born population - Liberia (%)
Place of birth for the foreign-born population - Nigeria (%)
Place of birth for the foreign-born population - Senegal (%)
Place of birth for the foreign-born population - Sierra Leone (%)
Place of birth for the foreign-born population - Other Western Africa (%)
Place of birth for the foreign-born population - Australia (%)
Place of birth for the foreign-born population - New Zealand (%)
Place of birth for the foreign-born population - Fiji (%)
Place of birth for the foreign-born population - Micronesia (%)
Place of birth for the foreign-born population - Bahamas (%)
Place of birth for the foreign-born population - Barbados (%)
Place of birth for the foreign-born population - Cuba (%)
Place of birth for the foreign-born population - Dominica (%)
Place of birth for the foreign-born population - Dominican Republic (%)
Place of birth for the foreign-born population - Grenada (%)
Place of birth for the foreign-born population - Haiti (%)
Place of birth for the foreign-born population - Jamaica (%)
Place of birth for the foreign-born population - St. Vincent and the Grenadines (%)
Place of birth for the foreign-born population - Trinidad and Tobago (%)
Place of birth for the foreign-born population - West Indies (%)
Place of birth for the foreign-born population - Other Caribbean (%)
Place of birth for the foreign-born population - Belize (%)
Place of birth for the foreign-born population - Costa Rica (%)
Place of birth for the foreign-born population - El Salvador (%)
Place of birth for the foreign-born population - Guatemala (%)
Place of birth for the foreign-born population - Honduras (%)
Place of birth for the foreign-born population - Mexico (%)
Place of birth for the foreign-born population - Nicaragua (%)
Place of birth for the foreign-born population - Panama (%)
Place of birth for the foreign-born population - Other Central America (%)
Place of birth for the foreign-born population - Argentina (%)
Place of birth for the foreign-born population - Bolivia (%)
Place of birth for the foreign-born population - Brazil (%)
Place of birth for the foreign-born population - Chile (%)
Place of birth for the foreign-born population - Colombia (%)
Place of birth for the foreign-born population - Ecuador (%)
Place of birth for the foreign-born population - Guyana (%)
Place of birth for the foreign-born population - Peru (%)
Place of birth for the foreign-born population - Uruguay (%)
Place of birth for the foreign-born population - Venezuela (%)
Place of birth for the foreign-born population - Other South America (%)
Place of birth for the foreign-born population - Canada (%)
Place of birth for the foreign-born population - Other Northern America (%)
Place of birth for the foreign-born population - Other (%)
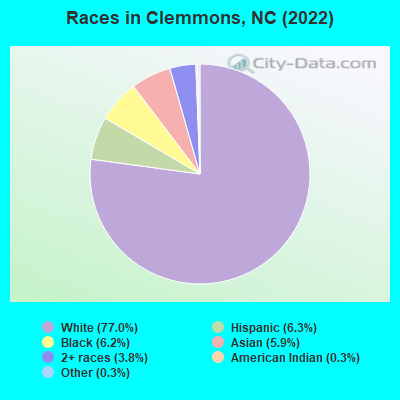
According to 2022 data, the most numerous races in Clemmons, NC are White alone (16,615 residents), Black alone (1,329 residents), and Hispanic (1,352 residents). 86.7% of Clemmons residents speak English at home. 9.7% of Clemmons, NC residents are foreign-born (4.1% born in Asia, 2.6% born in Latin America, 1.9% born in Europe), which is 17.3% greater than the foreign-born rate of 8.0% across the entire state of North Carolina.
Race distribution in Clemmons
2000 2022
5,647,155 70.2% White alone 1,723,301 21.4% Black alone 378,963 4.7% Hispanic 112,416 1.4% Asian alone 95,333 1.2% American Indian alone 79,965 1.0% Two or more races 9,015 0.1% Other race alone 3,165 0.04% Native Hawaiian and Other
6,497,519 60.7% White alone 2,155,650 20.1% Black alone 1,114,799 10.4% Hispanic 438,061 4.1% Two or more races 341,052 3.2% Asian alone 91,758 0.9% American Indian alone 50,180 0.5% Other race alone 9,954 0.09% Native Hawaiian and Other
Income and house value in Clemmons Median household income in 2022 $90,466 White non-Hispanic householders$42,514 Black householders$61,253 Asian householders$63,212 Two or more races householdersMedian 2022 house value $365,129 White Non-Hispanic householders$418,174 Black or African American householders $367,339 Asian householders$607,811 Some other race householders$209,971 Two or more races householders$317,830 Hispanic or Latino householders
Median age by race in Clemmons
48.8 Median age for White residents43.7 50.7 43.4 Median age for Black or African American residents33.9 53.3 52.5 Median age for American Indian / Alaska Native residents62.9 21.9 34.9 Median age for Asian residents25.0 39.0 -1,306,122,447.7 Median age for Native Hawaiian / Pacific Islander residents-611,708,482.1 -1,166,666,665.5 35.5 Median age for Other race residents38.4 24.2 18.8 Median age for Two or more races residents11.6 29.2 47.6 Median age for White alone residents42.3 49.2 26.6 Median age for Hispanic or Latino residents17.3 32.3
Owner/renter occupied households by race in Clemmons
House owners and renters - White residents 5,358 75.8% Owner occupied1,714 24.2% Renter occupiedHouse owners and renters - Black or African American residents 494 62.1% Owner occupied302 37.9% Renter occupiedHouse owners and renters - American Indian / Alaska Native residents 38 58.6% Owner occupied27 41.4% Renter occupiedHouse owners and renters - Asian residents 270 96.0% Owner occupied11 4.0% Renter occupiedHouse owners and renters - Other race residents 34 24.8% Owner occupied102 75.2% Renter occupiedHouse owners and renters - Two or more races residents 229 46.8% Owner occupied260 53.2% Renter occupiedHouse owners and renters - White alone residents 5,452 75.6% Owner occupied1,759 24.4% Renter occupiedHouse owners and renters - Hispanic or Latino residents 224 59.8% Owner occupied150 40.2% Renter occupied
Language usage in Clemmons
English speakers - Total 86.7% of residents of Clemmons speak English at home.
4.5% of residents speak Spanish at home 680 73.6% Speak English very well244 26.4% Speak English less than very well8.6% of residents speak other language at home 1,285 72.6% Speak English very well484 27.4% Speak English less than very well
English speakers - Born in the United States 95.6% of residents of Clemmons speak English at home.
0.8% of residents speak Spanish at home 70 100.0% Speak English very well4.8% of residents speak other language at home 285 68.2% Speak English very well133 31.8% Speak English less than very well
English speakers - Native, born elsewhere 52.9% of residents of Clemmons speak English at home.
11.3% of residents speak Spanish at home 23 100.0% Speak English less than very well22.5% of residents speak other language at home 14 30.4% Speak English very well32 69.6% Speak English less than very well
English speakers - Foreign-born 21.1% of residents of Clemmons speak English at home.
24.9% of residents speak Spanish at home 279 55.6% Speak English very well223 44.4% Speak English less than very well52.1% of residents speak other language at home 741 70.5% Speak English very well310 29.5% Speak English less than very well
White (Caucasian) - Speak only English Native:
99.0% (15,084)Foreign-born:
67.3% (225)
White (Caucasian) - Speak another language Native:
1.9% (288)Foreign-born:
78.1% (261)
Black or African American - Speak another language Native:
3.2% (42)Foreign-born:
100.0% (45)
American Indian / Alaska Native - Speak another language Native:
23.6% (15)Foreign-born:
100.0% (240)
Asian - Speak only English Native:
18.5% (63)Foreign-born:
31.9% (291)
Asian - Speak another language Native:
73.1% (249)Foreign-born:
73.2% (668)
Other race - Speak only English Native:
50.7% (93)Foreign-born:
5.5% (4)
Other race - Speak another language Native:
24.1% (44)Foreign-born:
92.8% (75)
Two or more races - Speak only English Native:
82.1% (821)Foreign-born:
4.6% (13)
Two or more races - Speak another language Native:
11.6% (116)Foreign-born:
95.5% (272)
White alone - Speak only English Native:
97.6% (15,091)Foreign-born:
48.6% (241)
White alone - Speak another language Native:
2.3% (361)Foreign-born:
49.3% (245)
Hispanic or Latino - Speak only English Native:
56.1% (407)Foreign-born:
3.9% (21)
Hispanic or Latino - Speak another language Native:
42.2% (306)Foreign-born:
95.7% (520)
Foreign-born residents in Clemmons 2,088 residents are foreign born (4.1% Asia , 2.6% Latin America , 1.9% Europe ).
This city:
9.7%North Carolina:
8.3%
Marital status for residents in Clemmons Marital status - White (Caucasian) population 15 years and over
Males 26.3% Never married61.9% Now married1.6% Separated2.1% Widowed8.1% DivorcedFemales 18.7% Never married56.4% Now married1.9% Separated9.8% Widowed13.2% DivorcedWomen who gave birth in the past 12 months Now married:
66.0% (91)Unmarried:
34.0% (47)
Women who did not give birth in the past 12 months Now married:
55.0% (1,578)Unmarried:
45.0% (1,290)
Marital status - Black or African American population 15 years and over
Males 53.2% Never married41.4% Now married0.2% Separated1.7% Widowed3.6% DivorcedFemales 40.3% Never married22.9% Now married0.0% Separated4.6% Widowed32.2% DivorcedWomen who gave birth in the past 12 months Now married:
0.0% (0)Unmarried:
100.0% (8)
Women who did not give birth in the past 12 months Now married:
12.6% (39)Unmarried:
87.4% (272)
Marital status - American Indian / Alaska Native population 15 years and over
Males 21.1% Never married78.9% Now married0.0% Separated0.0% Widowed0.0% DivorcedFemales 56.1% Never married26.4% Now married0.0% Separated0.0% Widowed17.6% DivorcedWomen who did not give birth in the past 12 months Now married:
34.2% (41)Unmarried:
65.8% (79)
Marital status - Asian population 15 years and over
Males 41.1% Never married58.9% Now married0.0% Separated0.0% Widowed0.0% DivorcedFemales 27.0% Never married58.3% Now married0.0% Separated10.4% Widowed4.3% DivorcedWomen who did not give birth in the past 12 months Now married:
55.3% (226)Unmarried:
44.7% (182)
Marital status - Other race population 15 years and over
Males 0.0% Never married34.6% Now married0.0% Separated0.0% Widowed65.4% DivorcedFemales 32.8% Never married67.2% Now married0.0% Separated0.0% Widowed0.0% DivorcedWomen who did not give birth in the past 12 months Now married:
59.3% (53)Unmarried:
40.7% (36)
Marital status - Two or more races population 15 years and over
Males 24.6% Never married53.1% Now married0.0% Separated0.0% Widowed22.3% DivorcedFemales 51.3% Never married32.1% Now married0.0% Separated7.4% Widowed9.3% DivorcedWomen who did not give birth in the past 12 months Now married:
24.2% (97)Unmarried:
75.8% (303)
Marital status - White alone, not Hispanic / Latino population 15 years and over
Males 26.2% Never married61.8% Now married1.6% Separated2.1% Widowed8.2% DivorcedFemales 18.5% Never married56.1% Now married2.0% Separated10.1% Widowed13.4% DivorcedWomen who gave birth in the past 12 months Now married:
62.5% (84)Unmarried:
37.5% (50)
Women who did not give birth in the past 12 months Now married:
55.0% (1,629)Unmarried:
45.0% (1,332)
Marital status - Hispanic or Latino population 15 years and over
Males 21.8% Never married78.2% Now married0.0% Separated0.0% Widowed0.0% DivorcedFemales 33.1% Never married51.3% Now married0.0% Separated5.0% Widowed10.6% DivorcedWomen who gave birth in the past 12 months Now married:
100.0% (15)Unmarried:
0.0% (0)
Women who did not give birth in the past 12 months Now married:
46.5% (231)Unmarried:
53.5% (266)
Ancestries in Clemmons
2,088 20.2% English1,219 11.8% German1,028 10.0% American460 4.5% Irish459 4.4% Italian320 3.1% Scottish222 2.1% European183 1.8% Polish133 1.3% Scotch-Irish85 0.8% Greek81 0.8% Albanian67 0.6% Norwegian57 0.6% Dutch54 0.5% Egyptian50 0.5% Canadian49 0.5% French46 0.4% Welsh44 0.4% British44 0.4% Swedish33 0.3% Russian32 0.3% French Canadian28 0.3% Czechoslovakian25 0.2% Danish25 0.2% Ukrainian22 0.2% Estonian19 0.2% Arab17 0.2% Eastern European11 0.1% Yugoslavian10 0.10% Haitian8 0.08% Northern European7 0.07% Swiss
Children Nativity (place of birth) in Clemmons
Children under 6 years - Living with two parents Both parents native 851 100.0% Native0 0.0% Foreign-bornBoth parents foreign-born 54 54.5% Native45 45.5% Foreign-bornOne native, one foreign-born parent 49 100.0% NativeChildren under 6 years - Living with one parent Native parent 388 100.0% NativeForeign-born parent 14 100.0% NativeChildren 6 to 17 years - Living with two parents Both parents native 1,496 98.4% Native25 1.6% Foreign-bornBoth parents foreign-born 353 78.1% Native99 21.9% Foreign-bornOne native, one foreign-born parent 198 100.0% NativeChildren 6 to 17 years - Living with one parent Native parent 711 100.0% NativeForeign-born parent 208 55.0% Native170 45.0% Foreign-born
Grandparents responsible for own grandchildren in Clemmons
Grandparents (30 to 59 years) White / Caucasian 8 15.1% Responsible for grandchildren47 84.9% Not responsible for grandchildrenBlack or African American 53 100.0% Responsible for grandchildrenWhite alone, not Hispanic / Latino 11 18.2% Responsible for grandchildren48 81.8% Not responsible for grandchildren
Grandparents (60 years and over) White / Caucasian 82 100.0% Not responsible for grandchildrenBlack or African American 14 100.0% Not responsible for grandchildrenWhite alone, not Hispanic / Latino 77 100.0% Not responsible for grandchildren