Races in Commerce City, Colorado (CO) Detailed Stats
Data:
Races - White alone (%)
Races - White alone (% change since 2000)
Races - Black alone (%)
Races - Black alone (% change since 2000)
Races - American Indian alone (%)
Races - American Indian alone (% change since 2000)
Races - Asian alone (%)
Races - Asian alone (% change since 2000)
Races - Hispanic (%)
Races - Hispanic (% change since 2000)
Races - Native Hawaiian and Other Pacific Islander alone (%)
Races - Native Hawaiian and Other Pacific Islander alone (% change since 2000)
Races - Two or more races(%)
Races - Two or more races(% change since 2000)
Races - Other race alone (%)
Races - Other race alone (% change since 2000)
Racial diversity
Place of birth - Born in state of residence (%)
Place of birth - Born in state of residence (%) - White
Place of birth - Born in state of residence (%) - Black or African American
Place of birth - Born in state of residence (%) - Asian
Place of birth - Born in state of residence (%) - Hispanic or Latino
Place of birth - Born in state of residence (%) - American Indian and Alaska Native
Place of birth - Born in state of residence (%) - Multirace
Place of birth - Born in state of residence (%) - Other Race
Place of birth - Born in other state (%)
Place of birth - Born in other state (%) - White
Place of birth - Born in other state (%) - Black or African American
Place of birth - Born in other state (%) - Asian
Place of birth - Born in other state (%) - Hispanic or Latino
Place of birth - Born in other state (%) - American Indian and Alaska Native
Place of birth - Born in other state (%) - Multirace
Place of birth - Born in other state (%) - Other Race
Place of birth - Native, outside of US (%)
Place of birth - Native, outside of US (%) - White
Place of birth - Native, outside of US (%) - Black or African American
Place of birth - Native, outside of US (%) - Asian
Place of birth - Native, outside of US (%) - Hispanic or Latino
Place of birth - Native, outside of US (%) - American Indian and Alaska Native
Place of birth - Native, outside of US (%) - Multirace
Place of birth - Native, outside of US (%) - Other Race
Place of birth - Foreign born (%)
Place of birth - Foreign born (%) - White
Place of birth - Foreign born (%) - Black or African American
Place of birth - Foreign born (%) - Asian
Place of birth - Foreign born (%) - Hispanic or Latino
Place of birth - Foreign born (%) - American Indian and Alaska Native
Place of birth - Foreign born (%) - Multirace
Place of birth - Foreign born (%) - Other Race
Residents speaking English at home (%)
Residents speaking English at home - Born in the United States (%)
Residents speaking English at home - Native, born elsewhere (%)
Residents speaking English at home - Foreign born (%)
Residents speaking Spanish at home (%)
Residents speaking Spanish at home - Born in the United States (%)
Residents speaking Spanish at home - Native, born elsewhere (%)
Residents speaking Spanish at home - Foreign born (%)
Residents speaking other language at home (%)
Residents speaking other language at home - Born in the United States (%)
Residents speaking other language at home - Native, born elsewhere (%)
Residents speaking other language at home - Foreign born (%)
Marital status - Never married (%)
Marital status - Now married (%)
Marital status - Separated (%)
Marital status - Widowed (%)
Marital status - Divorced (%)
Ancestries Reported - Arab (%)
Ancestries Reported - Czech (%)
Ancestries Reported - Danish (%)
Ancestries Reported - Dutch (%)
Ancestries Reported - English (%)
Ancestries Reported - French (%)
Ancestries Reported - French Canadian (%)
Ancestries Reported - German (%)
Ancestries Reported - Greek (%)
Ancestries Reported - Hungarian (%)
Ancestries Reported - Irish (%)
Ancestries Reported - Italian (%)
Ancestries Reported - Lithuanian (%)
Ancestries Reported - Norwegian (%)
Ancestries Reported - Polish (%)
Ancestries Reported - Portuguese (%)
Ancestries Reported - Russian (%)
Ancestries Reported - Scotch-Irish (%)
Ancestries Reported - Scottish (%)
Ancestries Reported - Slovak (%)
Ancestries Reported - Subsaharan African (%)
Ancestries Reported - Swedish (%)
Ancestries Reported - Swiss (%)
Ancestries Reported - Ukrainian (%)
Ancestries Reported - United States (%)
Ancestries Reported - Welsh (%)
Ancestries Reported - West Indian (%)
Ancestries Reported - Other (%)
Geographical mobility - Same house 1 year ago (%)
Geographical mobility - Same house 1 year ago (%) - White
Geographical mobility - Same house 1 year ago (%) - Black or African American
Geographical mobility - Same house 1 year ago (%) - Asian
Geographical mobility - Same house 1 year ago (%) - Hispanic or Latino
Geographical mobility - Same house 1 year ago (%) - American Indian and Alaska Native
Geographical mobility - Same house 1 year ago (%) - Multirace
Geographical mobility - Same house 1 year ago (%) - Other Race
Geographical mobility - Moved within same county (%)
Geographical mobility - Moved within same county (%) - White
Geographical mobility - Moved within same county (%) - Black or African American
Geographical mobility - Moved within same county (%) - Asian
Geographical mobility - Moved within same county (%) - Hispanic or Latino
Geographical mobility - Moved within same county (%) - American Indian and Alaska Native
Geographical mobility - Moved within same county (%) - Multirace
Geographical mobility - Moved within same county (%) - Other Race
Geographical mobility - Moved from different county within same state (%)
Geographical mobility - Moved from different county within same state (%) - White
Geographical mobility - Moved from different county within same state (%) - Black or African American
Geographical mobility - Moved from different county within same state (%) - Asian
Geographical mobility - Moved from different county within same state (%) - Hispanic or Latino
Geographical mobility - Moved from different county within same state (%) - American Indian and Alaska Native
Geographical mobility - Moved from different county within same state (%) - Multirace
Geographical mobility - Moved from different county within same state (%) - Other Race
Geographical mobility - Moved from different state (%)
Geographical mobility - Moved from different state (%) - White
Geographical mobility - Moved from different state (%) - Black or African American
Geographical mobility - Moved from different state (%) - Asian
Geographical mobility - Moved from different state (%) - Hispanic or Latino
Geographical mobility - Moved from different state (%) - American Indian and Alaska Native
Geographical mobility - Moved from different state (%) - Multirace
Geographical mobility - Moved from different state (%) - Other Race
Geographical mobility - Moved from abroad (%)
Geographical mobility - Moved from abroad (%) - White
Geographical mobility - Moved from abroad (%) - Black or African American
Geographical mobility - Moved from abroad (%) - Asian
Geographical mobility - Moved from abroad (%) - Hispanic or Latino
Geographical mobility - Moved from abroad (%) - American Indian and Alaska Native
Geographical mobility - Moved from abroad (%) - Multirace
Geographical mobility - Moved from abroad (%) - Other Race
Place of birth for the foreign-born population - Ireland (%)
Place of birth for the foreign-born population - Denmark (%)
Place of birth for the foreign-born population - Norway (%)
Place of birth for the foreign-born population - Sweden (%)
Place of birth for the foreign-born population - United Kingdom (%)
Place of birth for the foreign-born population - England (%)
Place of birth for the foreign-born population - Scotland (%)
Place of birth for the foreign-born population - Other Northern Europe (%)
Place of birth for the foreign-born population - Austria (%)
Place of birth for the foreign-born population - Belgium (%)
Place of birth for the foreign-born population - France (%)
Place of birth for the foreign-born population - Germany (%)
Place of birth for the foreign-born population - Netherlands (%)
Place of birth for the foreign-born population - Switzerland (%)
Place of birth for the foreign-born population - Other Western Europe (%)
Place of birth for the foreign-born population - Greece (%)
Place of birth for the foreign-born population - Italy (%)
Place of birth for the foreign-born population - Portugal (%)
Place of birth for the foreign-born population - Spain (%)
Place of birth for the foreign-born population - Other Southern Europe (%)
Place of birth for the foreign-born population - Albania (%)
Place of birth for the foreign-born population - Belarus (%)
Place of birth for the foreign-born population - Bosnia and Herzegovina (%)
Place of birth for the foreign-born population - Bulgaria (%)
Place of birth for the foreign-born population - Croatia (%)
Place of birth for the foreign-born population - Czechoslovakia (%)
Place of birth for the foreign-born population - Hungary (%)
Place of birth for the foreign-born population - Latvia (%)
Place of birth for the foreign-born population - Lithuania (%)
Place of birth for the foreign-born population - North Macedonia (Macedonia) (%)
Place of birth for the foreign-born population - Moldova (%)
Place of birth for the foreign-born population - Poland (%)
Place of birth for the foreign-born population - Romania (%)
Place of birth for the foreign-born population - Russia (%)
Place of birth for the foreign-born population - Serbia (%)
Place of birth for the foreign-born population - Ukraine (%)
Place of birth for the foreign-born population - Other Eastern Europe (%)
Place of birth for the foreign-born population - China (%)
Place of birth for the foreign-born population - Hong Kong (%)
Place of birth for the foreign-born population - Taiwan (%)
Place of birth for the foreign-born population - Japan (%)
Place of birth for the foreign-born population - Korea (%)
Place of birth for the foreign-born population - Other Eastern Asia (%)
Place of birth for the foreign-born population - Afghanistan (%)
Place of birth for the foreign-born population - Bangladesh (%)
Place of birth for the foreign-born population - India (%)
Place of birth for the foreign-born population - Iran (%)
Place of birth for the foreign-born population - Kazakhstan (%)
Place of birth for the foreign-born population - Nepal (%)
Place of birth for the foreign-born population - Pakistan (%)
Place of birth for the foreign-born population - Sri Lanka (%)
Place of birth for the foreign-born population - Uzbekistan (%)
Place of birth for the foreign-born population - Other South Central Asia (%)
Place of birth for the foreign-born population - Burma (%)
Place of birth for the foreign-born population - Cambodia (%)
Place of birth for the foreign-born population - Indonesia (%)
Place of birth for the foreign-born population - Laos (%)
Place of birth for the foreign-born population - Malaysia (%)
Place of birth for the foreign-born population - Philippines (%)
Place of birth for the foreign-born population - Singapore (%)
Place of birth for the foreign-born population - Thailand (%)
Place of birth for the foreign-born population - Vietnam (%)
Place of birth for the foreign-born population - Other South Eastern Asia (%)
Place of birth for the foreign-born population - Armenia (%)
Place of birth for the foreign-born population - Iraq (%)
Place of birth for the foreign-born population - Israel (%)
Place of birth for the foreign-born population - Jordan (%)
Place of birth for the foreign-born population - Kuwait (%)
Place of birth for the foreign-born population - Lebanon (%)
Place of birth for the foreign-born population - Saudi Arabia (%)
Place of birth for the foreign-born population - Syria (%)
Place of birth for the foreign-born population - Turkey (%)
Place of birth for the foreign-born population - Yemen (%)
Place of birth for the foreign-born population - Other Western Asia (%)
Place of birth for the foreign-born population - Eritrea (%)
Place of birth for the foreign-born population - Ethiopia (%)
Place of birth for the foreign-born population - Kenya (%)
Place of birth for the foreign-born population - Somalia (%)
Place of birth for the foreign-born population - Uganda (%)
Place of birth for the foreign-born population - Zimbabwe (%)
Place of birth for the foreign-born population - Other Eastern Africa (%)
Place of birth for the foreign-born population - Cameroon (%)
Place of birth for the foreign-born population - Congo (%)
Place of birth for the foreign-born population - Democratic Republic of Congo (Zaire) (%)
Place of birth for the foreign-born population - Other Middle Africa (%)
Place of birth for the foreign-born population - Egypt (%)
Place of birth for the foreign-born population - Morocco (%)
Place of birth for the foreign-born population - Sudan (%)
Place of birth for the foreign-born population - Other Northern Africa (%)
Place of birth for the foreign-born population - South Africa (%)
Place of birth for the foreign-born population - Other Southern Africa (%)
Place of birth for the foreign-born population - Cabo Verde (%)
Place of birth for the foreign-born population - Ghana (%)
Place of birth for the foreign-born population - Liberia (%)
Place of birth for the foreign-born population - Nigeria (%)
Place of birth for the foreign-born population - Senegal (%)
Place of birth for the foreign-born population - Sierra Leone (%)
Place of birth for the foreign-born population - Other Western Africa (%)
Place of birth for the foreign-born population - Australia (%)
Place of birth for the foreign-born population - New Zealand (%)
Place of birth for the foreign-born population - Fiji (%)
Place of birth for the foreign-born population - Micronesia (%)
Place of birth for the foreign-born population - Bahamas (%)
Place of birth for the foreign-born population - Barbados (%)
Place of birth for the foreign-born population - Cuba (%)
Place of birth for the foreign-born population - Dominica (%)
Place of birth for the foreign-born population - Dominican Republic (%)
Place of birth for the foreign-born population - Grenada (%)
Place of birth for the foreign-born population - Haiti (%)
Place of birth for the foreign-born population - Jamaica (%)
Place of birth for the foreign-born population - St. Vincent and the Grenadines (%)
Place of birth for the foreign-born population - Trinidad and Tobago (%)
Place of birth for the foreign-born population - West Indies (%)
Place of birth for the foreign-born population - Other Caribbean (%)
Place of birth for the foreign-born population - Belize (%)
Place of birth for the foreign-born population - Costa Rica (%)
Place of birth for the foreign-born population - El Salvador (%)
Place of birth for the foreign-born population - Guatemala (%)
Place of birth for the foreign-born population - Honduras (%)
Place of birth for the foreign-born population - Mexico (%)
Place of birth for the foreign-born population - Nicaragua (%)
Place of birth for the foreign-born population - Panama (%)
Place of birth for the foreign-born population - Other Central America (%)
Place of birth for the foreign-born population - Argentina (%)
Place of birth for the foreign-born population - Bolivia (%)
Place of birth for the foreign-born population - Brazil (%)
Place of birth for the foreign-born population - Chile (%)
Place of birth for the foreign-born population - Colombia (%)
Place of birth for the foreign-born population - Ecuador (%)
Place of birth for the foreign-born population - Guyana (%)
Place of birth for the foreign-born population - Peru (%)
Place of birth for the foreign-born population - Uruguay (%)
Place of birth for the foreign-born population - Venezuela (%)
Place of birth for the foreign-born population - Other South America (%)
Place of birth for the foreign-born population - Canada (%)
Place of birth for the foreign-born population - Other Northern America (%)
Place of birth for the foreign-born population - Other (%)
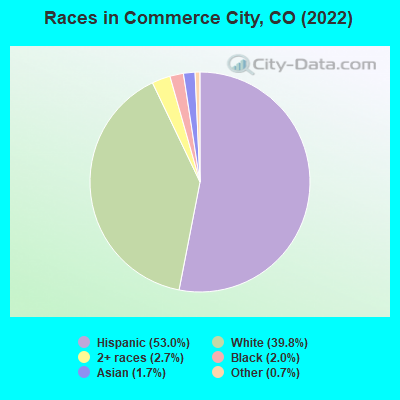
According to 2022 data, the most numerous races in Commerce City, CO are White alone (23,758 residents), Hispanic (30,609 residents), and Two or more races (2,506 residents). 67.2% of Commerce City residents speak English at home. 15.0% of Commerce City, CO residents are foreign-born (12.1% born in Latin America), which is 40.0% greater than the foreign-born rate of 9.0% across the entire state of Colorado.
Race distribution in Commerce City
2000 2022
3,202,880 74.5% White alone 735,601 17.1% Hispanic 158,443 3.7% Black alone 93,277 2.2% Asian alone 72,721 1.7% Two or more races 28,982 0.7% American Indian alone 5,512 0.1% Other race alone 3,845 0.09% Native Hawaiian and Other
3,793,270 65.0% White alone 1,314,962 22.5% Hispanic 268,754 4.6% Two or more races 220,756 3.8% Black alone 182,658 3.1% Asian alone 29,798 0.5% Other race alone 23,389 0.4% American Indian alone 6,339 0.1% Native Hawaiian and Other
Income and house value in Commerce City Median household income in 2022 $116,488 White non-Hispanic householders$48,265 Black householders$176,115 American Indian and Alaska Native householders$76,291 Asian householders$72,923 Some other race householders$97,813 Two or more races householders$83,048 Hispanic or Latino race householdersMedian 2022 house value $370,210 White Non-Hispanic householders$452,479 American Indian or Alaska Native householders $329,076 Asian householders$391,773 Some other race householders$422,955 Two or more races householders$377,840 Hispanic or Latino householders
Median age by race in Commerce City
34.0 Median age for White residents33.9 34.2 24.3 Median age for Black or African American residents24.6 25.3 42.1 Median age for American Indian / Alaska Native residents43.5 41.4 39.4 Median age for Asian residents42.5 37.1 42.3 Median age for Native Hawaiian / Pacific Islander residents31.0 Median age for Other race residents25.0 32.5 33.2 Median age for Two or more races residents32.9 33.3 37.2 Median age for White alone residents36.9 37.8 28.0 Median age for Hispanic or Latino residents27.0 28.3
Owner/renter occupied households by race in Commerce City
House owners and renters - White residents 10,557 76.9% Owner occupied3,174 23.1% Renter occupiedHouse owners and renters - Black or African American residents 386 61.7% Owner occupied240 38.3% Renter occupiedHouse owners and renters - American Indian / Alaska Native residents 202 91.4% Owner occupied19 8.6% Renter occupiedHouse owners and renters - Asian residents 313 83.9% Owner occupied60 16.1% Renter occupiedHouse owners and renters - Native Hawaiian / Pacific Islander residents 51 100.0% Owner occupiedHouse owners and renters - Other race residents 1,208 75.5% Owner occupied392 24.5% Renter occupiedHouse owners and renters - Two or more races residents 2,943 85.0% Owner occupied520 15.0% Renter occupiedHouse owners and renters - White alone residents 7,214 83.0% Owner occupied1,482 17.0% Renter occupiedHouse owners and renters - Hispanic or Latino residents 5,501 69.8% Owner occupied2,380 30.2% Renter occupied
Language usage in Commerce City
English speakers - Total 67.2% of residents of Commerce City speak English at home.
26.5% of residents speak Spanish at home 8,771 62.0% Speak English very well5,382 38.0% Speak English less than very well5.1% of residents speak other language at home 1,855 67.9% Speak English very well878 32.1% Speak English less than very well
English speakers - Born in the United States 87.3% of residents of Commerce City speak English at home.
11.5% of residents speak Spanish at home 1,439 83.0% Speak English very well294 17.0% Speak English less than very well1.2% of residents speak other language at home 165 91.2% Speak English very well16 8.8% Speak English less than very well
English speakers - Native, born elsewhere 61.6% of residents of Commerce City speak English at home.
34.5% of residents speak Spanish at home 113 58.2% Speak English very well81 41.8% Speak English less than very well5.0% of residents speak other language at home 28 100.0% Speak English very well
English speakers - Foreign-born 11.0% of residents of Commerce City speak English at home.
68.9% of residents speak Spanish at home 2,187 35.9% Speak English very well3,908 64.1% Speak English less than very well17.9% of residents speak other language at home 980 62.0% Speak English very well601 38.0% Speak English less than very well
White (Caucasian) - Speak only English Native:
80.8% (28,328)Foreign-born:
16.5% (635)
White (Caucasian) - Speak another language Native:
15.5% (5,440)Foreign-born:
79.7% (3,076)
Black or African American - Speak only English Native:
71.4% (1,239)Foreign-born:
8.6% (59)
Black or African American - Speak another language Native:
34.4% (597)Foreign-born:
92.9% (633)
American Indian / Alaska Native - Speak another language Native:
7.5% (34)Foreign-born:
100.0% (104)
Asian - Speak only English Native:
47.8% (215)Foreign-born:
44.8% (314)
Asian - Speak another language Native:
50.2% (225)Foreign-born:
64.1% (449)
Native Hawaiian / Pacific Islander - Speak only English Native:
100.0% (27)Foreign-born:
100.0% (14)
Other race - Speak only English Native:
50.0% (1,502)Foreign-born:
7.4% (99)
Other race - Speak another language Native:
49.4% (1,484)Foreign-born:
91.5% (1,232)
Two or more races - Speak only English Native:
61.8% (4,284)Foreign-born:
6.6% (149)
Two or more races - Speak another language Native:
68.4% (4,740)Foreign-born:
92.4% (2,096)
White alone - Speak only English Native:
96.7% (20,815)Foreign-born:
21.1% (173)
White alone - Speak another language Native:
3.3% (711)Foreign-born:
78.6% (645)
Hispanic or Latino - Speak only English Native:
56.1% (12,051)Foreign-born:
11.8% (746)
Hispanic or Latino - Speak another language Native:
43.0% (9,237)Foreign-born:
90.6% (5,728)
Foreign-born residents in Commerce City 8,933 residents are foreign born (12.1% Latin America ).
This city:
15.0%Colorado:
100.0%
Marital status for residents in Commerce City Marital status - White (Caucasian) population 15 years and over
Males 32.7% Never married55.3% Now married0.3% Separated2.0% Widowed9.7% DivorcedFemales 26.8% Never married53.5% Now married1.8% Separated4.7% Widowed13.3% DivorcedWomen who gave birth in the past 12 months Now married:
82.3% (585)Unmarried:
17.7% (126)
Women who did not give birth in the past 12 months Now married:
52.4% (5,501)Unmarried:
47.6% (4,997)
Marital status - Black or African American population 15 years and over
Males 45.1% Never married48.8% Now married1.5% Separated0.3% Widowed4.3% DivorcedFemales 47.6% Never married35.5% Now married5.0% Separated0.0% Widowed12.0% DivorcedWomen who gave birth in the past 12 months Now married:
100.0% (17)Unmarried:
0.0% (0)
Women who did not give birth in the past 12 months Now married:
30.2% (209)Unmarried:
69.8% (484)
Marital status - American Indian / Alaska Native population 15 years and over
Males 27.3% Never married71.2% Now married0.0% Separated0.0% Widowed1.5% DivorcedFemales 15.6% Never married67.4% Now married0.0% Separated1.4% Widowed15.6% DivorcedWomen who did not give birth in the past 12 months Now married:
58.7% (50)Unmarried:
41.3% (35)
Marital status - Asian population 15 years and over
Males 23.3% Never married59.0% Now married0.0% Separated4.9% Widowed12.8% DivorcedFemales 15.8% Never married71.0% Now married0.0% Separated6.0% Widowed7.1% DivorcedWomen who gave birth in the past 12 months Now married:
100.0% (8)Unmarried:
0.0% (0)
Women who did not give birth in the past 12 months Now married:
67.5% (248)Unmarried:
32.5% (120)
Marital status - Other race population 15 years and over
Males 39.9% Never married52.9% Now married1.3% Separated0.0% Widowed5.9% DivorcedFemales 19.3% Never married49.6% Now married6.5% Separated6.5% Widowed18.2% DivorcedWomen who gave birth in the past 12 months Now married:
77.0% (91)Unmarried:
23.0% (27)
Women who did not give birth in the past 12 months Now married:
62.9% (643)Unmarried:
37.1% (379)
Marital status - Two or more races population 15 years and over
Males 45.8% Never married42.1% Now married0.0% Separated6.4% Widowed5.8% DivorcedFemales 40.6% Never married48.4% Now married1.5% Separated1.2% Widowed8.3% DivorcedWomen who gave birth in the past 12 months Now married:
100.0% (95)Unmarried:
0.0% (0)
Women who did not give birth in the past 12 months Now married:
47.1% (1,041)Unmarried:
52.9% (1,169)
Marital status - White alone, not Hispanic / Latino population 15 years and over
Males 26.8% Never married58.4% Now married0.0% Separated2.0% Widowed12.8% DivorcedFemales 21.7% Never married58.5% Now married0.6% Separated5.3% Widowed13.9% DivorcedWomen who gave birth in the past 12 months Now married:
81.3% (243)Unmarried:
18.7% (56)
Women who did not give birth in the past 12 months Now married:
59.9% (3,510)Unmarried:
40.1% (2,345)
Marital status - Hispanic or Latino population 15 years and over
Males 40.1% Never married51.5% Now married0.7% Separated1.7% Widowed6.0% DivorcedFemales 32.2% Never married46.9% Now married3.5% Separated4.0% Widowed13.3% DivorcedWomen who gave birth in the past 12 months Now married:
82.0% (505)Unmarried:
18.0% (111)
Women who did not give birth in the past 12 months Now married:
45.6% (3,287)Unmarried:
54.4% (3,923)
Ancestries in Commerce City
1,665 5.6% German1,094 3.7% English914 3.1% American770 2.6% Irish481 1.6% Italian409 1.4% European247 0.8% Norwegian215 0.7% Afghan153 0.5% Scotch-Irish133 0.5% African128 0.4% British122 0.4% French121 0.4% Polish106 0.4% Scottish102 0.3% Russian95 0.3% Yugoslavian86 0.3% Dutch82 0.3% Welsh78 0.3% Ghanaian62 0.2% French Canadian55 0.2% Belgian48 0.2% Scandinavian45 0.2% Czech43 0.1% South African43 0.1% Ukrainian42 0.1% Swedish38 0.1% Hungarian37 0.1% Finnish35 0.1% Somali32 0.1% Basque30 0.1% Guyanese28 0.09% Lithuanian20 0.07% Maltese20 0.07% Greek19 0.06% Canadian18 0.06% Moroccan18 0.06% Eastern European15 0.05% Portuguese14 0.05% Slovak10 0.03% Danish10 0.03% Jamaican7 0.02% Swiss6 0.02% Slovene
Geographical mobility in Commerce City Same house 1 year ago 36,803 86.4% White (Caucasian)1,903 75.1% Black or African American486 86.7% American Indian / Alaska Native1,039 87.9% Asian51 94.1% Native Hawaiian / Pacific Islander4,155 86.8% Other race6,487 92.6% Two or more races20,404 86.8% White alone, not Hispanic / Latino25,764 89.5% Hispanic or LatinoMoved within same county 2,451 5.8% White / Caucasian224 8.9% Black or African American15 2.7% American Indian / Alaska Native102 8.7% Asian194 4.1% Other race465 6.6% Two or more races1,273 5.4% White alone, not Hispanic / Latino1,492 5.2% Hispanic or LatinoMoved within same state 2,380 5.6% White / Caucasian274 10.8% Black or African American6 0.5% Asian169 3.5% Other race198 2.8% Two or more races1,203 5.1% White alone, not Hispanic / Latino1,106 3.8% Hispanic or LatinoMoved from different state 840 2.0% White / Caucasian133 5.3% Black or African American6 1.1% American Indian / Alaska Native33 2.8% Asian2 0.0% Two or more races658 2.8% White alone, not Hispanic / Latino241 0.8% Hispanic or LatinoMoved from abroad 104 0.2% White4 0.2% Black or African American56 10.0% American Indian / Alaska Native15 1.2% Asian71 1.5% Other race26 0.1% White alone, not Hispanic / Latino226 0.8% Hispanic or Latino
Children Nativity (place of birth) in Commerce City
Children under 6 years - Living with two parents Both parents native 2,730 100.0% NativeBoth parents foreign-born 683 95.7% Native31 4.3% Foreign-bornOne native, one foreign-born parent 901 99.3% Native6 0.7% Foreign-bornChildren under 6 years - Living with one parent Native parent 1,061 100.0% NativeForeign-born parent 53 100.0% NativeChildren 6 to 17 years - Living with two parents Both parents native 5,029 100.0% NativeBoth parents foreign-born 1,863 86.9% Native282 13.1% Foreign-bornOne native, one foreign-born parent 1,705 97.1% Native52 2.9% Foreign-bornChildren 6 to 17 years - Living with one parent Native parent 2,459 100.0% NativeForeign-born parent 776 50.5% Native760 49.5% Foreign-born
Grandparents responsible for own grandchildren in Commerce City
Grandparents (30 to 59 years) White / Caucasian 183 37.0% Responsible for grandchildren312 63.0% Not responsible for grandchildrenBlack or African American 16 100.0% Not responsible for grandchildrenAmerican Indian / Alaska Native 40 84.7% Responsible for grandchildren7 15.3% Not responsible for grandchildrenAsian 15 100.0% Not responsible for grandchildrenOther race 11 100.0% Not responsible for grandchildrenTwo or more races 149 100.0% Responsible for grandchildrenWhite alone, not Hispanic / Latino 31 15.4% Responsible for grandchildren168 84.6% Not responsible for grandchildrenHispanic or Latino 262 49.8% Responsible for grandchildren265 50.2% Not responsible for grandchildrenGrandparents (60 years and over) White / Caucasian 157 26.2% Responsible for grandchildren442 73.8% Not responsible for grandchildrenBlack or African American 22 100.0% Not responsible for grandchildrenAmerican Indian / Alaska Native 18 100.0% Not responsible for grandchildrenAsian 125 100.0% Not responsible for grandchildrenOther race 163 93.7% Responsible for grandchildren11 6.3% Not responsible for grandchildrenWhite alone, not Hispanic / Latino 217 33.2% Responsible for grandchildren435 66.8% Not responsible for grandchildrenHispanic or Latino 114 49.1% Responsible for grandchildren118 50.9% Not responsible for grandchildren