Races in Commerce, Texas (TX) Detailed Stats
Data:
Races - White alone (%)
Races - White alone (% change since 2000)
Races - Black alone (%)
Races - Black alone (% change since 2000)
Races - American Indian alone (%)
Races - American Indian alone (% change since 2000)
Races - Asian alone (%)
Races - Asian alone (% change since 2000)
Races - Hispanic (%)
Races - Hispanic (% change since 2000)
Races - Native Hawaiian and Other Pacific Islander alone (%)
Races - Native Hawaiian and Other Pacific Islander alone (% change since 2000)
Races - Two or more races(%)
Races - Two or more races(% change since 2000)
Races - Other race alone (%)
Races - Other race alone (% change since 2000)
Racial diversity
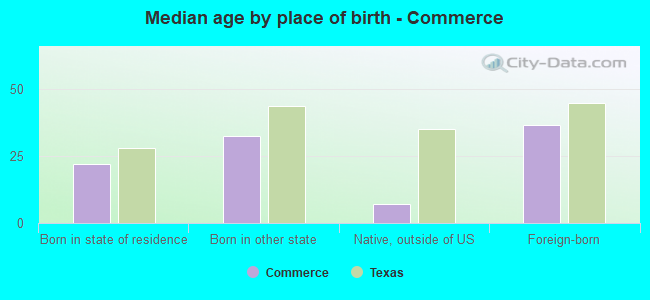
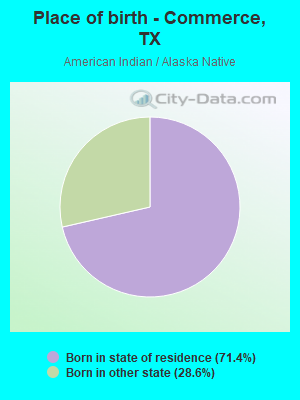
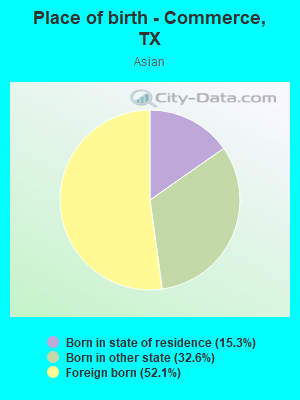
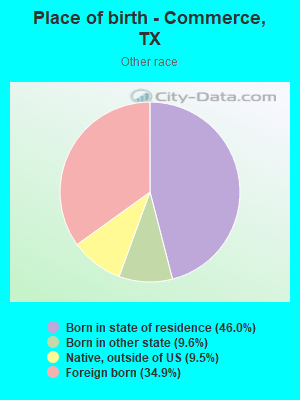
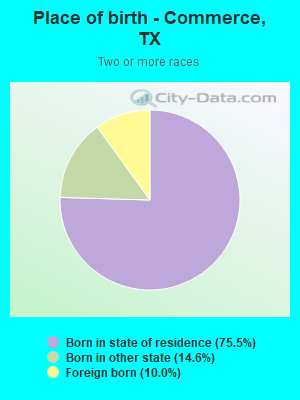
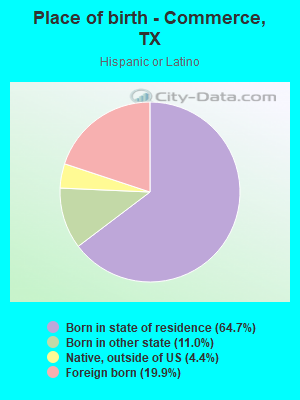
Place of birth - Born in state of residence (%)
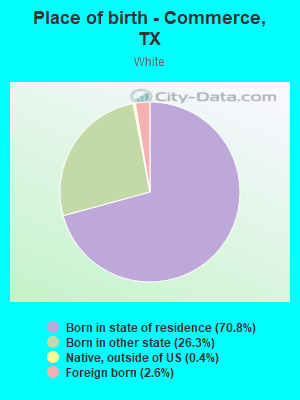
Place of birth - Born in state of residence (%) - White
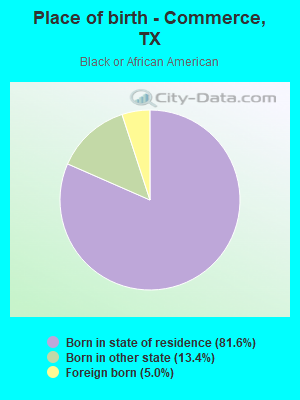
Place of birth - Born in state of residence (%) - Black or African American
Place of birth - Born in state of residence (%) - Asian
Place of birth - Born in state of residence (%) - Hispanic or Latino
Place of birth - Born in state of residence (%) - American Indian and Alaska Native
Place of birth - Born in state of residence (%) - Multirace
Place of birth - Born in state of residence (%) - Other Race
Place of birth - Born in other state (%)
Place of birth - Born in other state (%) - White
Place of birth - Born in other state (%) - Black or African American
Place of birth - Born in other state (%) - Asian
Place of birth - Born in other state (%) - Hispanic or Latino
Place of birth - Born in other state (%) - American Indian and Alaska Native
Place of birth - Born in other state (%) - Multirace
Place of birth - Born in other state (%) - Other Race
Place of birth - Native, outside of US (%)
Place of birth - Native, outside of US (%) - White
Place of birth - Native, outside of US (%) - Black or African American
Place of birth - Native, outside of US (%) - Asian
Place of birth - Native, outside of US (%) - Hispanic or Latino
Place of birth - Native, outside of US (%) - American Indian and Alaska Native
Place of birth - Native, outside of US (%) - Multirace
Place of birth - Native, outside of US (%) - Other Race
Place of birth - Foreign born (%)
Place of birth - Foreign born (%) - White
Place of birth - Foreign born (%) - Black or African American
Place of birth - Foreign born (%) - Asian
Place of birth - Foreign born (%) - Hispanic or Latino
Place of birth - Foreign born (%) - American Indian and Alaska Native
Place of birth - Foreign born (%) - Multirace
Place of birth - Foreign born (%) - Other Race
Residents speaking English at home (%)
Residents speaking English at home - Born in the United States (%)
Residents speaking English at home - Native, born elsewhere (%)
Residents speaking English at home - Foreign born (%)
Residents speaking Spanish at home (%)
Residents speaking Spanish at home - Born in the United States (%)
Residents speaking Spanish at home - Native, born elsewhere (%)
Residents speaking Spanish at home - Foreign born (%)
Residents speaking other language at home (%)
Residents speaking other language at home - Born in the United States (%)
Residents speaking other language at home - Native, born elsewhere (%)
Residents speaking other language at home - Foreign born (%)
Marital status - Never married (%)
Marital status - Now married (%)
Marital status - Separated (%)
Marital status - Widowed (%)
Marital status - Divorced (%)
Ancestries Reported - Arab (%)
Ancestries Reported - Czech (%)
Ancestries Reported - Danish (%)
Ancestries Reported - Dutch (%)
Ancestries Reported - English (%)
Ancestries Reported - French (%)
Ancestries Reported - French Canadian (%)
Ancestries Reported - German (%)
Ancestries Reported - Greek (%)
Ancestries Reported - Hungarian (%)
Ancestries Reported - Irish (%)
Ancestries Reported - Italian (%)
Ancestries Reported - Lithuanian (%)
Ancestries Reported - Norwegian (%)
Ancestries Reported - Polish (%)
Ancestries Reported - Portuguese (%)
Ancestries Reported - Russian (%)
Ancestries Reported - Scotch-Irish (%)
Ancestries Reported - Scottish (%)
Ancestries Reported - Slovak (%)
Ancestries Reported - Subsaharan African (%)
Ancestries Reported - Swedish (%)
Ancestries Reported - Swiss (%)
Ancestries Reported - Ukrainian (%)
Ancestries Reported - United States (%)
Ancestries Reported - Welsh (%)
Ancestries Reported - West Indian (%)
Ancestries Reported - Other (%)
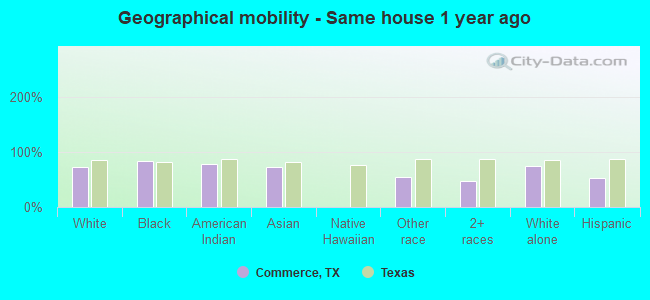
Geographical mobility - Same house 1 year ago (%)
Geographical mobility - Same house 1 year ago (%) - White
Geographical mobility - Same house 1 year ago (%) - Black or African American
Geographical mobility - Same house 1 year ago (%) - Asian
Geographical mobility - Same house 1 year ago (%) - Hispanic or Latino
Geographical mobility - Same house 1 year ago (%) - American Indian and Alaska Native
Geographical mobility - Same house 1 year ago (%) - Multirace
Geographical mobility - Same house 1 year ago (%) - Other Race
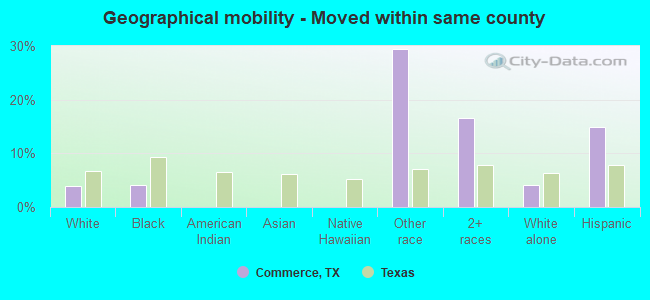
Geographical mobility - Moved within same county (%)
Geographical mobility - Moved within same county (%) - White
Geographical mobility - Moved within same county (%) - Black or African American
Geographical mobility - Moved within same county (%) - Asian
Geographical mobility - Moved within same county (%) - Hispanic or Latino
Geographical mobility - Moved within same county (%) - American Indian and Alaska Native
Geographical mobility - Moved within same county (%) - Multirace
Geographical mobility - Moved within same county (%) - Other Race
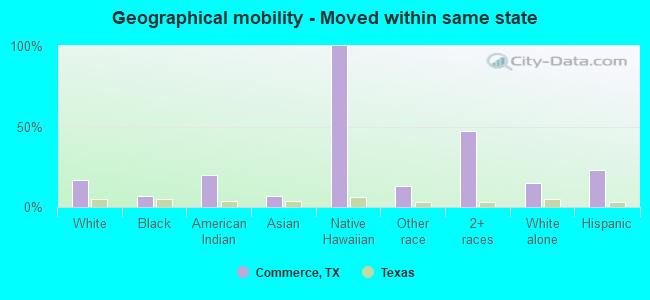
Geographical mobility - Moved from different county within same state (%)
Geographical mobility - Moved from different county within same state (%) - White
Geographical mobility - Moved from different county within same state (%) - Black or African American
Geographical mobility - Moved from different county within same state (%) - Asian
Geographical mobility - Moved from different county within same state (%) - Hispanic or Latino
Geographical mobility - Moved from different county within same state (%) - American Indian and Alaska Native
Geographical mobility - Moved from different county within same state (%) - Multirace
Geographical mobility - Moved from different county within same state (%) - Other Race
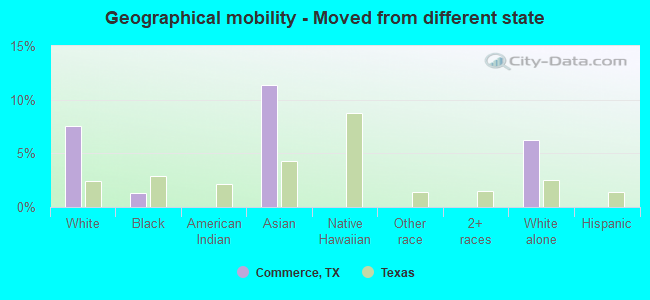
Geographical mobility - Moved from different state (%)
Geographical mobility - Moved from different state (%) - White
Geographical mobility - Moved from different state (%) - Black or African American
Geographical mobility - Moved from different state (%) - Asian
Geographical mobility - Moved from different state (%) - Hispanic or Latino
Geographical mobility - Moved from different state (%) - American Indian and Alaska Native
Geographical mobility - Moved from different state (%) - Multirace
Geographical mobility - Moved from different state (%) - Other Race
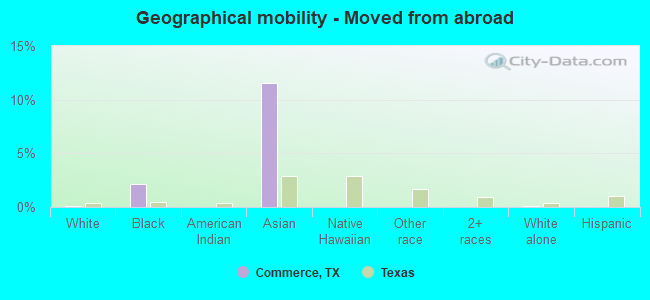
Geographical mobility - Moved from abroad (%)
Geographical mobility - Moved from abroad (%) - White
Geographical mobility - Moved from abroad (%) - Black or African American
Geographical mobility - Moved from abroad (%) - Asian
Geographical mobility - Moved from abroad (%) - Hispanic or Latino
Geographical mobility - Moved from abroad (%) - American Indian and Alaska Native
Geographical mobility - Moved from abroad (%) - Multirace
Geographical mobility - Moved from abroad (%) - Other Race
Place of birth for the foreign-born population - Ireland (%)
Place of birth for the foreign-born population - Denmark (%)
Place of birth for the foreign-born population - Norway (%)
Place of birth for the foreign-born population - Sweden (%)
Place of birth for the foreign-born population - United Kingdom (%)
Place of birth for the foreign-born population - England (%)
Place of birth for the foreign-born population - Scotland (%)
Place of birth for the foreign-born population - Other Northern Europe (%)
Place of birth for the foreign-born population - Austria (%)
Place of birth for the foreign-born population - Belgium (%)
Place of birth for the foreign-born population - France (%)
Place of birth for the foreign-born population - Germany (%)
Place of birth for the foreign-born population - Netherlands (%)
Place of birth for the foreign-born population - Switzerland (%)
Place of birth for the foreign-born population - Other Western Europe (%)
Place of birth for the foreign-born population - Greece (%)
Place of birth for the foreign-born population - Italy (%)
Place of birth for the foreign-born population - Portugal (%)
Place of birth for the foreign-born population - Spain (%)
Place of birth for the foreign-born population - Other Southern Europe (%)
Place of birth for the foreign-born population - Albania (%)
Place of birth for the foreign-born population - Belarus (%)
Place of birth for the foreign-born population - Bosnia and Herzegovina (%)
Place of birth for the foreign-born population - Bulgaria (%)
Place of birth for the foreign-born population - Croatia (%)
Place of birth for the foreign-born population - Czechoslovakia (%)
Place of birth for the foreign-born population - Hungary (%)
Place of birth for the foreign-born population - Latvia (%)
Place of birth for the foreign-born population - Lithuania (%)
Place of birth for the foreign-born population - North Macedonia (Macedonia) (%)
Place of birth for the foreign-born population - Moldova (%)
Place of birth for the foreign-born population - Poland (%)
Place of birth for the foreign-born population - Romania (%)
Place of birth for the foreign-born population - Russia (%)
Place of birth for the foreign-born population - Serbia (%)
Place of birth for the foreign-born population - Ukraine (%)
Place of birth for the foreign-born population - Other Eastern Europe (%)
Place of birth for the foreign-born population - China (%)
Place of birth for the foreign-born population - Hong Kong (%)
Place of birth for the foreign-born population - Taiwan (%)
Place of birth for the foreign-born population - Japan (%)
Place of birth for the foreign-born population - Korea (%)
Place of birth for the foreign-born population - Other Eastern Asia (%)
Place of birth for the foreign-born population - Afghanistan (%)
Place of birth for the foreign-born population - Bangladesh (%)
Place of birth for the foreign-born population - India (%)
Place of birth for the foreign-born population - Iran (%)
Place of birth for the foreign-born population - Kazakhstan (%)
Place of birth for the foreign-born population - Nepal (%)
Place of birth for the foreign-born population - Pakistan (%)
Place of birth for the foreign-born population - Sri Lanka (%)
Place of birth for the foreign-born population - Uzbekistan (%)
Place of birth for the foreign-born population - Other South Central Asia (%)
Place of birth for the foreign-born population - Burma (%)
Place of birth for the foreign-born population - Cambodia (%)
Place of birth for the foreign-born population - Indonesia (%)
Place of birth for the foreign-born population - Laos (%)
Place of birth for the foreign-born population - Malaysia (%)
Place of birth for the foreign-born population - Philippines (%)
Place of birth for the foreign-born population - Singapore (%)
Place of birth for the foreign-born population - Thailand (%)
Place of birth for the foreign-born population - Vietnam (%)
Place of birth for the foreign-born population - Other South Eastern Asia (%)
Place of birth for the foreign-born population - Armenia (%)
Place of birth for the foreign-born population - Iraq (%)
Place of birth for the foreign-born population - Israel (%)
Place of birth for the foreign-born population - Jordan (%)
Place of birth for the foreign-born population - Kuwait (%)
Place of birth for the foreign-born population - Lebanon (%)
Place of birth for the foreign-born population - Saudi Arabia (%)
Place of birth for the foreign-born population - Syria (%)
Place of birth for the foreign-born population - Turkey (%)
Place of birth for the foreign-born population - Yemen (%)
Place of birth for the foreign-born population - Other Western Asia (%)
Place of birth for the foreign-born population - Eritrea (%)
Place of birth for the foreign-born population - Ethiopia (%)
Place of birth for the foreign-born population - Kenya (%)
Place of birth for the foreign-born population - Somalia (%)
Place of birth for the foreign-born population - Uganda (%)
Place of birth for the foreign-born population - Zimbabwe (%)
Place of birth for the foreign-born population - Other Eastern Africa (%)
Place of birth for the foreign-born population - Cameroon (%)
Place of birth for the foreign-born population - Congo (%)
Place of birth for the foreign-born population - Democratic Republic of Congo (Zaire) (%)
Place of birth for the foreign-born population - Other Middle Africa (%)
Place of birth for the foreign-born population - Egypt (%)
Place of birth for the foreign-born population - Morocco (%)
Place of birth for the foreign-born population - Sudan (%)
Place of birth for the foreign-born population - Other Northern Africa (%)
Place of birth for the foreign-born population - South Africa (%)
Place of birth for the foreign-born population - Other Southern Africa (%)
Place of birth for the foreign-born population - Cabo Verde (%)
Place of birth for the foreign-born population - Ghana (%)
Place of birth for the foreign-born population - Liberia (%)
Place of birth for the foreign-born population - Nigeria (%)
Place of birth for the foreign-born population - Senegal (%)
Place of birth for the foreign-born population - Sierra Leone (%)
Place of birth for the foreign-born population - Other Western Africa (%)
Place of birth for the foreign-born population - Australia (%)
Place of birth for the foreign-born population - New Zealand (%)
Place of birth for the foreign-born population - Fiji (%)
Place of birth for the foreign-born population - Micronesia (%)
Place of birth for the foreign-born population - Bahamas (%)
Place of birth for the foreign-born population - Barbados (%)
Place of birth for the foreign-born population - Cuba (%)
Place of birth for the foreign-born population - Dominica (%)
Place of birth for the foreign-born population - Dominican Republic (%)
Place of birth for the foreign-born population - Grenada (%)
Place of birth for the foreign-born population - Haiti (%)
Place of birth for the foreign-born population - Jamaica (%)
Place of birth for the foreign-born population - St. Vincent and the Grenadines (%)
Place of birth for the foreign-born population - Trinidad and Tobago (%)
Place of birth for the foreign-born population - West Indies (%)
Place of birth for the foreign-born population - Other Caribbean (%)
Place of birth for the foreign-born population - Belize (%)
Place of birth for the foreign-born population - Costa Rica (%)
Place of birth for the foreign-born population - El Salvador (%)
Place of birth for the foreign-born population - Guatemala (%)
Place of birth for the foreign-born population - Honduras (%)
Place of birth for the foreign-born population - Mexico (%)
Place of birth for the foreign-born population - Nicaragua (%)
Place of birth for the foreign-born population - Panama (%)
Place of birth for the foreign-born population - Other Central America (%)
Place of birth for the foreign-born population - Argentina (%)
Place of birth for the foreign-born population - Bolivia (%)
Place of birth for the foreign-born population - Brazil (%)
Place of birth for the foreign-born population - Chile (%)
Place of birth for the foreign-born population - Colombia (%)
Place of birth for the foreign-born population - Ecuador (%)
Place of birth for the foreign-born population - Guyana (%)
Place of birth for the foreign-born population - Peru (%)
Place of birth for the foreign-born population - Uruguay (%)
Place of birth for the foreign-born population - Venezuela (%)
Place of birth for the foreign-born population - Other South America (%)
Place of birth for the foreign-born population - Canada (%)
Place of birth for the foreign-born population - Other Northern America (%)
Place of birth for the foreign-born population - Other (%)
Latest news about races in Commerce, TX collected exclusively by city-data.com from local newspapers, TV, and radio stations
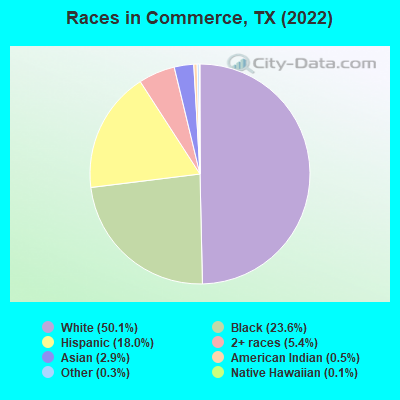
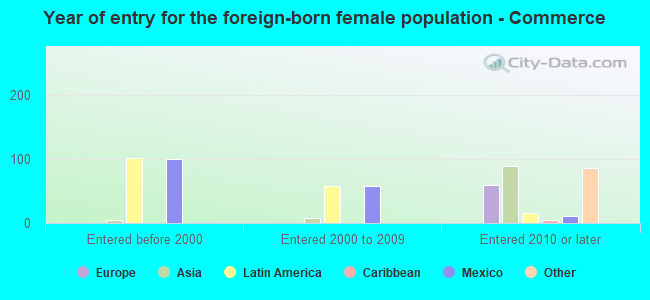
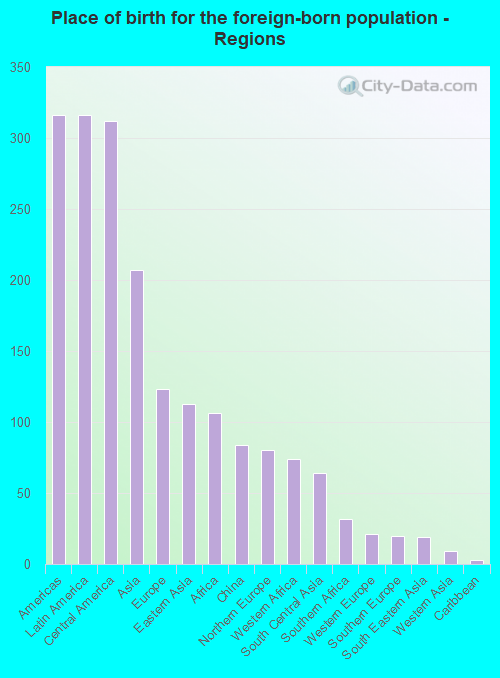
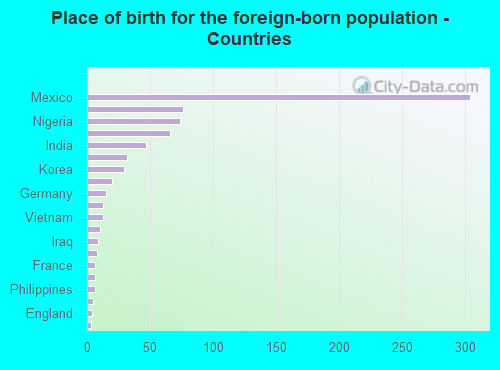
According to 2022 data, the most numerous races in Commerce, TX are Hispanic (1,739 residents), White alone (4,844 residents), and Black alone (2,287 residents). 82.7% of Commerce residents speak English at home. 7.8% of Commerce, TX residents are foreign-born (3.4% born in Latin America, 2.2% born in Asia, 1.3% born in Europe, 1.1% born in Africa), which is 118.4% less than the foreign-born rate of 17.0% across the entire state of Texas.
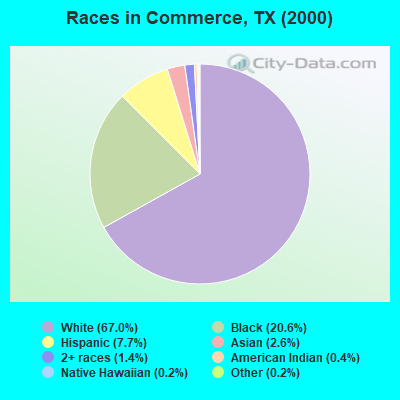
Race distribution in Commerce
2000 2022
10,933,313 52.4% White alone 6,669,666 32.0% Hispanic 2,364,255 11.3% Black alone 554,445 2.7% Asian alone 230,567 1.1% Two or more races 68,859 0.3% American Indian alone 19,958 0.10% Other race alone 10,757 0.05% Native Hawaiian and Other
12,070,642 40.2% Hispanic 11,683,430 38.9% White alone 3,508,706 11.7% Black alone 1,608,173 5.4% Asian alone 956,560 3.2% Two or more races 125,763 0.4% Other race alone 47,023 0.2% American Indian alone 29,275 0.10% Native Hawaiian and Other
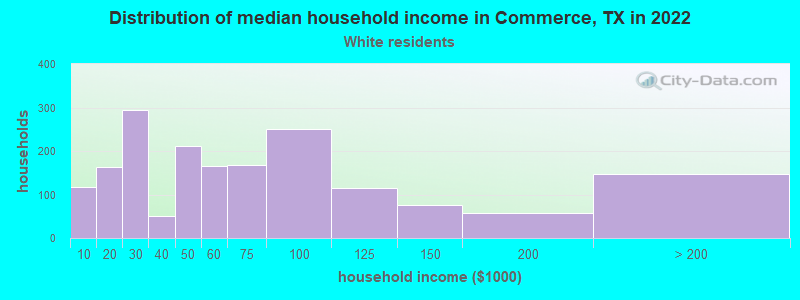
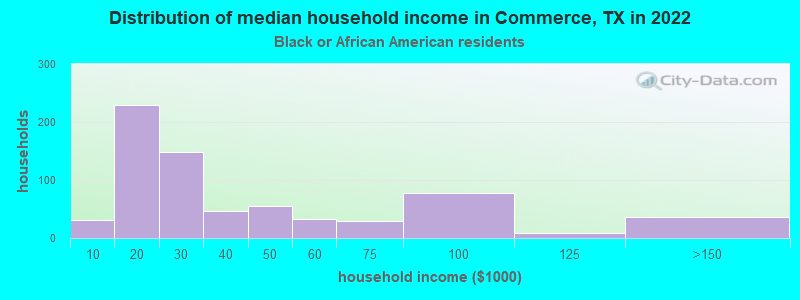
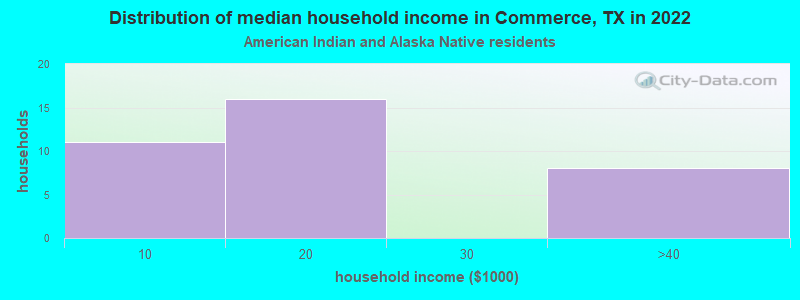
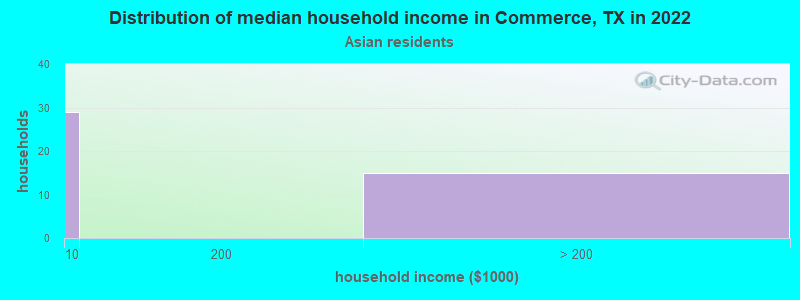
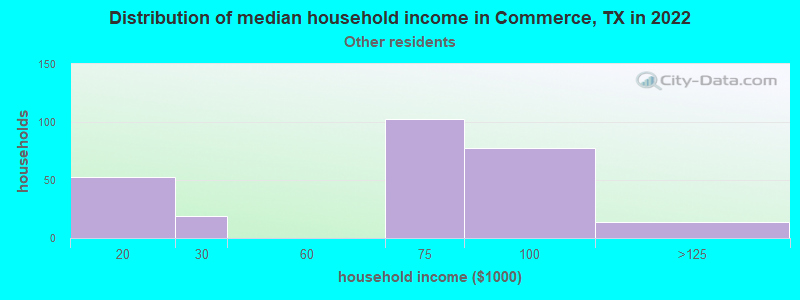
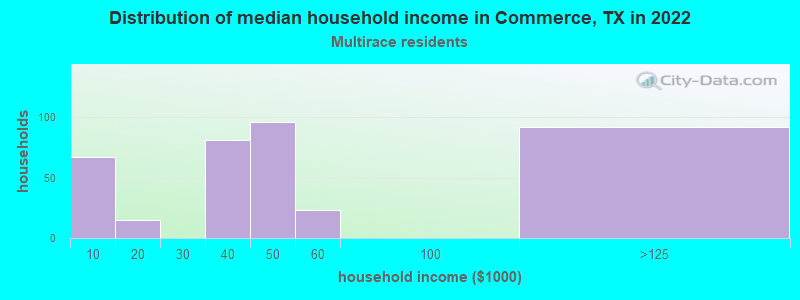
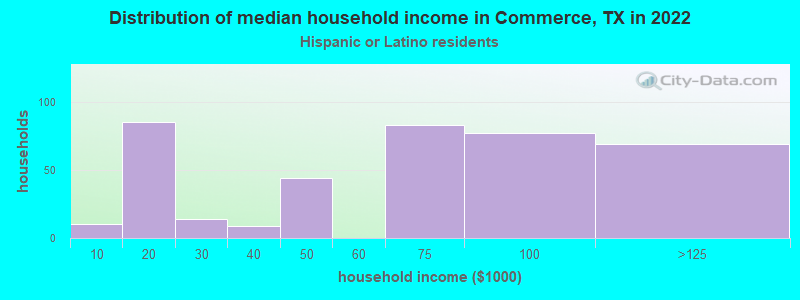
Income and house value in Commerce Median household income in 2022 $46,875 White non-Hispanic householders$40,785 Black householders$14,994 American Indian and Alaska Native householders$82,863 Some other race householders$46,316 Two or more races householders$73,499 Hispanic or Latino race householdersMedian 2022 house value $171,361 White Non-Hispanic householders$139,195 Black or African American householders$142,326 Two or more races householders$49,814 Hispanic or Latino householders
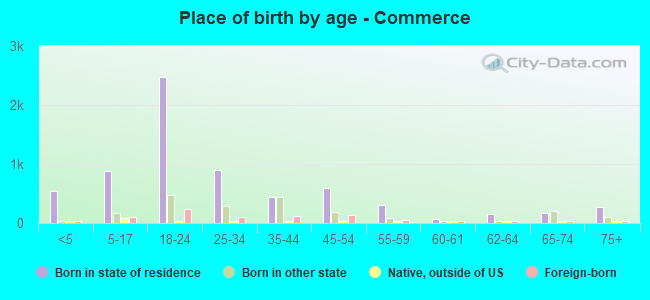
Median age by race in Commerce
27.3 Median age for White residents31.5 23.2 28.4 Median age for Black or African American residents25.5 32.8 39.0 Median age for American Indian / Alaska Native residents27.7 43.8 16.6 Median age for Asian residents24.3 18.9 -666,666,666.0 Median age for Native Hawaiian / Pacific Islander residents-666,666,666.0 -666,666,666.0 23.6 Median age for Other race residents30.8 18.2 20.6 Median age for Two or more races residents26.8 20.0 30.3 Median age for White alone residents35.5 28.2 21.2 Median age for Hispanic or Latino residents25.4 19.0
Owner/renter occupied households by race in Commerce
House owners and renters - White residents 862 45.2% Owner occupied1,045 54.8% Renter occupiedHouse owners and renters - Black or African American residents 276 49.8% Owner occupied278 50.2% Renter occupiedHouse owners and renters - American Indian / Alaska Native residents 10 28.5% Owner occupied26 71.5% Renter occupiedHouse owners and renters - Asian residents 15 35.4% Owner occupied27 64.6% Renter occupiedHouse owners and renters - Other race residents 94 58.0% Owner occupied68 42.0% Renter occupiedHouse owners and renters - Two or more races residents 76 28.8% Owner occupied187 71.2% Renter occupiedHouse owners and renters - White alone residents 811 44.2% Owner occupied1,023 55.8% Renter occupiedHouse owners and renters - Hispanic or Latino residents 138 44.6% Owner occupied172 55.4% Renter occupied
Language usage in Commerce
English speakers - Total 82.7% of residents of Commerce speak English at home.
13.6% of residents speak Spanish at home 1,013 82.0% Speak English very well223 18.0% Speak English less than very well4.9% of residents speak other language at home 416 93.3% Speak English very well30 6.7% Speak English less than very well
English speakers - Born in the United States 86.9% of residents of Commerce speak English at home.
9.2% of residents speak Spanish at home 145 75.9% Speak English very well46 24.1% Speak English less than very well1.9% of residents speak other language at home 39 100.0% Speak English very well
English speakers - Native, born elsewhere 48.9% of residents of Commerce speak English at home.
57.6% of residents speak Spanish at home 53 100.0% Speak English very well
English speakers - Foreign-born 25.0% of residents of Commerce speak English at home.
37.4% of residents speak Spanish at home 116 43.6% Speak English very well150 56.4% Speak English less than very well50.2% of residents speak other language at home 306 85.7% Speak English very well51 14.3% Speak English less than very well
White (Caucasian) - Speak only English Native:
96.4% (4,687)Foreign-born:
56.1% (77)
White (Caucasian) - Speak another language Native:
3.6% (173)Foreign-born:
51.1% (71)
Black or African American - Speak only English Native:
100.0% (1,821)Foreign-born:
28.2% (30)
Asian - Speak only English Native:
27.4% (41)Foreign-born:
13.8% (22)
Asian - Speak another language Native:
72.1% (107)Foreign-born:
86.3% (139)
Other race - Speak only English Native:
18.0% (77)Foreign-born:
8.7% (23)
Other race - Speak another language Native:
72.6% (312)Foreign-born:
77.0% (199)
Two or more races - Speak only English Native:
50.9% (461)Foreign-born:
23.8% (28)
Two or more races - Speak another language Native:
60.5% (549)Foreign-born:
76.4% (89)
White alone - Speak only English Native:
99.8% (4,364)Foreign-born:
72.9% (77)
White alone - Speak another language Native:
0.3% (15)Foreign-born:
27.2% (29)
Hispanic or Latino - Speak only English Native:
31.3% (420)Foreign-born:
9.8% (35)
Hispanic or Latino - Speak another language Native:
70.3% (944)Foreign-born:
80.4% (285)
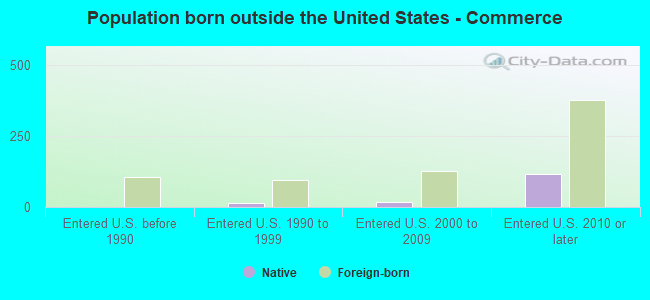
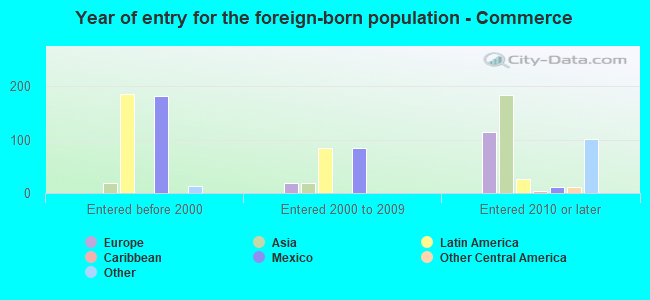
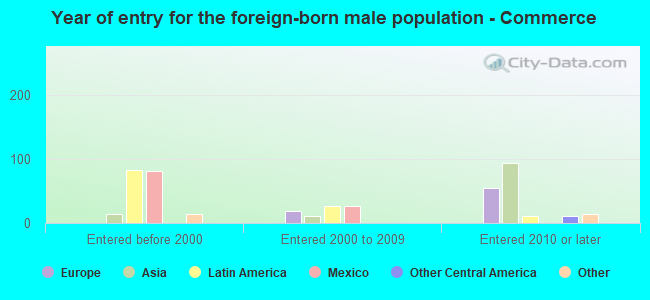
Foreign-born residents in Commerce 753 residents are foreign born (3.4% Latin America , 2.2% Asia , 1.3% Europe , 1.1% Africa ).
This city:
7.8%Texas:
17.1%
Marital status for residents in Commerce Marital status - White (Caucasian) population 15 years and over
Males 48.5% Never married34.4% Now married2.7% Separated4.7% Widowed9.6% DivorcedFemales 42.5% Never married32.0% Now married0.0% Separated11.2% Widowed14.4% DivorcedWomen who gave birth in the past 12 months Now married:
38.9% (14)Unmarried:
61.1% (23)
Women who did not give birth in the past 12 months Now married:
27.0% (496)Unmarried:
73.0% (1,342)
Marital status - Black or African American population 15 years and over
Males 68.8% Never married28.7% Now married0.0% Separated2.5% Widowed0.0% DivorcedFemales 59.5% Never married21.3% Now married7.4% Separated1.0% Widowed10.8% DivorcedWomen who gave birth in the past 12 months Now married:
0.0% (0)Unmarried:
100.0% (85)
Women who did not give birth in the past 12 months Now married:
27.6% (237)Unmarried:
72.4% (622)
Marital status - American Indian / Alaska Native population 15 years and over
Males 100.0% Never married0.0% Now married0.0% Separated0.0% Widowed0.0% DivorcedFemales 77.3% Never married22.7% Now married0.0% Separated0.0% Widowed0.0% DivorcedWomen who did not give birth in the past 12 months Now married:
22.7% (7)Unmarried:
77.3% (24)
Marital status - Asian population 15 years and over
Males 53.4% Never married39.0% Now married0.0% Separated7.5% Widowed0.0% DivorcedFemales 85.7% Never married14.3% Now married0.0% Separated0.0% Widowed0.0% DivorcedWomen who did not give birth in the past 12 months Now married:
8.8% (12)Unmarried:
91.2% (123)
Marital status - Other race population 15 years and over
Males 79.9% Never married20.1% Now married0.0% Separated0.0% Widowed0.0% DivorcedFemales 25.2% Never married31.6% Now married19.4% Separated0.0% Widowed23.8% DivorcedWomen who gave birth in the past 12 months Now married:
0.0% (0)Unmarried:
100.0% (16)
Women who did not give birth in the past 12 months Now married:
54.1% (144)Unmarried:
45.9% (122)
Marital status - Two or more races population 15 years and over
Males 65.6% Never married34.4% Now married0.0% Separated0.0% Widowed0.0% DivorcedFemales 73.3% Never married23.4% Now married0.0% Separated3.3% Widowed0.0% DivorcedWomen who gave birth in the past 12 months Now married:
0.0% (0)Unmarried:
100.0% (58)
Women who did not give birth in the past 12 months Now married:
24.4% (100)Unmarried:
75.6% (308)
Marital status - White alone, not Hispanic / Latino population 15 years and over
Males 45.1% Never married36.0% Now married3.0% Separated5.2% Widowed10.6% DivorcedFemales 39.4% Never married32.9% Now married0.0% Separated12.1% Widowed15.6% DivorcedWomen who gave birth in the past 12 months Now married:
35.3% (12)Unmarried:
64.7% (22)
Women who did not give birth in the past 12 months Now married:
28.7% (473)Unmarried:
71.3% (1,175)
Marital status - Hispanic or Latino population 15 years and over
Males 77.8% Never married22.2% Now married0.0% Separated0.0% Widowed0.0% DivorcedFemales 57.2% Never married24.8% Now married7.4% Separated1.7% Widowed9.0% DivorcedWomen who gave birth in the past 12 months Now married:
14.3% (2)Unmarried:
85.7% (14)
Women who did not give birth in the past 12 months Now married:
29.1% (168)Unmarried:
70.9% (409)
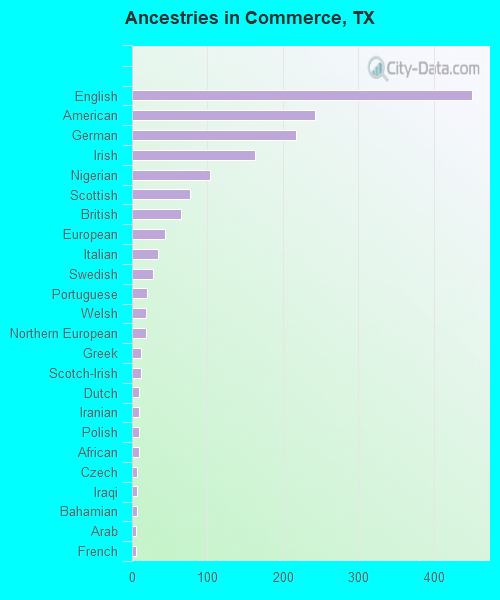
Ancestries in Commerce
451 10.7% English243 5.8% American217 5.2% German163 3.9% Irish104 2.5% Nigerian77 1.8% Scottish65 1.5% British44 1.0% European34 0.8% Italian28 0.7% Swedish20 0.5% Portuguese19 0.5% Welsh18 0.4% Northern European12 0.3% Greek12 0.3% Scotch-Irish9 0.2% Dutch9 0.2% Iranian9 0.2% Polish9 0.2% African7 0.2% Czech6 0.1% Iraqi6 0.1% Bahamian5 0.1% Arab5 0.1% French4 0.10% Russian3 0.07% Croatian
Children Nativity (place of birth) in Commerce
Children under 6 years - Living with two parents Both parents native 81 100.0% NativeBoth parents foreign-born 4 100.0% NativeOne native, one foreign-born parent 34 100.0% NativeChildren under 6 years - Living with one parent Native parent 633 100.0% NativeForeign-born parent 37 100.0% NativeChildren 6 to 17 years - Living with two parents Both parents native 302 100.0% NativeBoth parents foreign-born 35 100.0% NativeOne native, one foreign-born parent 94 69.2% Native42 30.8% Foreign-bornChildren 6 to 17 years - Living with one parent Native parent 218 100.0% NativeForeign-born parent 18 50.5% Native17 49.5% Foreign-born
Grandparents responsible for own grandchildren in Commerce
Grandparents (30 to 59 years) White / Caucasian 22 68.5% Responsible for grandchildren10 31.5% Not responsible for grandchildrenBlack or African American 42 52.7% Responsible for grandchildren37 47.3% Not responsible for grandchildrenWhite alone, not Hispanic / Latino 28 76.1% Responsible for grandchildren9 23.9% Not responsible for grandchildrenGrandparents (60 years and over) White / Caucasian 21 100.0% Responsible for grandchildrenBlack or African American 11 29.9% Responsible for grandchildren25 70.1% Not responsible for grandchildrenWhite alone, not Hispanic / Latino 20 100.0% Responsible for grandchildren