Races in Coolidge, Arizona (AZ) Detailed Stats
Data:
Races - White alone (%)
Races - White alone (% change since 2000)
Races - Black alone (%)
Races - Black alone (% change since 2000)
Races - American Indian alone (%)
Races - American Indian alone (% change since 2000)
Races - Asian alone (%)
Races - Asian alone (% change since 2000)
Races - Hispanic (%)
Races - Hispanic (% change since 2000)
Races - Native Hawaiian and Other Pacific Islander alone (%)
Races - Native Hawaiian and Other Pacific Islander alone (% change since 2000)
Races - Two or more races(%)
Races - Two or more races(% change since 2000)
Races - Other race alone (%)
Races - Other race alone (% change since 2000)
Racial diversity
Place of birth - Born in state of residence (%)
Place of birth - Born in state of residence (%) - White
Place of birth - Born in state of residence (%) - Black or African American
Place of birth - Born in state of residence (%) - Asian
Place of birth - Born in state of residence (%) - Hispanic or Latino
Place of birth - Born in state of residence (%) - American Indian and Alaska Native
Place of birth - Born in state of residence (%) - Multirace
Place of birth - Born in state of residence (%) - Other Race
Place of birth - Born in other state (%)
Place of birth - Born in other state (%) - White
Place of birth - Born in other state (%) - Black or African American
Place of birth - Born in other state (%) - Asian
Place of birth - Born in other state (%) - Hispanic or Latino
Place of birth - Born in other state (%) - American Indian and Alaska Native
Place of birth - Born in other state (%) - Multirace
Place of birth - Born in other state (%) - Other Race
Place of birth - Native, outside of US (%)
Place of birth - Native, outside of US (%) - White
Place of birth - Native, outside of US (%) - Black or African American
Place of birth - Native, outside of US (%) - Asian
Place of birth - Native, outside of US (%) - Hispanic or Latino
Place of birth - Native, outside of US (%) - American Indian and Alaska Native
Place of birth - Native, outside of US (%) - Multirace
Place of birth - Native, outside of US (%) - Other Race
Place of birth - Foreign born (%)
Place of birth - Foreign born (%) - White
Place of birth - Foreign born (%) - Black or African American
Place of birth - Foreign born (%) - Asian
Place of birth - Foreign born (%) - Hispanic or Latino
Place of birth - Foreign born (%) - American Indian and Alaska Native
Place of birth - Foreign born (%) - Multirace
Place of birth - Foreign born (%) - Other Race
Residents speaking English at home (%)
Residents speaking English at home - Born in the United States (%)
Residents speaking English at home - Native, born elsewhere (%)
Residents speaking English at home - Foreign born (%)
Residents speaking Spanish at home (%)
Residents speaking Spanish at home - Born in the United States (%)
Residents speaking Spanish at home - Native, born elsewhere (%)
Residents speaking Spanish at home - Foreign born (%)
Residents speaking other language at home (%)
Residents speaking other language at home - Born in the United States (%)
Residents speaking other language at home - Native, born elsewhere (%)
Residents speaking other language at home - Foreign born (%)
Marital status - Never married (%)
Marital status - Now married (%)
Marital status - Separated (%)
Marital status - Widowed (%)
Marital status - Divorced (%)
Ancestries Reported - Arab (%)
Ancestries Reported - Czech (%)
Ancestries Reported - Danish (%)
Ancestries Reported - Dutch (%)
Ancestries Reported - English (%)
Ancestries Reported - French (%)
Ancestries Reported - French Canadian (%)
Ancestries Reported - German (%)
Ancestries Reported - Greek (%)
Ancestries Reported - Hungarian (%)
Ancestries Reported - Irish (%)
Ancestries Reported - Italian (%)
Ancestries Reported - Lithuanian (%)
Ancestries Reported - Norwegian (%)
Ancestries Reported - Polish (%)
Ancestries Reported - Portuguese (%)
Ancestries Reported - Russian (%)
Ancestries Reported - Scotch-Irish (%)
Ancestries Reported - Scottish (%)
Ancestries Reported - Slovak (%)
Ancestries Reported - Subsaharan African (%)
Ancestries Reported - Swedish (%)
Ancestries Reported - Swiss (%)
Ancestries Reported - Ukrainian (%)
Ancestries Reported - United States (%)
Ancestries Reported - Welsh (%)
Ancestries Reported - West Indian (%)
Ancestries Reported - Other (%)
Geographical mobility - Same house 1 year ago (%)
Geographical mobility - Same house 1 year ago (%) - White
Geographical mobility - Same house 1 year ago (%) - Black or African American
Geographical mobility - Same house 1 year ago (%) - Asian
Geographical mobility - Same house 1 year ago (%) - Hispanic or Latino
Geographical mobility - Same house 1 year ago (%) - American Indian and Alaska Native
Geographical mobility - Same house 1 year ago (%) - Multirace
Geographical mobility - Same house 1 year ago (%) - Other Race
Geographical mobility - Moved within same county (%)
Geographical mobility - Moved within same county (%) - White
Geographical mobility - Moved within same county (%) - Black or African American
Geographical mobility - Moved within same county (%) - Asian
Geographical mobility - Moved within same county (%) - Hispanic or Latino
Geographical mobility - Moved within same county (%) - American Indian and Alaska Native
Geographical mobility - Moved within same county (%) - Multirace
Geographical mobility - Moved within same county (%) - Other Race
Geographical mobility - Moved from different county within same state (%)
Geographical mobility - Moved from different county within same state (%) - White
Geographical mobility - Moved from different county within same state (%) - Black or African American
Geographical mobility - Moved from different county within same state (%) - Asian
Geographical mobility - Moved from different county within same state (%) - Hispanic or Latino
Geographical mobility - Moved from different county within same state (%) - American Indian and Alaska Native
Geographical mobility - Moved from different county within same state (%) - Multirace
Geographical mobility - Moved from different county within same state (%) - Other Race
Geographical mobility - Moved from different state (%)
Geographical mobility - Moved from different state (%) - White
Geographical mobility - Moved from different state (%) - Black or African American
Geographical mobility - Moved from different state (%) - Asian
Geographical mobility - Moved from different state (%) - Hispanic or Latino
Geographical mobility - Moved from different state (%) - American Indian and Alaska Native
Geographical mobility - Moved from different state (%) - Multirace
Geographical mobility - Moved from different state (%) - Other Race
Geographical mobility - Moved from abroad (%)
Geographical mobility - Moved from abroad (%) - White
Geographical mobility - Moved from abroad (%) - Black or African American
Geographical mobility - Moved from abroad (%) - Asian
Geographical mobility - Moved from abroad (%) - Hispanic or Latino
Geographical mobility - Moved from abroad (%) - American Indian and Alaska Native
Geographical mobility - Moved from abroad (%) - Multirace
Geographical mobility - Moved from abroad (%) - Other Race
Place of birth for the foreign-born population - Ireland (%)
Place of birth for the foreign-born population - Denmark (%)
Place of birth for the foreign-born population - Norway (%)
Place of birth for the foreign-born population - Sweden (%)
Place of birth for the foreign-born population - United Kingdom (%)
Place of birth for the foreign-born population - England (%)
Place of birth for the foreign-born population - Scotland (%)
Place of birth for the foreign-born population - Other Northern Europe (%)
Place of birth for the foreign-born population - Austria (%)
Place of birth for the foreign-born population - Belgium (%)
Place of birth for the foreign-born population - France (%)
Place of birth for the foreign-born population - Germany (%)
Place of birth for the foreign-born population - Netherlands (%)
Place of birth for the foreign-born population - Switzerland (%)
Place of birth for the foreign-born population - Other Western Europe (%)
Place of birth for the foreign-born population - Greece (%)
Place of birth for the foreign-born population - Italy (%)
Place of birth for the foreign-born population - Portugal (%)
Place of birth for the foreign-born population - Spain (%)
Place of birth for the foreign-born population - Other Southern Europe (%)
Place of birth for the foreign-born population - Albania (%)
Place of birth for the foreign-born population - Belarus (%)
Place of birth for the foreign-born population - Bosnia and Herzegovina (%)
Place of birth for the foreign-born population - Bulgaria (%)
Place of birth for the foreign-born population - Croatia (%)
Place of birth for the foreign-born population - Czechoslovakia (%)
Place of birth for the foreign-born population - Hungary (%)
Place of birth for the foreign-born population - Latvia (%)
Place of birth for the foreign-born population - Lithuania (%)
Place of birth for the foreign-born population - North Macedonia (Macedonia) (%)
Place of birth for the foreign-born population - Moldova (%)
Place of birth for the foreign-born population - Poland (%)
Place of birth for the foreign-born population - Romania (%)
Place of birth for the foreign-born population - Russia (%)
Place of birth for the foreign-born population - Serbia (%)
Place of birth for the foreign-born population - Ukraine (%)
Place of birth for the foreign-born population - Other Eastern Europe (%)
Place of birth for the foreign-born population - China (%)
Place of birth for the foreign-born population - Hong Kong (%)
Place of birth for the foreign-born population - Taiwan (%)
Place of birth for the foreign-born population - Japan (%)
Place of birth for the foreign-born population - Korea (%)
Place of birth for the foreign-born population - Other Eastern Asia (%)
Place of birth for the foreign-born population - Afghanistan (%)
Place of birth for the foreign-born population - Bangladesh (%)
Place of birth for the foreign-born population - India (%)
Place of birth for the foreign-born population - Iran (%)
Place of birth for the foreign-born population - Kazakhstan (%)
Place of birth for the foreign-born population - Nepal (%)
Place of birth for the foreign-born population - Pakistan (%)
Place of birth for the foreign-born population - Sri Lanka (%)
Place of birth for the foreign-born population - Uzbekistan (%)
Place of birth for the foreign-born population - Other South Central Asia (%)
Place of birth for the foreign-born population - Burma (%)
Place of birth for the foreign-born population - Cambodia (%)
Place of birth for the foreign-born population - Indonesia (%)
Place of birth for the foreign-born population - Laos (%)
Place of birth for the foreign-born population - Malaysia (%)
Place of birth for the foreign-born population - Philippines (%)
Place of birth for the foreign-born population - Singapore (%)
Place of birth for the foreign-born population - Thailand (%)
Place of birth for the foreign-born population - Vietnam (%)
Place of birth for the foreign-born population - Other South Eastern Asia (%)
Place of birth for the foreign-born population - Armenia (%)
Place of birth for the foreign-born population - Iraq (%)
Place of birth for the foreign-born population - Israel (%)
Place of birth for the foreign-born population - Jordan (%)
Place of birth for the foreign-born population - Kuwait (%)
Place of birth for the foreign-born population - Lebanon (%)
Place of birth for the foreign-born population - Saudi Arabia (%)
Place of birth for the foreign-born population - Syria (%)
Place of birth for the foreign-born population - Turkey (%)
Place of birth for the foreign-born population - Yemen (%)
Place of birth for the foreign-born population - Other Western Asia (%)
Place of birth for the foreign-born population - Eritrea (%)
Place of birth for the foreign-born population - Ethiopia (%)
Place of birth for the foreign-born population - Kenya (%)
Place of birth for the foreign-born population - Somalia (%)
Place of birth for the foreign-born population - Uganda (%)
Place of birth for the foreign-born population - Zimbabwe (%)
Place of birth for the foreign-born population - Other Eastern Africa (%)
Place of birth for the foreign-born population - Cameroon (%)
Place of birth for the foreign-born population - Congo (%)
Place of birth for the foreign-born population - Democratic Republic of Congo (Zaire) (%)
Place of birth for the foreign-born population - Other Middle Africa (%)
Place of birth for the foreign-born population - Egypt (%)
Place of birth for the foreign-born population - Morocco (%)
Place of birth for the foreign-born population - Sudan (%)
Place of birth for the foreign-born population - Other Northern Africa (%)
Place of birth for the foreign-born population - South Africa (%)
Place of birth for the foreign-born population - Other Southern Africa (%)
Place of birth for the foreign-born population - Cabo Verde (%)
Place of birth for the foreign-born population - Ghana (%)
Place of birth for the foreign-born population - Liberia (%)
Place of birth for the foreign-born population - Nigeria (%)
Place of birth for the foreign-born population - Senegal (%)
Place of birth for the foreign-born population - Sierra Leone (%)
Place of birth for the foreign-born population - Other Western Africa (%)
Place of birth for the foreign-born population - Australia (%)
Place of birth for the foreign-born population - New Zealand (%)
Place of birth for the foreign-born population - Fiji (%)
Place of birth for the foreign-born population - Micronesia (%)
Place of birth for the foreign-born population - Bahamas (%)
Place of birth for the foreign-born population - Barbados (%)
Place of birth for the foreign-born population - Cuba (%)
Place of birth for the foreign-born population - Dominica (%)
Place of birth for the foreign-born population - Dominican Republic (%)
Place of birth for the foreign-born population - Grenada (%)
Place of birth for the foreign-born population - Haiti (%)
Place of birth for the foreign-born population - Jamaica (%)
Place of birth for the foreign-born population - St. Vincent and the Grenadines (%)
Place of birth for the foreign-born population - Trinidad and Tobago (%)
Place of birth for the foreign-born population - West Indies (%)
Place of birth for the foreign-born population - Other Caribbean (%)
Place of birth for the foreign-born population - Belize (%)
Place of birth for the foreign-born population - Costa Rica (%)
Place of birth for the foreign-born population - El Salvador (%)
Place of birth for the foreign-born population - Guatemala (%)
Place of birth for the foreign-born population - Honduras (%)
Place of birth for the foreign-born population - Mexico (%)
Place of birth for the foreign-born population - Nicaragua (%)
Place of birth for the foreign-born population - Panama (%)
Place of birth for the foreign-born population - Other Central America (%)
Place of birth for the foreign-born population - Argentina (%)
Place of birth for the foreign-born population - Bolivia (%)
Place of birth for the foreign-born population - Brazil (%)
Place of birth for the foreign-born population - Chile (%)
Place of birth for the foreign-born population - Colombia (%)
Place of birth for the foreign-born population - Ecuador (%)
Place of birth for the foreign-born population - Guyana (%)
Place of birth for the foreign-born population - Peru (%)
Place of birth for the foreign-born population - Uruguay (%)
Place of birth for the foreign-born population - Venezuela (%)
Place of birth for the foreign-born population - Other South America (%)
Place of birth for the foreign-born population - Canada (%)
Place of birth for the foreign-born population - Other Northern America (%)
Place of birth for the foreign-born population - Other (%)
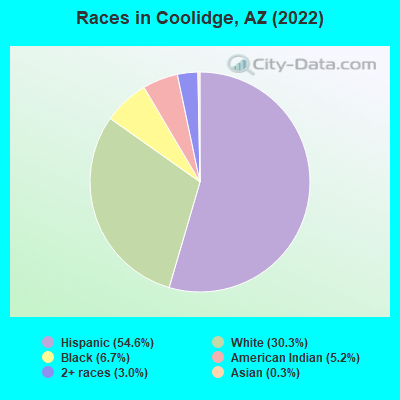
According to 2022 data, the most numerous races in Coolidge, AZ are White alone (5,020 residents), Hispanic (6,421 residents), and Black alone (1,182 residents). 78.1% of Coolidge residents speak English at home. 5.7% of Coolidge, AZ residents are foreign-born (5.3% born in Latin America), which is 128.2% less than the foreign-born rate of 13.0% across the entire state of Arizona.
Race distribution in Coolidge
2000 2022
3,274,258 63.8% White alone 1,295,617 25.3% Hispanic 233,370 4.5% American Indian alone 149,941 2.9% Black alone 89,315 1.7% Asian alone 76,372 1.5% Two or more races 6,120 0.1% Other race alone 5,639 0.1% Native Hawaiian and Other
3,814,587 51.8% White alone 2,388,520 32.5% Hispanic 322,459 4.4% Black alone 284,994 3.9% Two or more races 257,020 3.5% Asian alone 241,688 3.3% American Indian alone 36,042 0.5% Other race alone 13,887 0.2% Native Hawaiian and Other
Income and house value in Coolidge Median household income in 2022 $60,221 White non-Hispanic householders$109,929 Black householders$153,640 American Indian and Alaska Native householders$86,121 Asian householders$84,117 Some other race householders$76,514 Two or more races householders$69,144 Hispanic or Latino race householdersMedian 2022 house value $231,959 White Non-Hispanic householders$90,206 Black or African American householders$103,829 American Indian or Alaska Native householders $202,504 Asian householders$208,763 Some other race householders$187,040 Two or more races householders$206,922 Hispanic or Latino householders
Median age by race in Coolidge
40.1 Median age for White residents38.9 41.4 37.5 Median age for Black or African American residents24.0 47.2 31.4 Median age for American Indian / Alaska Native residents29.8 32.3 36.4 Median age for Asian residents28.7 Median age for Other race residents30.8 10.8 15.4 Median age for Two or more races residents13.1 19.4 45.2 Median age for White alone residents44.1 45.7 30.1 Median age for Hispanic or Latino residents26.2 32.3
Owner/renter occupied households by race in Coolidge
House owners and renters - White residents 1,869 66.7% Owner occupied934 33.3% Renter occupiedHouse owners and renters - Black or African American residents 250 58.0% Owner occupied181 42.0% Renter occupiedHouse owners and renters - American Indian / Alaska Native residents 114 78.7% Owner occupied31 21.3% Renter occupiedHouse owners and renters - Asian residents 7 100.0% Renter occupiedHouse owners and renters - Other race residents 95 87.9% Owner occupied13 12.1% Renter occupiedHouse owners and renters - Two or more races residents 364 80.2% Owner occupied90 19.8% Renter occupiedHouse owners and renters - White alone residents 1,328 67.4% Owner occupied641 32.6% Renter occupiedHouse owners and renters - Hispanic or Latino residents 927 67.4% Owner occupied448 32.6% Renter occupied
Language usage in Coolidge
English speakers - Total 78.1% of residents of Coolidge speak English at home.
21.8% of residents speak Spanish at home 2,087 78.8% Speak English very well563 21.2% Speak English less than very well0.4% of residents speak other language at home 53 98.1% Speak English very well1 1.9% Speak English less than very well
English speakers - Born in the United States 92.2% of residents of Coolidge speak English at home.
7.2% of residents speak Spanish at home 276 86.3% Speak English very well44 13.8% Speak English less than very well0.6% of residents speak other language at home 26 100.0% Speak English very well
English speakers - Native, born elsewhere 59.9% of residents of Coolidge speak English at home.
40.1% of residents speak Spanish at home 50 84.7% Speak English very well9 15.3% Speak English less than very well
English speakers - Foreign-born 9.6% of residents of Coolidge speak English at home.
86.5% of residents speak Spanish at home 280 42.5% Speak English very well379 57.5% Speak English less than very well3.5% of residents speak other language at home 27 100.0% Speak English very well
White (Caucasian) - Speak only English Native:
82.9% (6,644)Foreign-born:
11.3% (47)
White (Caucasian) - Speak another language Native:
15.1% (1,208)Foreign-born:
88.0% (361)
Black or African American - Speak another language Native:
0.2% (2)Foreign-born:
89.4% (21)
Other race - Speak another language Native:
20.3% (269)Foreign-born:
97.4% (91)
Two or more races - Speak another language Native:
80.4% (1,049)Foreign-born:
100.0% (560)
White alone - Speak only English Native:
96.7% (4,684)Foreign-born:
78.4% (51)
White alone - Speak another language Native:
3.3% (160)Foreign-born:
8.8% (6)
Hispanic or Latino - Speak another language Native:
38.1% (2,068)Foreign-born:
100.0% (693)
Foreign-born residents in Coolidge 786 residents are foreign born (5.3% Latin America ).
This city:
5.7%Arizona:
100.0%
Marital status for residents in Coolidge Marital status - White (Caucasian) population 15 years and over
Males 35.3% Never married42.1% Now married2.9% Separated1.7% Widowed18.0% DivorcedFemales 29.9% Never married35.0% Now married5.4% Separated6.4% Widowed23.3% DivorcedWomen who gave birth in the past 12 months Now married:
33.3% (12)Unmarried:
66.7% (23)
Women who did not give birth in the past 12 months Now married:
38.1% (743)Unmarried:
61.9% (1,205)
Marital status - Black or African American population 15 years and over
Males 78.6% Never married8.2% Now married11.2% Separated0.0% Widowed1.9% DivorcedFemales 14.7% Never married34.5% Now married44.2% Separated0.0% Widowed6.6% DivorcedWomen who gave birth in the past 12 months Now married:
0.0% (0)Unmarried:
100.0% (26)
Women who did not give birth in the past 12 months Now married:
82.6% (319)Unmarried:
17.4% (67)
Marital status - American Indian / Alaska Native population 15 years and over
Males 20.0% Never married63.4% Now married0.0% Separated3.8% Widowed12.8% DivorcedFemales 31.6% Never married47.4% Now married0.0% Separated7.9% Widowed13.2% DivorcedWomen who did not give birth in the past 12 months Now married:
36.3% (41)Unmarried:
63.7% (72)
Marital status - Other race population 15 years and over
Males 58.2% Never married32.9% Now married0.0% Separated2.6% Widowed6.3% DivorcedFemales 12.3% Never married22.5% Now married51.9% Separated1.9% Widowed11.4% DivorcedWomen who did not give birth in the past 12 months Now married:
80.9% (251)Unmarried:
19.1% (59)
Marital status - Two or more races population 15 years and over
Males 65.5% Never married15.5% Now married0.0% Separated0.0% Widowed19.1% DivorcedFemales 50.0% Never married40.0% Now married0.0% Separated0.0% Widowed10.0% DivorcedWomen who gave birth in the past 12 months Now married:
100.0% (53)Unmarried:
0.0% (0)
Women who did not give birth in the past 12 months Now married:
31.1% (93)Unmarried:
68.9% (206)
Marital status - White alone, not Hispanic / Latino population 15 years and over
Males 30.5% Never married44.8% Now married3.3% Separated1.9% Widowed19.5% DivorcedFemales 25.9% Never married43.7% Now married1.5% Separated9.6% Widowed19.4% DivorcedWomen who did not give birth in the past 12 months Now married:
44.2% (491)Unmarried:
55.8% (620)
Marital status - Hispanic or Latino population 15 years and over
Males 45.0% Never married39.4% Now married1.7% Separated1.6% Widowed12.3% DivorcedFemales 34.9% Never married28.4% Now married9.0% Separated2.6% Widowed25.2% DivorcedWomen who gave birth in the past 12 months Now married:
50.0% (30)Unmarried:
50.0% (30)
Women who did not give birth in the past 12 months Now married:
33.9% (504)Unmarried:
66.1% (982)
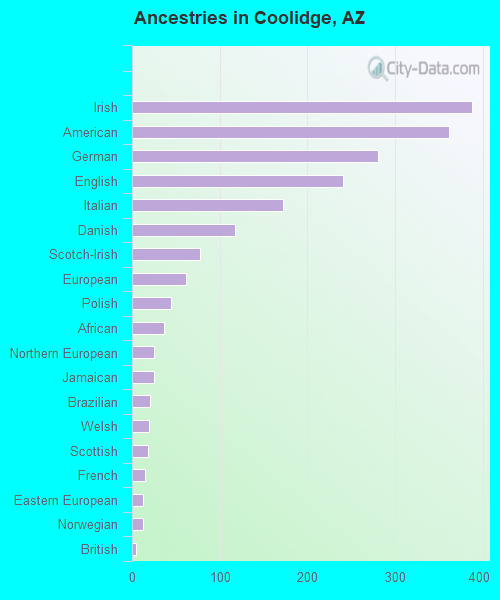
Ancestries in Coolidge
349 6.6% American277 5.2% Irish274 5.2% English201 3.8% German82 1.5% Danish52 1.0% Italian46 0.9% European27 0.5% Northern European27 0.5% Jamaican23 0.4% Swedish19 0.4% Canadian19 0.4% Scotch-Irish16 0.3% Scottish15 0.3% Norwegian11 0.2% French9 0.2% Greek7 0.1% Croatian7 0.1% Hungarian6 0.1% Czech5 0.09% Romanian
Children Nativity (place of birth) in Coolidge
Children under 6 years - Living with two parents Both parents native 403 100.0% NativeBoth parents foreign-born 10 100.0% NativeOne native, one foreign-born parent 9 100.0% NativeChildren under 6 years - Living with one parent Native parent 402 100.0% NativeForeign-born parent 18 100.0% NativeChildren 6 to 17 years - Living with two parents Both parents native 1,080 100.0% NativeBoth parents foreign-born 147 100.0% NativeOne native, one foreign-born parent 163 100.0% NativeChildren 6 to 17 years - Living with one parent Native parent 1,061 100.0% NativeForeign-born parent 95 50.3% Native93 49.7% Foreign-born
Grandparents responsible for own grandchildren in Coolidge
Grandparents (30 to 59 years) White / Caucasian 84 54.8% Responsible for grandchildren69 45.2% Not responsible for grandchildrenBlack or African American 94 100.0% Not responsible for grandchildrenAmerican Indian / Alaska Native 14 100.0% Not responsible for grandchildrenOther race 10 100.0% Not responsible for grandchildrenWhite alone, not Hispanic / Latino 26 100.0% Not responsible for grandchildrenHispanic or Latino 36 20.8% Responsible for grandchildren136 79.2% Not responsible for grandchildrenGrandparents (60 years and over) White / Caucasian 80 30.4% Responsible for grandchildren184 69.6% Not responsible for grandchildrenAmerican Indian / Alaska Native 18 41.9% Responsible for grandchildren26 58.1% Not responsible for grandchildrenOther race 42 100.0% Not responsible for grandchildrenWhite alone, not Hispanic / Latino 12 27.1% Responsible for grandchildren32 72.9% Not responsible for grandchildrenHispanic or Latino 77 15.3% Responsible for grandchildren424 84.7% Not responsible for grandchildren